KEY EVENTS TO WATCH FOR:
Monday, May 11, 2020
10:00 AM ET. April Employment Trends Index
ETI (previous 60.39)
ETI, Y/Y%
The STOCK INDEXES http://quotes.ino.com/exchanges/?c=indexes"
The STOCK INDEXES:The June NASDAQ 100 was lower in overnight trading.The low-range trade sets the stage for a steady to lower opening when the day session begins trading. Stochastics and the RSI are overbought but remain neutral to bullish signaling that sideways to higher prices are possible near-term. If June extends the rally off March's low, the 87% retracement level of the February-March-decline crossing at 9384.61 is the next upside target. Closes below the 20-day moving average crossing at 8825.20 would confirm that a short-term top has been posted. First resistance is the overnight high crossing at 9285.00. Second resistance is the 87% retracement level of the February-March-decline crossing at 9384.61. First support is the 20-day moving average crossing at 8825.20. Second support is last-Monday's low crossing at 8556.25.
The June S&P 500 was slightly higher in overnight trading as it extends the rally off last-Monday's low. The mid-range overnight trade sets the stage for a steady to higher opening when the day session begins trading later this morning.Stochastics and the RSI are neutral to bullish signaling that sideways to higher prices are possible near-term. If June renews the rally off March's low, the 75% retracement level of the February-March-decline crossing at 3081.80 is the next upside target. Closes below last-Monday's low crossing at 2775.40 would confirm that a short-term top has been posted. First resistance is April's high crossing at 2957.70. Second resistance is the 75% retracement level of the February-March-decline crossing at 3081.80. First support is last-Monday's low crossing at 2775.40. Second support is the reaction low crossing at 2720.20.
INTEREST RATES http://quotes.ino.com/ex changes/?c=interest"
INTEREST RATES: June T-bonds were lower in late-overnight trading. Stochastics and the RSI are neutral signaling that sideways to lower prices are possible near-term. Multiple closes below the reaction low crossing at 177-14 would mark a downside breakout of the April-May trading range. If June renews the rally off March's low, the March 12th high crossing at 184-07 is the next upside target. First resistance is the March 12th high crossing at 184-07. Second resistance is March's high crossing at 191-22. First support is the 50-day moving average crossing at 178-26. Second support is the reaction low crossing at 177-14.
June T-notes were steady to slightly higher overnight as it extends the April-May trading range. The high-range overnight trade sets the stage for a steady to higher opening with the day session begins trading. Stochastics and the RSI are neutral to bullish signaling that sideways to higher prices are possible near-term. If June renews the rally off March's low, March's high crossing at 140.240 is the next upside target. Closes below the April 7th low crossing at 137.160 would mark a downside breakout of the April-May trading range while opening the door for additional weakness near-term. First resistance is the April 21st high crossing at 139.220. Second resistance is March's high crossing at 140.240. First support is the 50-day moving average crossing at 138.000. Second support is the April 7th low crossing at 137.160.
ENERGY MARKETS? http://quotes.ino.com/ex?changes/?c=energy ""
June crude oil was steady to slightly lower in overnight trading.The low-range overnight trade sets the stage for a steady to lower opening when the day session begins trading. Stochastics and the RSI are overbought but remain neutral to bullish signaling that sideways to higher prices are possible near-term. If June extends the aforementioned rally, the 50-day moving average crossing at $27.08 is the next upside target. Closes below the 20-day moving average crossing at $20.56 would signal that a short-term top has been posted. First resistance is the 50-day moving average crossing at $27.08. Second resistance is April's high crossing at $33.15. First support is the 20-day moving average crossing at $20.56. Second support is the April 28th low crossing at $10.07. Third support is April's low crossing at $6.50.
June heating oil was steady to slightly lower overnight. The low-range overnight trade sets the stage for a steady to lower opening when the day session begins trading. Stochastics and the RSI remain neutral to bullish signaling that sideways to higher prices are possible near-term. If June extends the rally off April's low, the 50-day moving average crossing at 103.37 is the next upside target. Closes below the 10-day moving average crossing at 83.47 would temper the near-term friendly outlook. First resistance is last-Wednesday's high crossing at 91.99. Second resistance is the 50-day moving average crossing at 103.37. First support is April's low crossing at 67.24. Second support is the October-2001 low on the monthly continuation chart crossing at 49.30.
June unleaded gas was steady to slightly lower overnight. The low-range late-overnight trade sets the stage for a steady to lower opening when the day session begins trading. Stochastics and the RSI are overbought but remain neutral to bullish signaling that sideways to higher prices are possible near-term. If June extends the rally off April's low, the 38% retracement level of the January-March-decline crossing at 107.64 is the next upside target. Closes below the 20-day moving average crossing at 78.70 would temper the near-term friendly outlook. First resistance is the overnight high crossing at 97.73. Second resistance is the 38% retracement level of the January-March-decline crossing at 107.64. First support is the 20-day moving average crossing at 78.70. Second support is April's low crossing at 52.51.
June Henry natural gas was slightly higher overnight as it consolidated some of the decline off last-Tuesday's high. The high-range overnight trade sets the stage for a steady to higher opening when the day session begins trading. Stochastics and the RSI are neutral to bearish signaling that sideways to lower prices are possible near-term. If June extends the decline off last-Tuesday's high, the April 27th low crossing at 1.765 is the next downside target. Closes above the 10-day moving average crossing at 1.923 would signal that a short-term low has been posted. First resistance is the 50% retracement level of the 2019-2020-low crossing at 2.154. Second resistance is the 62% retracement level of the 2019-2020-low crossing at 2.273. First support is the April 27th low crossing at 1.765. Second support is the April 16th low crossing at 1.705. Third support is April's low crossing at 1.649.
CURRENCIEShttp://quotes.ino.com/ex changes/?c=currencies"
CURRENCIES:The June Dollar was higher in late-overnight trading. The high-range overnight trade sets the stage for a steady to higher opening when the day session begins trading. Stochastics and the RSI are turning neutral to bullish signaling that sideways to higher prices are possible near-term. If June extends the rally off May's low, the April 24th high crossing at 100.98 is the next upside target. If June renews the decline off March's high, the 62% retracement level of March's rally crossing at 98.14 is the next downside target. First resistance is the April 6th high crossing at 101.03. Second resistance is March's high crossing at 103.96. First support is May's low crossing at 98.78. Second support is the 62% retracement level of March's rally crossing at 98.13.
The June Euro was lower in late-overnight trading. The low-range overnight trade sets the stage for a steady to lower opening when the day session begins trading. Stochastics and the RSI are neutral to bearish signaling that sideways to lower prices are possible near-term. If June extends last-week's decline, April's low crossing at 107.39 is the next downside target. Closes above the 50-day moving average crossing at 109.81 would confirm that a short-term low has been posted while opening the door for additional gains near-term. First resistance is the 50-day moving average crossing at 109.81. Second resistance is the March 27th high crossing at 111.88. Third resistance is the March 16th high crossing at 112.78. First support is April's low crossing at 107.39. Second support is March's low crossing at 106.71.
The June British Pound was lower overnight while extending the April-May trading range.The low-range overnight trade sets the stage for a steady to lower opening when the day session beings trading. Stochastics and the RSI are neutral to bearish signaling that sideways to lower prices are possible near-term. Closes below the reaction low crossing at 1.2252 would confirm that a double top has been posted while opening the door for a possible test of the April 7th low crossing at 1.2174. If June resumes the rally off March's low the 62% retracement level of the December-March-decline crossing at 1.2758 is the next upside target. First resistance is the April 14th high crossing at 1.2653. Second resistance is the 62% retracement level of the December-March-decline crossing at 1.2758. First support is the reaction low crossing at 1.2252. Second support is the April 7th low crossing at 1.2174.
The June Swiss Franc was lower in late-overnight trading while extending the April-May trading range. The low-range overnight trade sets the stage for a steady to lower opening when the day session begins trading. Stochastics and the RSI are turning neutral to bullish signaling that sideways to higher prices are possible near-term. If June extends the decline off April's high, March's low crossing at 1.0138 is the next downside target. Closes above the 50-day moving average crossing at 1.0398 would confirm that a short-term low has been posted. First resistance is the April 14th high crossing at 1.0443. Second resistance is the March 30th high crossing at 1.0566. First support is April's low crossing at 1.0216. Second is March's low crossing at 1.0138.
The June Canadian Dollar was lower overnight as it extends the March-May trading range. Stochastics and the RSI have turned neutral to bullish signaling that sideways to higher prices are possible near-term. If June renews the rally off March's low, the 50% retracement level of the January-March-decline crossing at 72.73 is the next upside target. Closes below the 20-day moving average crossing at 71.23 would temper the near-term friendly outlook. First resistance is 50% retracement level of the January-March-decline crossing at 72.73. Second resistance is the 62% retracement level of the January-March-decline crossing at 73.80. First support is the April 21st low crossing at 70.12. Second support is the March 31st low crossing at 69.74. Third support is March's low crossing at 68.20.
The June Japanese Yen was sharply lower overnight as it extended the decline off last-Wednesday's high. The low-range overnight trade sets the stage for a steady to lower opening when the day session begins trading. Stochastics and the RSI have turned neutral to bearish signaling that sideways to lower prices are possible near-term. Closes below the 50-day moving average crossing at 0.0932 would signal that a short-term top has been posted. If June renews the rally off March's low, the September 2019 high crossing at 0.0951 is the next upside target. First resistance is the 25% retracement level of the 2016-2020-decline crossing at 0.0943. Second resistance is the September 2019 high crossing at 0.0951. First support is the 50-day moving average crossing at 0.0932. Second support is April's low crossing at 0.0916. Third support is March's low crossing at 0.0900.
PRECIOUS METALS http://quotes.ino.com/ex changes/?c=metals"
PRECIOUS METALS:June gold was lower in late-overnight trading. The low-range overnight trade sets the stage for a steady to lower opening when the day session begins trading. Stochastics and the RSI are neutral signaling that sideways trading is possible near-term. Closes below the April 21st low crossing at $1666.20 would confirm that a short-term top has been posted while renewing the decline off April's high. If June extends the rally off May's low, the April 23rd high crossing at $1764.20 is the next upside target. First resistance is the April 23rd high crossing at $1764.20. Second resistance is the April 14th high crossing at $1788.80. First support is the April 21st low crossing at $1666.20. Second support is the 50-day moving average crossing at $1662.30.
July silver was lower overnight while extending the April-May trading range. The low-range overnight trade sets the stage for a steady to lower opening when the day session begins trading later this morning. Stochastics and the RSI are neutral to bullish signaling that sideways to higher prices are possible near-term. If July renews the rally off March's low, the 75% retracement level of the February-March-decline crossing at $17.237 is the next upside target. Closes below the April 21st low crossing at $14.715 would mark a downside breakout of the aforementioned trading range. First resistance is the 62% retracement level of the February-March-decline crossing at $16.252. Second resistance is the 75% retracement level of the February-March-decline crossing at $17.237. First support is the April 21st low crossing at $14.715. Second support is April's low crossing at $13.935.
July copper was lower in late-overnight trading as it consolidated some of the rally off March's low. The low-range overnight trade sets the stage for a steady to lower opening when the day session begins trading. Stochastics and the RSI are overbought but remain neutral to bullish signaling that sideways to higher prices are possible near-term. If July extends the rally off March's low, the 50% retracement level of the January-March-decline crossing at 2.4380 is the next upside target. Closes below last-Monday's low crossing at 2.2840 would confirm that a short-term top has been posted. First resistance is the overnight high crossing at 2.4300. Second resistance is the 50% retracement level of the January-March-decline crossing at 2.4380. First support is last-Monday's low crossing at 2.2840. Second support is the April 21st low crossing at 2.2170. Third support is March's low crossing at 1.9795.
GRAINS http://quotes.ino.com/ex changes/?c=grains
July corn was higher overnight. The low-range trade sets the stage for a steady to lower opening when the day sessions begins trading. Stochastics and the RSI are neutral to bullish signaling that sideways to higher prices are possible near-term. Closes above the 20-day moving average crossing at $3.20 1/2 would signal that a short-term low has been posted. If July resumes the decline off December's high, psychological support crossing at $3.00 is the next downside target. First resistance is the 20-day moving average crossing at $3.20 1/2. Second resistance is the 25% retracement level of the December-April-decline crossing at $3.33. First support is April's low crossing at $3.09. Second support is psychological support crossing at $3.00.
July wheat was lower overnight. The low-range trade sets the stage for a steady to lower opening when the day session begins trading. Stochastics and the RSI are turning neutral to bullish signaling that sideways to higher prices are possible near-term. Closes above the 20-day moving average crossing at $5.29 3/4 would confirm that a short-term low has been posted. If July renews the decline off March's high, the 87% retracement level of March's rally crossing at $5.04 1/4 is the next downside target. First resistance is the 20-day moving average crossing at $5.29 3/4. Second resistance is the April 20th high crossing at $5.61 1/2. First support is the 87% retracement level of March's rally crossing at $5.04 1/4. Second support is March's low crossing at $4.94 1/4.
July Kansas City Wheat closed up $0.01 1/4-cents at $4.80.
July Kansas City wheat closed higher on Friday. The high-range close sets the stage for a steady to higher opening when Monday night session begins trading. Stochastics and the RSI are neutral to bearish signaling that sideways to lower prices are possible near-term. Closes below the 50-day moving average crossing at $4.76 1/2 would confirm that a short-term top has been posted while opening the door for additional weakness near-term. Closes above the 20-day moving average crossing at $4.87 are needed to temper the near-term bearish outlook. First resistance is April's high crossing at $5.14. Second resistance is January's high crossing at $5.19. First support is the 50-day moving average crossing at $4.76 1/2. Second support is April's low crossing at $4.67 3/4.
July Minneapolis wheat gapped up and was higher in overnight trading as it extends the rally off last-Monday's low. The low-range overnight trade sets the stage for a steady to lower opening when the day session begins trading. Stochastics and the RSI are neutral to bullish signaling that sideways to higher prices are possible near-term. Closes above the 20-day moving average crossing at $5.15 3/4 are needed to temper the bearish outlook. If July renews this year's decline, psychological support crossing at $5.00 is the next downside target. First resistance is the 20-day moving average crossing at $5.15 3/4. Second resistance is the 50-day moving average crossing at $5.26 3/4. First support is last-Monday's low crossing at $5.02. Second support is psychological support crossing at $5.00.
SOYBEAN COMPLEX? http://quotes.ino.com/ex?changes/?c=grains "
July soybeans were steady to fractionally lower overnight. The low-range trade sets the stage for a steady to lower opening when the day session begins trading. Stochastics and the RSI are neutral to bullish signaling that sideways to higher prices are possible near-term. If July extends the rally off April's low, the 50-day moving average crossing at $8.61 3/4 is the next upside target. If July renews the decline off the March 25th high, psychological support crossing at $8.00 is the next downside target. First resistance is the 50-day moving average crossing at $8.61 3/4. Second resistance is the March 25th high crossing at $8.98. First support is April's low crossing at $8.18 1/2. Second support is psychological support crossing at $8.00.
July soybean meal was slightly higher overnight as it extends the trading range of the past four-weeks. The low-range trade sets the stage for a steady to lower opening when the day session begins trading. Stochastics and the RSI have turned neutral to bullish signaling that sideways to higher prices are possible near-term. Multiple closes above May's high crossing at $295.80 would confirm an upside breakout of the aforementioned trading range. If July resumes this year's decline, monthly support crossing at $283.10 is the next downside target. First resistance is May's high crossing at $295.80. Second resistance is the 50-day moving average crossing at 301.90. First support is April's low crossing at $285.60. Second support is monthly support crossing at $283.10.
July soybean oil was slightly higher overnight while extending the March-May trading range. The low-range trade sets the stage for a steady to slightly higher opening when the day session begins trading. Stochastics and the RSI are neutral to bullish signaling that sideways to higher prices are possible near-term. Closes above the 50-day moving average crossing at 26.90 would temper the near-term bearish outlook. If July renews the decline off April's high, March's low crossing at 25.02 is the next downside target. First resistance is the 25% retracement level of the January-March-decline crossing at 27.84. Second resistance is the 38% retracement level of the January-March-decline crossing at 29.32. First support is April's low crossing at 25.09. Second support is March's low crossing at 25.02.
LIVESTOCKhttp://quotes.ino.com/exchanges/?c=livestock
June hogs closed down $2.20 at $61.70.
June hogs closed lower on Friday. The low-range close sets the stage for a steady to lower opening when Monday's night session begins trading. Stochastics and the RSI are overbought but are turning neutral to bearish signaling that a short-term top might be in or is near. Closes below the 20-day moving average crossing at $53.77 would confirm that a short-term top has been posted. If June extends the rally, the 50% retracement level of the 2019-2020-decline crossing at $68.55 is the next upside target. First resistance is the 50% retracement level of the 2019-2020 decline crossing at $68.55. Second resistance is the 62% retracement level of the 2019-2020 decline crossing at $74.93. First support is the 10-day moving average crossing at $60.96. Second support is the 20-day moving average crossing at $53.77.
June cattle closed up $0.68 at $94.65.
June cattle closed higher on Friday but well off session highs even though it extends the rally off April's low. The low-range close sets the stage for a steady to lower opening on Monday. Stochastics and the RSI are overbought but remain neutral to bullish signaling that sideways to higher prices are possible near-term. If June extends the rally off April's low the 62% retracement level of the January-April-decline crossing at $103.37 is the next upside target. Closes below the 20-day moving average crossing at $86.02 would confirm that a short-term top has been posted. First resistance is the 50% retracement level of the January-April-decline crossing at $98.26. Second resistance is the 62% retracement level of the January-April-decline crossing at $103.37. First support is the 20-day moving average crossing at $86.02. Second support is the April 14th low crossing at $80.27. Third support is April's low crossing at $76.60.
August Feeder cattle closed down $1.20-cents at $136.95.
August Feeder cattle posted an inside day with a lower close on Friday as it consolidates some of the rally off April's low. The low-range close sets the stage for a steady to lower opening when Monday's session begins trading. Stochastics and the RSI are overbought but remain neutral to bullish signaling that sideways to higher prices are possible near-term. If August extends the rally off April's low, the 75% retracement level of the January-April-decline crossing at $144.91 is the next upside target. Closes below Tuesday's low crossing at $125.30 would confirm that a short-term top has been posted. First resistance is the March 25th high crossing at $139.00. Second resistance is the 75% retracement level of the January-April-decline crossing at $144.91. First support is Tuesday's low crossing at $125.30. Second support is the April 14th low crossing at $121.35. Third support is April's low crossing at $110.03.
FOOD & FIBERhttp://quotes.ino.com/ex changes/?c=food
July coffee closed higher on Friday. The high-range close sets the stage for a steady to higher opening on Monday. Stochastics and the RSI are neutral to bullish signaling that sideways to higher prices are possible near-term. Closes above the 50-day moving average crossing at 11.46 would confirm that a low has been posted. If July resumes the decline off March's high, March's low crossing at 10.31 is the next downside target.
July cocoa closed higher on Friday. The high-range close sets the stage for a steady to higher opening on Monday. Stochastics and the RSI are turning neutral to bullish signaling that sideways to higher prices are possible near-term. Closes above last-Thursday's high crossing at 24.25 would open the door for a larger-degree rally near-term. Closes below the 20-day moving average crossing at 23.43 would temper the near-term friendly outlook.
July sugar closed slightly higher on Friday. The low-range close set the stage for a steady to lower opening on Friday. Stochastics and the RSI are turning neutral to bearish signaling that sideways to lower prices are possible near-term. If July renews the decline off February's high, monthly support crossing at 8.36 is the next downside target. If July resumes last-week's rally, the 50-day moving average crossing at 11.06 is the next upside target.
July cotton closed higher on Friday. The mid-range close sets the stage for a steady to higher opening on Monday. Stochastics and the RSI are neutral to bullish signaling that sideways to higher prices are possible near-term. Closes above last-Thursday's high crossing at 57.98 would open the door for additional gains near-term. If July renews the decline off last-Thursday's high, the April 21st low crossing at 52.01 is the next downside target.
Thanks tallpine!
Buy the rumor, sell the fact for the SRW freeze on Saturday morning.
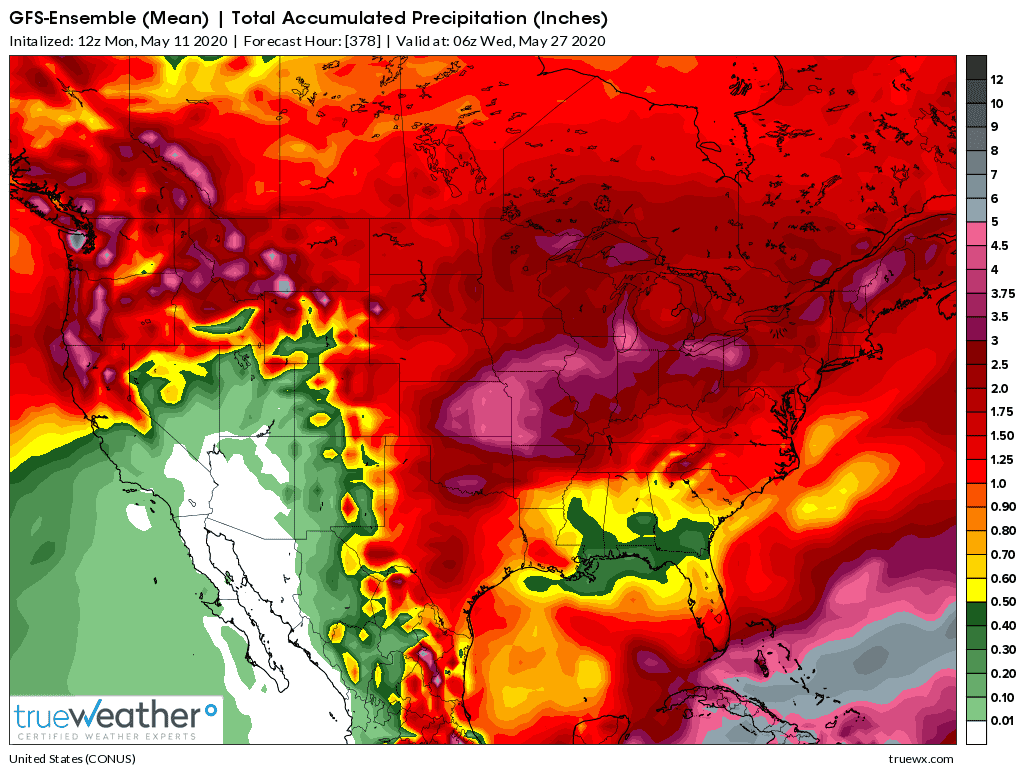
Rains a bit less than last week but the huge deal is the heat that's coming. This is bullish for ng but quite bearish for corn, which needs heat to speed things up in the cold soils.
Latest 2 week rains from the just out 12z GFS ensemble.