KEY EVENTS TO WATCH FOR:
Thursday, May 14, 2020
8:30 AM ET. Unemployment Insurance Weekly Claims Report - Initial Claims
Jobless Claims (expected 2600K; previous 3169K)
Jobless Claims, Net Chg (previous -677K)
Continuing Claims (previous 22647000)
Continuing Claims, Net Chg (previous +4636K)
8:30 AM ET. April Import & Export Price Indexes
Import Prices (expected -3.5%; previous -2.3%)
Non-Petroleum Prices (previous -0.1%)
Petroleum Prices (previous -27.4%)
8:30 AM ET. U.S. Weekly Export Sales
Corn (Metric Tons) (previous 872.1K)
Soybeans (Metric Tons) (previous 830.6K)
Wheat (Metric Tons) (previous 380.1K)
9:45 AM ET. Bloomberg Consumer Comfort Index
10:30 AM ET. EIA Weekly Natural Gas Storage Report
Working Gas In Storage (Cbf) (previous 2319B)
Working Gas In Storage, Net Chg (Cbf) (previous +109B)
4:30 PM ET. Federal Discount Window Borrowings
4:30 PM ET. Foreign Central Bank Holdings
4:30 PM ET. Money Stock Measures
Friday, May 15, 2020
8:30 AM ET. May Empire State Manufacturing Survey
Mfg Idx (expected -69.0; previous -78.2)
Employment Idx (previous -55.3)
New Orders Idx (previous -66.3)
Prices Received (previous -8.4)
8:30 AM ET. April Advance Monthly Sales for Retail & Food Services
Overall Sales-SA, M/M% (expected -13.5%; previous -8.7%)
Sales, Ex-Auto, M/M% (expected -9.2%; previous -4.5%)
Sales, Ex-Auto & Gas, M/M% (previous -3.1%)
9:15 AM ET. April Industrial Production & Capacity Utilization
Industrial Production, M/M% (expected -11.5%; previous -5.4%)
Capacity Utilization % (expected 62.5%; previous 72.7%)
Capacity Utilization, Net Chg (Pts) (expected -4.3)
10:00 AM ET. March Manufacturing & Trade: Inventories & Sales
Total Inventories (expected -0.3%; previous -0.4%)
10:00 AM ET. March Job Openings & Labor Turnover Survey
10:00 AM ET. May University of Michigan Survey of Consumers – preliminary
Mid-Mo Sentiment (expected 66.5; previous 71.0)
Mid-Mo Expectations (previous 70.0)
Mid-Mo Current Idx (previous 72.4)
4:00 PM ET March Treasury International Capital Data
N/A ISM Semiannual Report On Business & Economic Forecast
Monday, May 18, 2020
10:00 AM ET. May NAHB Housing Market Index
Housing Mkt Idx (previous 30)
The STOCK INDEXES? http://quotes.ino.com/ex?changes/?c=indexes
The Dow closed sharply lower on Wednesday as Wall Street digested a grim near-term economic outlook from Federal Reserve Chairman Jerome Powell and as state and federal officials attempt to restart businesses from the lock down over coronavirus. The low-range close that sets the stage for a steady to lower opening when Thursday's night session begins trading. Stochastics and the RSI have turned neutral to bearish signaling that sideways to lower prices are possible near-term. Today's close below last-Monday's low crossing at 23,361.16 confirms that a short-term top has been posted. If the Dow renews the rally off March's low, the 62% retracement level of the February-March-decline crossing at 25,199.76 is the next upside target. First resistance is April's high crossing at 24,764.77. Second resistance is the 62% retracement level of the February-March-decline crossing at 25,199.76. First support is the 50-day moving average crossing at 22,979.63. Second support is April's low crossing at 20,735.02.
The June NASDAQ 100 closed lower on Wednesday as it consolidates some of the rally off March low. The mid-range close sets the stage for a steady to lower opening when Thursday's night session begins trading. Stochastics and the RSI are turning neutral to bearish signaling that a short-term top might be in or is near. Closes below last-Monday's low crossing at 8556.25 would confirm that a short-term top has been posted. If June extends the rally off March's low, the 87% retracement level of the February-March-decline crossing at 9384.61 is the next upside target. First resistance is Tuesday's high crossing at 9345.50. Second resistance is the 87% retracement level of the January-March-decline crossing at 9384.61. First support is last-Monday's low crossing at 8556.25. Second support is the April 21st low crossing at 8342.00.
The June S&P 500 closed lower on Wednesday as it extends this week's decline. The low-range close sets the stage for a steady to lower opening when Thursday's night session begins trading. Stochastics and the RSI are neutral to bearish signaling that sideways to lower prices are possible near-term. If March renews the rally off March's low, the 75% retracement level of the February-March-decline crossing at 3085.85 is the next upside target. Closes below last-Monday's low crossing at 2775.40 are needed to confirm that a short-term top has been posted. First resistance is April's high crossing at 2957.70. Second resistance is the 75% retracement level of the February-March-decline crossing at 3085.85. First support is last-Monday's low crossing at 2775.40. Second support is the 50-day moving average crossing at 2709.62.
INTEREST RATES? http://quotes.ino.com/ex?changes/?c=interest ""
June T-bonds closed up 26/32's at 180-20.
June T-bonds closed higher on Wednesday while extending the April-May trading range.The high-range close sets the stage for a steady to higher opening when Thursday's night session begins trading. Stochastics and the RSI are turning neutral to bullish signaling that sideways to higher prices are possible near-term. Closes above the April 22nd high crossing at 183-02 are needed to confirm an upside breakout of the aforementioned trading range. Closes below the April 14th low crossing at 177-14 would confirm a downside breakout of the aforementioned trading range. First resistance is the April 22nd high crossing at 183-02. Second resistance is the March 12th high crossing at 184-07. First support is last-Wednesday's low crossing at 178-01. Second support is the April 14th low crossing at 177-14.
June T-notes closed up 85-points at 139.070.
June T-notes closed higher on Wednesday while extending the April-May trading range. The high-range close sets the stage for a steady to higher opening when Thursday's night session begins trading. Stochastics and the RSI are neutral to bullish signaling that sideways to higher prices are possible near-term. If June renews the rally off March's low, March's high crossing at 140.240 is the next upside target. Closes below the 50-day moving average crossing at 138.050 are needed to confirm that a short-term top has been posted. First resistance is the April 21st high crossing at 139.220. Second resistance is March's high crossing at 140.240. First support is the 50-day moving average crossing at 138.050. Second support is the April 7th low crossing at 137.160.
ENERGY MARKETS? http://quotes.ino.com/ex?changes/?c=energy ""
June crude oil closed slightly lower on Wednesday while extending the trading range of the past six-days.The low-range close sets the stage for a steady to lower opening when Thursday's night session begins. Stochastics and the RSI are overbought but remain neutral to bullish signaling that sideways to higher prices are possible near-term. Closes above the 50-day moving average crossing at $26.19 would open the door for a possible test of April's high crossing at $33.15. First resistance is the 50-day moving average crossing at $26.19. Second resistance is April's high crossing at $33.15. First support is the 20-day moving average crossing at $20.39. Second support is the April 28th low crossing at $10.07. Third support is April's low crossing at $6.50.
June heating oil closed lower on Wednesday. The low-range close sets the stage for a steady to lower opening when Thursday's night trading session begins. Stochastics and the RSI are turning neutral to bearish signaling that sideways to lower prices is possible near-term. If June renews this year's decline, the October 2001 low on the monthly continuation chart crossing at $49.30 is the next downside target. If June extends the rally off April's low, the 50-day moving average crossing at $100.51 is the next upside target. First resistance is last-Wednesday's high crossing at $91.99. Second resistance is the 50-day moving average crossing at $100.51. First support is April's low crossing at $67.24. Second support is the October 2001 low on the monthly continuation chart crossing at $49.30.
June unleaded gas closed lower on Wednesday as it consolidated some the rally off April's low. The low-range close sets the stage for a steady to lower opening when Thursday's night session begins trading. Stochastics and the RSI are turning neutral to bearish signaling that sideways to lower prices are possible near-term. If June resumes the rally off April's low, the 38% retracement level of the January-March-decline crossing at 107.64. Closes below the 20-day moving average crossing at 79.41 would signal that a short-term top has been posted. First resistance is Monday's high crossing at 98.20. Second resistance is the 38% retracement level of the January-March-decline decline crossing at 107.64. First support is the 20-day moving average crossing at 79.41. Second support is April's low crossing at 52.51.
June Henry natural gas closed lower on Wednesday as it extends the decline off last-Tuesday's high. The low-range close sets the stage for a steady to lower opening when Thursday's night session begins trading. Stochastics and the RSI are oversold but remain neutral to bearish signaling that sideways to lower prices are possible near-term. If June extends the decline off last-Tuesday's high, weekly support on the weekly continuation chart crossing at 1.519 is the next downside target. Closes above the 20-day moving average crossing at 1.908 is the next upside target. First resistance is the 50-day moving average crossing at 2.872. Second resistance is the 20-day moving average crossing at 1.908. First support is today's low crossing at 1.595. Second support is weekly support on the weekly continuation chart crossing at 1.519.
CURRENCIES? http://quotes.ino.com/ex?changes/?c=currencies ""
The June Dollar closed higher on Wednesday as it extended the April-May trading range.The high-range close sets the stage for a steady to higher opening when Thursday's night session begins trading. Stochastics and the RSI are neutral to bullish signaling that sideways to higher prices are possible near-term. If June extends the rally off May's low, the April 24th high crossing at 100.98 is the next upside target. If June renews the decline off the April 24th high, the 62% retracement level of March's rally crossing at 98.14 is the next downside target. First resistance is the April 6th high crossing at 101.03. Second resistance is March's high crossing at 103.96. First support is last-Friday's low crossing at 98.77. Second support is the March 27thlow crossing at 98.34. Third support is the 62% retracement level of March's rally crossing at 98.14.
The June Euro closed lower on Wednesday. The low-range close sets the stage for a steady to lower opening when Thursday's night session begins trading. Stochastics and the RSI are neutral to bearish signaling that sideways to lower prices are possible near-term. If June resumes the decline off the March 27th high, April's low crossing at 107.39 is the next downside target. Closes above the 50-day moving average crossing at 109.66 are needed to confirm that a short-term low has been posted. First resistance is May's high crossing at 110.29. Second resistance is the March 27th high crossing at 111.88. First support is April's low crossing at 107.39. Second support is March's low crossing at 106.71.
The June British Pound closed lower on Wednesday. The low-range close sets the stage for a steady to lower opening when Thursday's night session begins trading. Stochastics and the RSI are oversold but remain neutral to bearish signaling that sideways to lower prices are possible near-term. If June renews the decline off the April-30th high crossing at 1.2647, the April 7th low crossing at 1.2174 is the next downside target. Closes above the 20-day moving average crossing at 1.2400 would confirm that a short-term low has been posted. First resistance is the April 30th high crossing at 1.2647. Second resistance is the 62% retracement level of the December-March-decline crossing at 1.2758. Third resistance is the 75% retracement level of the December-March-decline crossing at 1.3042. First support is today's low crossing at 1.2211. Second support is the April 7th low crossing at 1.2174.
The June Swiss Franc closed lower on Wednesday. The low-range close sets the stage for a steady to lower opening when Thursday's night session begins trading. Stochastics and the RSI are neutral to bullish signaling that sideways to higher prices are possible near-term. Closes above the 50-day moving average crossing at 1.0390 would confirm that a short-term low has been posted. If June extends the decline, April's low crossing at 1.0216 is the next downside target. First resistance April's high crossing at 1.0443. Second resistance is the March 30th high crossing at 1.0566. First support is April's low crossing at 1.0216. Second support is March's low crossing at 1.0138.
The June Canadian Dollar closed lower on Wednesday as it extended the April-May trading range.The low-range close sets the stage for a steady to lower opening when Thursday's night session begins trading. Stochastics and the RSI are neutral to bearish signaling that sideways to lower prices are possible near-term. If June renews the decline off the April 30th high, the April 21st low crossing at 70.12 is the next downside target. If June renews the rally off March's low, the 50% retracement level of the January-March-decline crossing at 72.73 is the next upside target.First resistance is the April 30th high crossing at 72.21. Second resistance is the 50% retracement level of the January-March-decline crossing at 72.73. First support is the April 21st low crossing at 70.12. Second support is the March 31st low crossing at 69.73. Third support is March's low crossing at 68.20.
The June Japanese Yen closed higher on Wednesday as it consolidated some of Monday's decline. The high-range close sets the stage for a steady to higher opening when Thursday’s night session begins trading. Stochastics and the RSI are neutral to bearish signaling that sideways to lower prices are possible near-term. If June extends Monday's decline, April's low crossing at 0.0916 is the next downside target. If June renews the rally off March's low, the September 2019 high crossing at 0.0951 is the next upside target. First resistance is long-term resistance crossing at 0.0942. Second resistance is the September 2019 high crossing at 0.0951. First support is the April 23rd low crossing at 0.0926. Second support is April's low crossing at 0.0916. Third support is March's low crossing at 0.0900.
PRECIOUS METALS? http://quotes.ino.com/ex?changes/?c=metals ""
June gold closed higher on Wednesday.The high-range close sets the stage for a steady to higher opening when Thursday's night session begins trading. Stochastics and the RSI are turning neutral to bullish signaling that sideways to higher prices are possible near-term. If April resumes last-Thursday's rally, April's high crossing at $1788.80 is the next upside target. Closes below the April 21st low crossing at $1666.20 would confirm that a short-term top has been posted while opening the door for additional weakness near-term. First resistance is the April 23rd high crossing at $1764.00. Second resistance is April's high crossing at $1788.80. Third resistance is the October-2012 high on the monthly continuation chart crossing at $1798.10. First support is the April 21st low crossing at $1666.20. Second support is the 50-day moving average crossing at $1665.90.
July silver closed slightly higher on Wednesday while extending the April-May trading range. The mid-range close sets the stage for a steady opening when Thursday's night session begins trading. Stochastics and the RSI are neutral to bullish signaling that sideways to higher prices are possible near-term. If July resumes the rally off March's low, the 75% retracement level of the February-March-decline crossing at 17.237 is the next upside target. Closes below the April 21st low crossing at 14.715 would confirm a downside breakout of the aforementioned trading range while opening the door for additional weakness near-term. First resistance is the 62% retracement level of the February-March-decline crossing at 16.252. Second resistance is the 75% retracement level of the February-March-decline decline crossing at 17.237 is the next upside target. First support is the April 21st low crossing at 14.715. Second support is the April 1st low crossing at 13.935.
July copper closed slightly higher on Wednesday as it consolidated some of the decline off Monday's high. The low-range close sets the stage for a steady to lower opening when Thursday's night session begins trading. Stochastics and the RSI are neutral to bearish signaling that sideways to lower prices are possible near-term. Closes below last Monday's low crossing at 228.40 are needed to confirm that a short-term top has been posted. If July extends the rally off March's low, the 50% retracement level of the January-March-decline crossing at 243.80 is the next upside target. First resistance is the 50% retracement level of the January-March-decline crossing at 243.80. Second resistance is the 62% retracement level of the January-March-decline crossing at 254.68. First support is last-Monday's low crossing at 228.40. Second support is the April 21st low crossing at 221.70. Third support is March's low crossing at 197.95.
GRAINS? http://quotes.ino.com/ex?changes/?c=grains "
July Corn closed down $0.04 1/2-cents at 3.17 3/4.
July corn closed lower on Wednesday. The low-range close sets the stage for a steady to lower opening when Thursday's night sessions begins trading. Stochastics and the RSI are neutral to bullish signaling that sideways to higher prices are possible near-term. If July extends the rally off April's low the April 23rd high crossing at $3.31 is the next upside target. If July renews this year's decline, psychological support crossing at $3.00 is the next downside target. First resistance is the April 23rd high crossing at 3.31. Second resistance is the 50-day moving average crossing at $3.39 1/4. First support is April's low crossing at $3.09. Second support is psychological support crossing at $3.00.
July wheat closed down $0.13-cents at $5.01 1/2.
July wheat closed lower on Wednesday as it extended this week's decline. The low-range close sets the stage for a steady to lower opening when Thursday's night session begins trading. Stochastics and the RSI are neutral to bearish signaling that sideways to lower prices are possible near-term. If July extends the decline off March's high, March's low crossing at $4.94 1/4 is the next downside target. Closes above the 20-day moving average crossing at $5.25 3/4 would signal that a short-term low has been posted. First resistance is the 20-day moving average crossing at $5.25 3/4. Second resistance is the 50-day high crossing at $5.32 1/4. First support is today's low crossing at $5.00 1/4. Second support is March's low crossing at $4.94 1/4.
July Kansas City Wheat closed down $0.15-cents at $4.54 1/4.
July Kansas City wheat closed lower on Wednesday as it extended the decline off April's high. The low-range close sets the stage for a steady to lower opening when Thursday night session begins trading. Stochastics and the RSI are oversold but remain neutral to bearish signaling that sideways to lower prices are possible near-term. Today's close below April's low crossing at $4.67 3/4 marks a downside breakout of the March-May trading range. Closes above the 20-day moving average crossing at $4.83 are needed to temper the near-term bearish outlook. First resistance is the 20-day moving average crossing at $4.83. Second resistance is April's high crossing at $5.14. First support is today's low crossing at $4.55. Second support is March's low crossing at $4.27 1/4.
July Minneapolis wheat closed down $0.12 3/4-cents at $5.08 1/4.
July Minneapolis wheat closed lower on Wednesday. The low-range close sets the stage for a steady to lower opening when Thursday's night session begins trading. Stochastics and the RSI are turning neutral to bearish signaling that sideways to lower prices are possible near-term. If July renews this year's decline, psychological support crossing at $5.00 is the next downside target. Closes above the 50-day moving average crossing at $5.25 3/4 would open the door for a possible test of April's high crossing at $5.48 1/4. First resistance is the 50-day moving average crossing at $5.25 3/4. Second resistance is April's high crossing at 5.48 1/4. First support is last-Monday's low crossing at $5.02. Second support is psychological support crossing at $5.00.
SOYBEAN COMPLEX? http://quotes.ino.com/ex?changes/?c=grains "
July soybeans closed down $0.13 1/4-cents at $8.38 3/4.
July soybeans closed lower on Wednesday. The low-range close sets the stage for a steady to lower opening when Thursday's night session begins trading. Stochastics and the RSI are turning neutral to bearish signaling that sideways to lower prices are possible near-term. If July resumes this year's decline, psychological support crossing at $8.00 is the next downside target. Closes above the 50-day moving average crossing at $8.59 are needed to confirm that a short-term low has been posted. First resistance is the 50-day moving average crossing at $8.59. Second resistance is the April 13th high crossing at $8.77 1/2. First support is April's low crossing at $8.18 1/2. Second support is psychological support crossing at $8.00.
July soybean meal closed down $1.50 at $290.60.
July soybean meal closed lower on Wednesday. The low-range close sets the stage for a steady to lower opening when Thursday's night session begins trading. Stochastics and the RSI are neutral to bullish signaling that sideways to higher prices are possible near-term. Closes above the reaction high crossing at $295.80 are needed to confirm that a short-term low has been posted. If July resumes the decline off March's high, monthly support crossing at $283.10 is the next downside target. First resistance is the reaction high crossing at $295.80. Second is the 50-day moving average crossing at $300.70. First support is April's low crossing at $285.60. Second support is monthly support crossing at $283.10.
July soybean oil closed down 36-pts. At 25.90.
July soybean oil closed lower on Wednesday. The low-range close sets the stage for a steady to lower opening when Thursday's night session begins trading. Stochastics and the RSI are turning neutral to bearish signaling that sideways to lower prices are possible near-term. If July renews the decline off April's high, March's low crossing at 25.02 is the next downside target. Closes above the 50-day moving average crossing at 26.77 would temper the near-term bearish outlook. First resistance is the 50-day moving average crossing at 26.77. Second resistance is the 25% retracement level of the December-March-decline crossing at 27.84. First support is April's low crossing at 25.09. Second support is March's low crossing at 25.02.
LIVESTOCKhttp://quotes.ino.com/exchanges/?c=livestock
June hogs closed down $3.45 at $57.88.
June hogs closed sharply lower on Wednesday. The low-range close sets the stage for a steady to lower opening when Thursday's night session begins trading. Stochastics and the RSI are neutral to bearish signaling that sideways to lower prices are possible near-term. Closes below the 20-day moving average crossing at $56.07 would confirm that a short-term top has been posted. If June renews the rally, the 50% retracement level of the 2019-2020-decline crossing at $68.55 is the next upside target. First resistance is the 50% retracement level of the 2019-2020 decline crossing at $68.55. Second resistance is the 62% retracement level of the 2019-2020 decline crossing at $74.93. First support is the 20-day moving average crossing at $56.07. Second support is the April 29th low crossing at $54.78.
June cattle closed down $3.30 at $93.87.
June cattle closed lower on Wednesday. The low-range close sets the stage for a steady to lower opening on Thursday. Stochastics and the RSI are turning neutral to bearish signaling that sideways to lower prices are possible near-term. Closes below the 20-day moving average crossing at $87.70 would confirm that a short-term top has been posted. If June extends the rally off April's low the 62% retracement level of the January-April-decline crossing at $103.37 is the next upside target. First resistance is the 50% retracement level of the January-April-decline crossing at $98.26. Second resistance is the 62% retracement level of the January-April-decline crossing at $103.37. First support is the 20-day moving average crossing at $87.70. Second support is the April 14th low crossing at $80.27. Third support is April's low crossing at $76.60.
August Feeder cattle closed down $2.68-cents at $133.08.
August Feeder cattle closed lower on Wednesday. The low-range close sets the stage for a steady to lower opening when Thursday's session begins trading. Stochastics and the RSI are turning neutral to bearish signaling that a short-term top might be in or is near. Closes below last-Tuesday's low crossing at $125.30 would confirm that a short-term top has been posted. If August extends the rally off April's low, the 75% retracement level of the January-April-decline crossing at $144.91 is the next upside target. First resistance is the March 25th high crossing at $139.00. Second resistance is the 75% retracement level of the January-April-decline crossing at $144.91. First support is last-Tuesday's low crossing at $125.30. Second support is the April 14th low crossing at $121.35. Third support is April's low crossing at $110.03.
FOOD & FIBERhttp://quotes.ino.com/ex changes/?c=food
July coffee closed lower on Wednesday. The low-range close sets the stage for a steady to lower opening on Thursday. Stochastics and the RSI are neutral to bearish signaling that sideways to lower prices are possible near-term. If July resumes the decline off March's high, March's low crossing at 10.31 is the next downside target. Closes above the 50-day moving average crossing at 11.40 would confirm that a low has been posted.
July cocoa closed slightly higher on Wednesday. The high-range close sets the stage for a steady to higher opening on Thursday. Stochastics and the RSI are neutral signaling that sideways to higher prices are possible near-term. If July extends the aforementioned rally, the 50% retracement level of the February-March decline crossing at 25.68 is the next upside target. Closes below the 20-day moving average crossing at 23.70 would confirm that a short-term top has been posted.
July sugar closed higher on Wednesday. The high-range close set the stage for a steady to higher opening on Thursday. Stochastics and the RSI are neutral to bearish signaling that sideways to lower prices are possible near-term. If July resumes the rally off April's low, the 50-day moving average crossing at 10.77 is the next upside target. If July renews the decline off February's high, monthly support crossing at 8.36 is the next downside target.
July cotton closed lower on Wednesday as it consolidates some of the rally off April's low. The low-range close sets the stage for a steady to lower opening on Thursday. Stochastics and the RSI are neutral to bullish signaling that sideways to higher prices are possible near-term. If July extends Tuesday's rally, the 50% retracement level of the January-April-decline crossing at 61.06. Closes below last-Wednesday's low crossing at 53.20 would confirm that a short-term top has been posted.
Thanks tallpine!
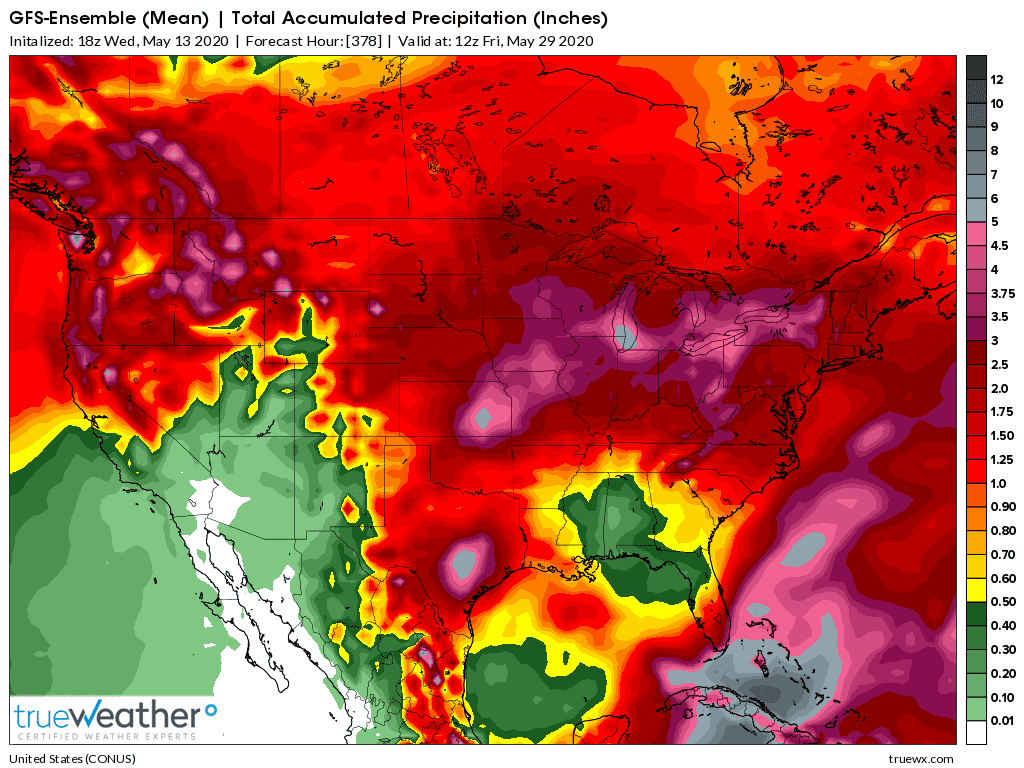
Very warm weather on the way and in places that looked very wet last week, the upper level heat ridge building in will cause it to be very warm/dry in some of those locations, with the threat of heavier rains possibly shifting farther northwest and being much less.
Latest 2 week rains from the 18z GFS.
Maybe some hefty amounts around the periphery of a heat ridge in the South?