 The Ag Strategy@TheAgStrategy·
CHICAGO — Chicago wheat futures gained on Wednesday as dryness in Russia and a weak crop outlook across the Great Plains lifted the market.
The most-active wheat contract on the Chicago Board of Trade climbed 15 cents to $5.13-3/4 a bushel, after touching a two-month low on Monday.
Wheat prices had slumped as European rain gave hope to drought-stricken crops, but persistent dryness in the Black Sea region offered support. A decline in U.S. winter wheat crop ratings last week and below-expected crop outlook during a Kansas wheat tour this week also buoyed the market.
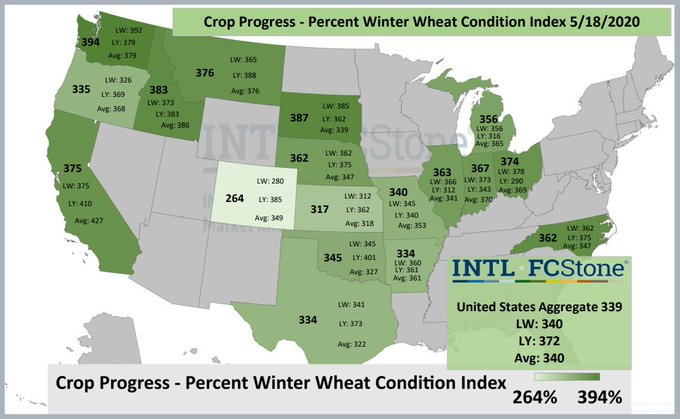
“This spring’s drought did irreversible damage,” said Arlan Suderman, chief commodities economist for INTL FCStone, noting that Russian crop conditions move the U.S. market more than its own crop outlook.
https://en.wikipedia.org/wiki/Black_Sea
| Black Sea | |
|---|---|
 The location of the Black Sea The location of the Black Sea |
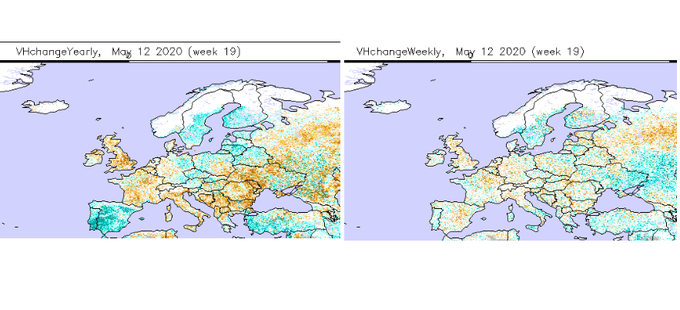
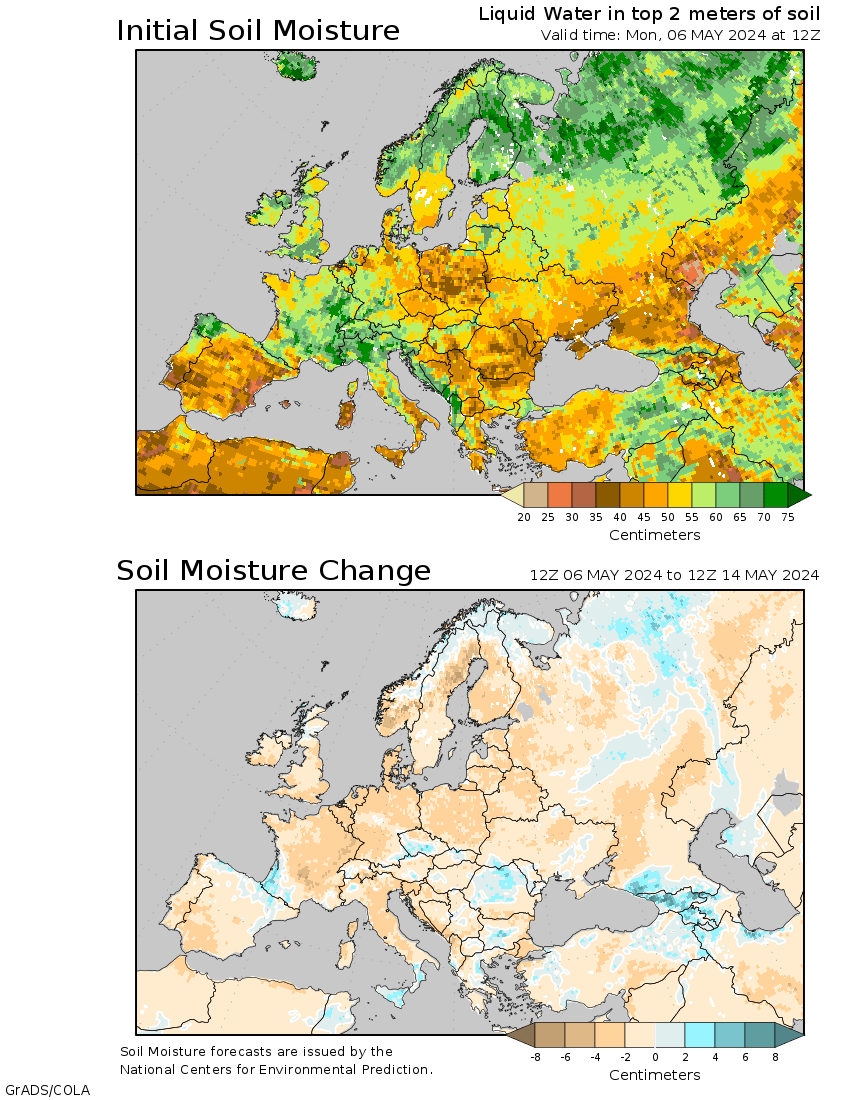
The Ag Strategy@TheAgStrategy·VHI maps are showing very bad crop conditions in EU. Conditions worsened further last week especially part of France, Germany, Poland and UK.
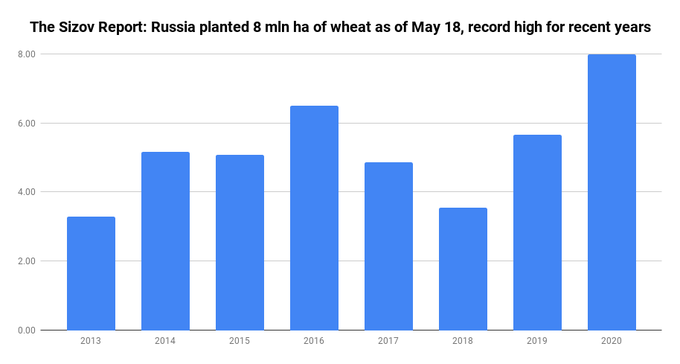
 Russian farmers planting #wheat at record pace, +41% YOY (!), on favorable weather. The biggest increase is in Siberia and Urals. Sub 12 mln ha of spring wheat (WASDE) looks low.
ammeundmueller@ammeundmueller·
#Russia #wheat #exports fact sheet. According to initial estimates, the shipments will decrease in May, also through Covid-19; nonetheless, Russia is heading for the 3rd best export year and has a big harvest 20/21 ahead.
·
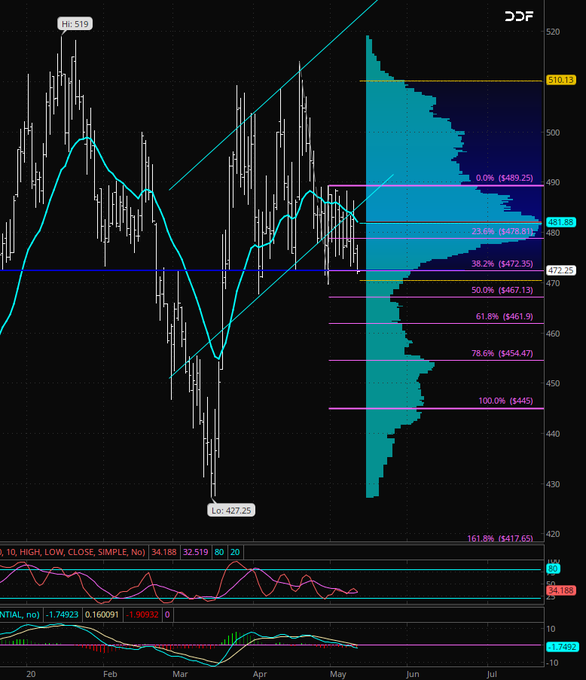
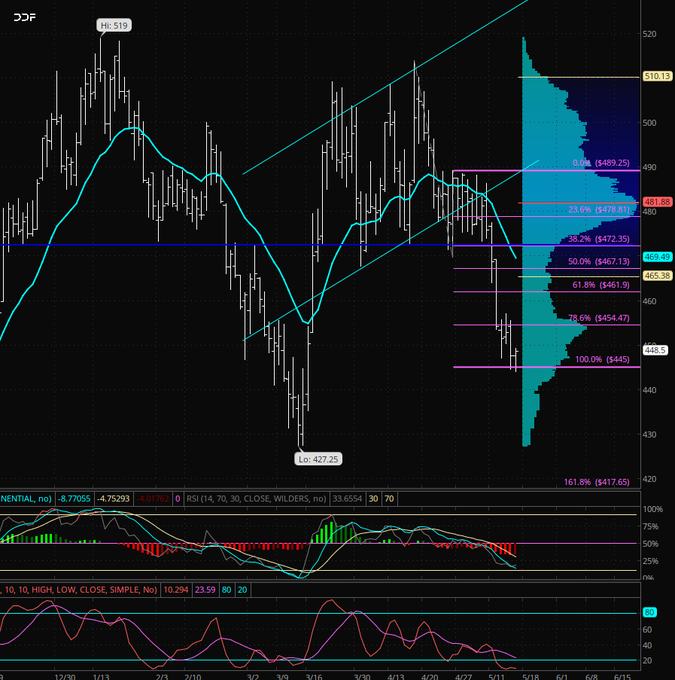
Big day for KC Jul as we enter a 5 & 15yr bullish seasonal pattern & #wheat production number out later this AM. 20EMA continues to act as solid resistance on the close. 469'6-472'4 area needs to hold as support or extension lower will remain for bears. USDA out at 11A CST.
Update on July KC #wheat as mentioned last wk extentions lower favored the bears but yesterday's lows & today (so far) could be telling for the bulls here. Close will be key but 445 is interesting IMO. Failure to hold bears will remain in control.
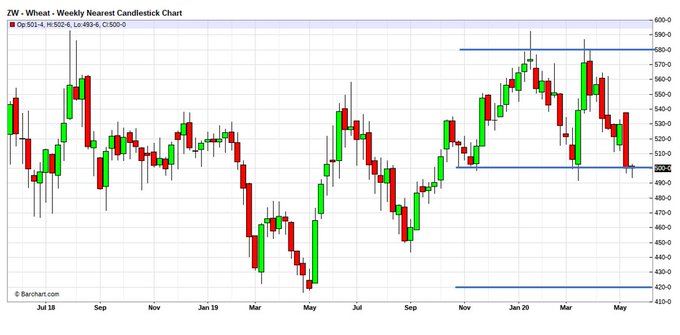
Chi #wheat reached multi-months low on good outlook for 2020 world crop. Where to now? Back to 5.8 or 4.2?
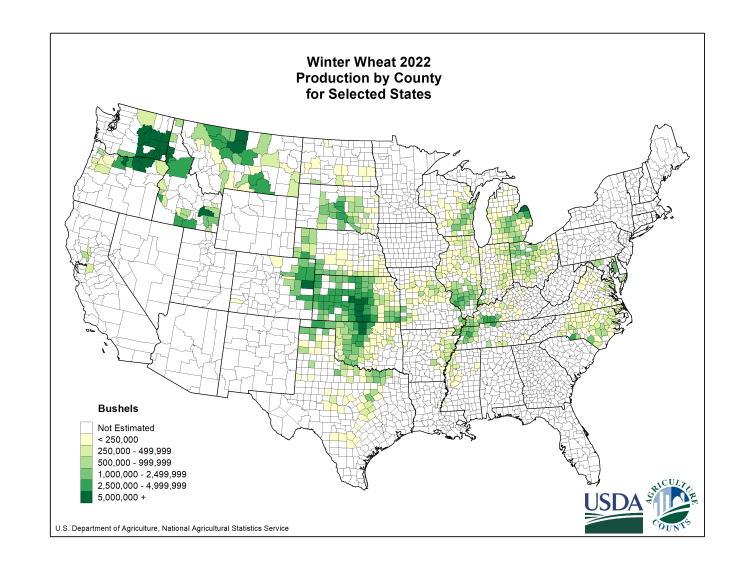
The poorest winter #wheat is in Kansas and Colorado, thanks to drought & freeze damage.
Field measurements used in estimate; USDA says 306 million bushels
The annual Kansas Wheat Tour did not come to fruition in its usual form in 2020, but that didn’t stop the trade group Kansas Wheat from undertaking its own virtual tour of the state’s Hard Wheat Crop this week.
Input from farmers, extension agents, specialists and crop advisors was great enough that Kansas Wheat estimates the Kansas wheat crop will total 284.4 million bushels, well short of last year’s 338 million bushel total. The average yield is estimated at 44.5 bushels per acre, from 6.4 million acres. Last year’s harvested acreage in Kansas was 6.5 million acres, with an average yield of 47.0 bushels per acre.
Today’s portion of the wheat tour covered central and eastern Kansas.
Dave Green, chief executive officer of the Wheat Quality Council – which normally hosts the Wheat Tour – visited fields in five counties in central Kansas. Yield counts taken in fields within those counties averaged 53 bushels per acre. Fields were clean and free of disease and freeze damage, Green says.
Romulo Lollato, Extension agronomist at Kansas State University, toured fields in central and south central Kansas, which arguably has the best wheat yield prospects in Kansas. He made 14 field stops in central Kansas, with yields ranging from 21 to 83 bushels per acre and a 52 bushel per acre average. There was some freeze damage, some drought damage and some stripe rust.
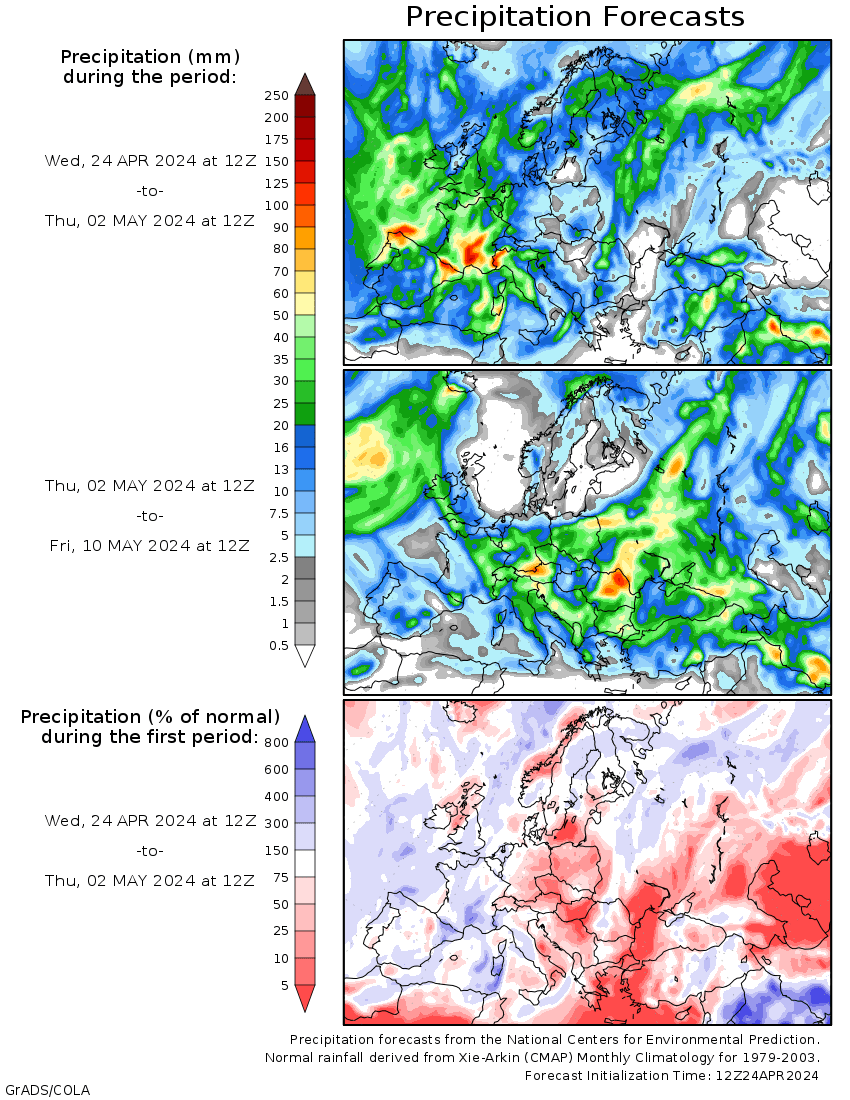
Liquid equivalent precip forecasts for the next 7 days are below.
Big rains in the Plains/SW Midwest, where some places will welcome it.
Day 1 below:
http://www.wpc.ncep.noaa.gov/qpf/fill_94qwbg.gif?1526306199054

Day 2 below:
http://www.wpc.ncep.noaa.gov/qpf/fill_98qwbg.gif?1528293750112

Day 3 below
http://www.wpc.ncep.noaa.gov/qpf/fill_99qwbg.gif?1528293842764

Days 4-5 below:
http://www.wpc.ncep.noaa.gov/qpf/95ep48iwbg_fill.gif?1526306162

Days 6-7 below:
http://www.wpc.ncep.noaa.gov/qpf/97ep48iwbg_fill.gif?1526306162

7 Day Total precipitation below:
https://www.wpc.ncep.noaa.gov/qpf/p168i.gif?1566925971


