KEY EVENTS TO WATCH FOR:
N/A U.S.: Memorial Day. Financial markets closed
N/A U.S: Jefferson Davis' Birthday holiday in Mississippi
Tuesday, May 26, 2020
8:30 AM ET. April CFNAI Chicago Fed National Activity Index
NAI (previous -4.19)
NAI, 3-mo Moving Avg (previous -4.19 -1.47)
9:00 AM ET. 1st Quarter U.S. Quarterly House Price Index
9:00 AM ET. March U.S. Monthly House Price Index
9:00 AM ET. March S&P CoreLogic Case-Shiller Indices
10-City Idx, M/M% (previous +0.4%)
10-City Idx, Y/Y% (previous +2.9%)
20-City Idx, M/M% (previous +0.5%)
20-City Idx, Y/Y% (previous +3.5%)
National Idx, M/M% (previous +0.4%)
National Idx, Y/Y% (previous +4.2%)
10:00 AM ET. May Consumer Confidence Index
Cons Conf Idx (previous 86.9)
Expectation Idx (previous 93.8)
Present Situation Idx (previous 76.4)
10:00 AM ET. April New Residential Sales
New Home Sales (previous 627K)
New Home Sales, M/M% (previous -15.4%)
New Home Sales Months Supply (previous 6.4)
10:30 AM ET. May Texas Manufacturing Outlook Survey
Business Activity (previous -73.7)
Mfg Production Idx (previous -55.3)
Wednesday, May 27, 2020
7:00 AM ET. MBA Weekly Mortgage Applications Survey
Composite Idx (previous 727.1)
Composite Idx, W/W% (previous -2.6%)
Purchase Idx-SA (previous 258.9)
Purchase Idx-SA, W/W% (previous +6.4%)
Refinance Idx (previous 3474.1)
Refinance Idx, W/W% (previous -6.3%)
7:45 AM ET. The Retail Economist/Goldman Sachs Weekly Chain Store Sales Index
Chain Store Sales, W/W% (previous +1.3%)
Chain Store Sales, M/M% (previous -16.6%)
8:55 AM ET. Johnson Redbook Retail Sales Index
Ret Sales Mo-to-Date, M/M% (previous -2.6%)
Ret Sales Mo-to-Date, Y/Y% (previous -8.5%)
Latest Wk, Y/Y% (previous -9.5%)
10:00 AM ET. May Richmond Fed Business Activity Survey
Mfg Idx (previous -53)
Shipments Idx (previous -70)
12:30 AM ET. FRB St. Louis President James Bullard speaks at C.D. Howe Institute WebEx
2:00 PM ET. U.S. Federal Reserve Beige Book
4:30 PM ET. API Weekly Statistical Bulletin
Crude Stocks, Net Chg (Bbls) (previous -4.8M)
Gasoline Stocks, Net Chg (Bbls) (previous -0.7M)
Distillate Stocks, Net Chg (Bbls) (previous +5.1M)
Thursday, May 28, 2020
8:30 AM ET. April Advance Report on Durable Goods
Durable Goods-SA, M/M% (previous -14.4%)
Dur Goods, Ex-Defense, M/M% (previous -15.8%)
Dur Goods, Ex-Transport, M/M% (previous -0.2%)
Orders: Cap Gds, Non-Def, Ex-Air, M/M% M/M% (previous +0.1%)
Shipmnts: Cap Gds, Non-Def, Ex-Air, M/M% (previous -0.2%)
8:30 AM ET. Unemployment Insurance Weekly Claims Report - Initial Claims
Jobless Claims (previous 2438K)
Jobless Claims, Net Chg (previous -249K)
Continuing Claims (previous 25073000)
Continuing Claims, Net Chg (previous +2525K)
8:30 AM ET. 1st Quarter Preliminary Corporate Profits
8:30 AM ET. 1st Quarter 2nd estimate GDP
Annual Rate, Q/Q% (previous -4.8%)
Chain-Weighted Price Idx, Q/Q% (previous -4.3%)
Corporate Profits, Q/Q% (previous +3.7%)
PCE Price Idx, Q/Q% (previous +1.3%)
Purchase Price Idx, Q/Q% (previous +1.6%)
Real Final Sales, Q/Q% (previous -4.3%)
Core PCE Price Idx, Q/Q% (previous +1.8%)
Consumer Spending, Q/Q% (previous -7.6%)
9:45 AM ET. Bloomberg Consumer Comfort Index
10:00 AM ET. April Pending Home Sales Index
Pending Home Sales (previous 88.2)
Pending Home Sales Idx, M/M% (previous -20.8%)
Pending Home Sales Idx , Y/Y% (previous -16.3%)
10:30 AM ET. EIA Weekly Natural Gas Storage Report
Working Gas In Storage (Cbf) (previous 2503B)
Working Gas In Storage, Net Chg (Cbf) (previous +81B)
11:00 AM ET. EIA Weekly Petroleum Status Report
Crude Oil Stocks (Bbl) (previous 526.494M)
Crude Oil Stocks, Net Chg (Bbl) (previous -4.982M)
Gasoline Stocks (Bbl) (previous 255.724M)
Gasoline Stocks, Net Chg (Bbl) (previous +2.83M)
Distillate Stocks (Bbl) (previous 158.832M)
Distillate Stocks, Net Chg (Bbl) (previous +3.831M)
Refinery Usage (previous 69.4%)
Total Prod Supplied (Bbl/day) (previous 16.586M)
Total Prod Supplied, Net Chg (Bbl/day) (previous -0.228M)
11:00 AM ET. May Federal Reserve Bank of Kansas City Survey of Tenth District
Manufacturing
Mfg Activity Idx (previous -62)
6-Mo Exp Prod Idx (previous -8)
Mfg Composite Idx (previous -30)
6-Mo Exp Composite Idx (previous -6)
4:30 PM ET. Federal Discount Window Borrowings
4:30 PM ET. Foreign Central Bank Holdings
4:30 PM ET. Money Stock Measures
Friday, May 29, 2020
8:30 AM ET. April Personal Income & Outlays
Personal Income, M/M% (previous -2%)
Consumer Spending, M/M% (previous -7.5%)
PCE Price Idx, M/M% (previous -0.3%)
PCE Price Idx, Y/Y% (previous +1.3%)
PCE Core Price Idx, M/M% (previous -0.1%)
PCE Core Price Idx, Y/Y% (previous +1.7%)
8:30 AM ET. April Advance Economic Indicators Report
8:30 AM ET. U.S. Weekly Export Sales
Corn (Metric Tons) (previous 854.9K)
Soybeans (Metric Tons) (previous 1669K)
Wheat (Metric Tons) (previous 428.2K)
9:45 AM ET. May ISM-Chicago Business Survey - Chicago PMI
PMI-Adj (previous 35.4)
10:00 AM ET. May University of Michigan Survey of Consumers – final
End-Mo Sentiment Idx (previous 71.8)
End-Mo Expectations Idx (previous 70.1)
12-Month Inflation Forecast (previous 2.1%)
5-Year Inflation Forecast (previous 2.5%)
End-Mo Current Idx (previous 74.3)
3:00 April Agricultural Prices
Farm Prices, M/M% (previous +1.8%)
The STOCK INDEXES? http://quotes.ino.com/ex?changes/?c=indexes
The Dow closed slightly lower on Friday as it sags ahead of Memorial Day weekend as investors watch China-U.S. Tensions. The high-range close that sets the stage for a steady to higher opening when Tuesday's night session begins trading. Stochastics and the RSI are overbought but remain neutral to bullish signaling that sideways to higher prices are possible near-term. If the Dow extends the rally off March's low, the 62% retracement level of the February-March-decline crossing at 25,199.76 is the next upside target. Closes below the 20-day moving average crossing at 24,062.75 would signal that a short-term top has been posted. First resistance is April's high crossing at 24,764.77. Second resistance is the 62% retracement level of the February-March-decline crossing at 25,199.76. First support is the 20-day moving average crossing at 24,062.75. Second support is the 50-day moving average crossing at 22,918.58.
The June NASDAQ 100 closed slightly higher on Friday. The high-range close sets the stage for a steady to higher opening when Monday's night session begins trading. Stochastics and the RSI are overbought but remain neutral to bullish signaling that sideways to higher prices are possible near-term. If June extends the rally off March's low, February's high crossing at 9780.50 is the next upside target. Closes below the 20-day moving average crossing at 9082.23 would confirm that a short-term top has been posted. First resistance is Thursday's high crossing at 9510.75. Second resistance is February's high crossing at 9780.50. First support is the 20-day moving average crossing at 9082.23. Second support is last-Thursday's low crossing at 8847.00. Second support is the May 4th low crossing at 8556.25.
The June S&P 500 closed slightly higher on Friday. The high-range close sets the stage for a steady to higher opening when Monday's night session begins trading. Stochastics and the RSI are overbought but remain neutral to bullish signaling that sideways to higher prices are possible near-term. If March extends the rally off March's low, the 75% retracement level of the February-March-decline crossing at 3085.85 is the next upside target. Closes below May's low crossing at 2775.40 are needed to confirm a downside breakout of the April-May trading range. First resistance is Thursday's high crossing at 2971.50. Second resistance is the 75% retracement level of the February-March-decline crossing at 3085.85. First support is last-Thursday's low crossing at 2780.70. Second support is May's low crossing at 2775.40.
INTEREST RATES? http://quotes.ino.com/ex?changes/?c=interest ""
June T-bonds closed up 17/32's at 180-08.
June T-bonds closed higher on Friday while extending the April-May trading range.The mid-range close sets the stage for a steady to higher opening when Tuesday's night session begins trading. Stochastics and the RSI have turned neutral to bullish signaling that sideways to higher prices are possible near-term. Closes above the April 22nd high crossing at 183-02 are needed to confirm an upside breakout of the aforementioned trading range. Closes below the April 14th low crossing at 177-14 would confirm a downside breakout of the aforementioned trading range. First resistance is the April 22nd high crossing at 183-02. Second resistance is the March 12th high crossing at 184-07. First support is Tuesday's low crossing at 177-26. Second support is the April 14th low crossing at 177-14.
June T-notes closed up 45-points at 139.065.
June T-notes closed higher on Friday while extending the April-May trading range. The mid-range close sets the stage for a steady to higher opening when Tuesday's night session begins trading. Stochastics and the RSI are neutral to bullish signaling that sideways to higher prices are possible near-term. If June renews the rally off March's low, March's high crossing at 140.240 is the next upside target. Closes below the 50-day moving average crossing at 138.131 are needed to confirm that a short-term top has been posted. First resistance is the April 21st high crossing at 139.220. Second resistance is March's high crossing at 140.240. First support is the 50-day moving average crossing at 138.131. Second support is the April 7th low crossing at 137.160.
ENERGY MARKETS? http://quotes.ino.com/ex?changes/?c=energy ""
July crude oil closed lower on Friday as it consolidates some of the rally off April's low. The high-range close sets the stage for a steady to higher opening when Tuesday's night session begins. Stochastics and the RSI are overbought but remain neutral to bullish signaling that sideways to higher prices are possible near-term. If July extends the rally off April's low, the 50% retracement level of the January-April-decline crossing at $40.12 is the next upside target. Closes below the 20-day moving average crossing at $26.34 would confirm that a short-term top has been posted. First resistance is the 38% retracement level of the January-April-decline crossing at $34.74. Second resistance is the 50% retracement level of the January-April-decline crossing at $40.12. First support is the 10-day moving average crossing at $30.00. Second support is the 20-day moving average crossing at $26.34.
July heating oil closed lower on Friday but remains above the 50-day moving average crossing at $99.42. The high-range close sets the stage for a steady to higher opening when Tuesday's night trading session begins. Stochastics and the RSI are overbought but remain neutral to bullish signaling that sideways to higher prices is possible near-term. If July extends the rally off April's low, April's high crossing at $118.84 is the next upside target. Closes below the 20-day moving average crossing at $91.86 would confirm that a short-term top has been posted. First resistance is Wednesday's high crossing at $106.38. Second resistance is April's high crossing at $118.84. First support is the 10-day moving average crossing at $97.13. Second support is the 20-day moving average crossing at $91.86.
July unleaded gas closed lower on Friday as it consolidates some of the rally off April's low. The high-range close sets the stage for a steady to higher opening when Tuesday's night session begins trading. Stochastics and the RSI are overbought but remain neutral to bullish signaling that sideways to higher prices are possible near-term. If July extends the rally off April's low, the 50% retracement level of the January-March-decline crossing at 125.43. Closes below the 20-day moving average crossing at 91.90 would confirm that a short-term top has been posted. First resistance is the 38% retracement level of the January-March-decline decline crossing at 109.27. Second resistance is the 50% retracement level of the January-March-decline decline crossing at 125.43. First support is the 10-day moving average crossing at 99.64. Second support is the 20-day moving average crossing at 91.90.
July Henry natural gas closed higher on Friday. The high-range close sets the stage for a steady to higher opening when Tuesday's night session begins trading. Stochastics and the RSI are oversold but remain neutral to bearish signaling that sideways to lower prices are possible near-term. If July renews the decline off May's high, weekly support on the weekly continuation chart crossing at 1.595 is the next downside target. Closes above the 20-day moving average crossing at 2.039 are needed to confirm that a short-term low has been posted.First resistance is the 20-day moving average crossing at 2.039. Second resistance is May's high crossing at 2.364. First support is last-Friday's low crossing at 1.822. Second support is March's low crossing at 1.802.
CURRENCIES? http://quotes.ino.com/ex?changes/?c=currencies ""
The June Dollar closed higher on Friday as it extended the April-May trading range.The high-range close sets the stage for a steady to higher opening when Tuesday's night session begins trading. Stochastics and the RSI are turning neutral to bullish signaling that sideways to higher prices are possible near-term. If June extends this week's decline, May's low crossing at 98.77 is the next downside target. Closes above the 50-day moving average crossing at 100.09 would confirm that a short-term low has been posted. First resistance is the April 6th high crossing at 101.03. Second resistance is March's high crossing at 103.96. First support is May's low crossing at 98.77. Second support is the March 27thlow crossing at 98.34. Third support is the 62% retracement level of March's rally crossing at 98.14.
The June Euro closed lower on Friday as it consolidates some of this week's rally. The low-range close sets the stage for a steady to lower opening when Tuesday's night session begins trading. Stochastics and the RSI are neutral to bullish signaling that sideways to higher prices are possible near-term. If June extends the rally off May's low, May's high crossing at 110.29 is the next upside target. If June resumes the decline off the March 27th high, April's low crossing at 107.39 is the next downside target. First resistance is May's high crossing at 110.29. Second resistance is the March 27th high crossing at 111.88. First support is May's low crossing at 107.74. Second support is April's low crossing at 107.39. Third support is March's low crossing at 106.71.
The June British Pound closed lower on Friday. The low-range close sets the stage for a steady to lower opening when Tuesday's night session begins trading. Stochastics and the RSI are neutral to bullish signaling that sideways to higher prices are possible near-term. Closes above the 20-day moving average crossing at 1.2334 are needed to confirm that a short-term low has been posted. If June renews the decline off April's high, the 50% retracement level of the March-April-rally crossing at 1.2045 is the next downside target.First resistance isthe 20-day moving average crossing at 1.2334. Second resistance is the April 30th high crossing at 1.2647. First support is Monday's low crossing at 1.2079. Second support is the 50% retracement level of the March-April-rally crossing at 1.2045.
The June Swiss Franc closed lower on Friday. The low-range close sets the stage for a steady to lower opening when Tuesday's night session begins trading. Stochastics and the RSI are neutral to bullish signaling that sideways to higher prices are possible near-term. If June renews Wednesday's rally, May's high crossing at 1.0441 is the next upside target. Closes below the April 24th low crossing at 1.0216 would confirm a downside breakout of the April-May trading range. First resistance is May's high crossing at 1.0441. Second resistance is April's high crossing at 1.0443. First support is April's low crossing at 1.0216. Second support is March's low crossing at 1.0138.
The June Canadian Dollar closed lower on Friday as it extends the April-May trading range.The mid-range close sets the stage for a steady to lower opening when Tuesday's night session begins trading. Stochastics and the RSI are turning neutral to bearish signaling that sideways to lower prices are possible near-term. If June renews the rally off March's low, the 50% retracement level of the January-March-decline crossing at 72.73 is the next upside target. If June renews the decline off the April 30th high, the April 21st low crossing at 70.12 is the next downside target. First resistance is the April 30th high crossing at 72.21. Second resistance is the 50% retracement level of the January-March-decline crossing at 72.73. First support is the April 21st low crossing at 70.12. Second support is the March 31st low crossing at 69.73. Third support is March's low crossing at 68.20.
The June Japanese Yen closed unchanged on Friday. The low-range close sets the stage for a steady to lower opening when Tuesday’s night session begins trading. Stochastics and the RSI are neutral to bearish signaling that sideways to lower prices are possible near-term. If June extends the decline off May's high, April's low crossing at 0.0916 is the next downside target. If June renews the rally off March's low, the September 2019 high crossing at 0.0951 is the next upside target. First resistance is long-term resistance crossing at 0.0942. Second resistance is the September 2019 high crossing at 0.0951. First support is Tuesday's low crossing at 0.0925. Second support is April's low crossing at 0.0916. Third support is March's low crossing at 0.0900.
PRECIOUS METALS? http://quotes.ino.com/ex?changes/?c=metals ""
June gold closed higher on Friday.The mid-range close sets the stage for a steady to lower opening when Tuesday's night session begins trading. Stochastics and the RSI are turning neutral to bearish signaling that sideways to lower prices are possible near-term. Closes below May's low crossing at $1676.00 would confirm that a short-term top has been posted while opening the door for additional weakness near-term. If April extends the rally off May's low, April's high crossing at $1788.80 is the next upside target. First resistance is Monday's high crossing at $1775.80. Second resistance is April's high crossing at $1788.80. First support is the 50-day moving average crossing at $1678.70. Second support is the April 21st low crossing at $1666.20.
July silver closed higher on Friday. The high-range close sets the stage for a steady to higher opening when Tuesday's night session begins trading. Stochastics and the RSI are overbought but remain neutral to bullish signaling that sideways to higher prices are possible near-term. If July extends the rally off March's low, February's high crossing at 19.075 is the next upside target. Closes below the 20-day moving average crossing at 16.071 would confirm that a short-term top has been posted. First resistance is the 87% retracement level of the February-March-decline crossing at 18.134. Second resistance is February's high crossing at 19.075. First support is the 10-day moving average crossing at 16.670. Second support is the 20-day moving average crossing at 16.071.
July copper closed lower on Thursday as it consolidated some of the rally off March's low. The low-range close sets the stage for a steady to lower opening when Friday's night session begins trading. Stochastics and the RSI are overbought but remain neutral to bullish signaling that sideways to higher prices are possible near-term. If July extends the rally off March's low, the 62% retracement level of the January-March-decline crossing at 254.68 is the next upside target. Closes below the 20-day moving average crossing at 236.89 are needed to confirm that a short-term top has been posted. First resistance is Thursday's high crossing at 246.80. Second resistance is the 62% retracement level of the January-March-decline crossing at 254.68. First support is the 20-day moving average crossing at 236.89. Second support is the 50-day moving average crossing at 230.41.
GRAINS? http://quotes.ino.com/ex?changes/?c=grains "
July Corn closed down a $0.00 1/4-cent at 3.17 1/2.
July corn closed fractionally lower on Friday while extending the April-May trading range. The mid-range close sets the stage for a steady to lower opening when Tuesday's night sessions begins trading. Stochastics and the RSI are neutral to bearish signaling that sideways to lower prices are possible near-term. If July renews this year's decline, psychological support crossing at $3.00 is the next downside target. If July extends the rally off April's low the April 23rd high crossing at $3.31 is the next upside target. First resistance is the 50-day moving average crossing at $3.31. Second resistance is the April 23rd high crossing at 3.31. First support is April's low crossing at $3.09. Second support is psychological support crossing at $3.00.
July wheat closed down $0.07 1/4-cents at $5.08 3/4.
July wheat closed lower on Friday. The mid-range close sets the stage for a steady to lower opening when Tuesday's night session begins trading. Stochastics and the RSI are neutral to bullish signaling that sideways to higher prices are possible near-term. Multiple closes above the 20-day moving average crossing at $5.13 3/4 would signal that a short-term low has been posted. If July extends the decline off March's high, last-September's low crossing at $4.81 1/2 is the next downside target. First resistance is the 20-day moving average crossing at $5.13 3/4. Second resistance is the 50-day high crossing at $5.30 3/4. First support is Monday's low crossing at $4.93 3/4. Second support is last-September's low crossing at $4.81 1/2.
July Kansas City Wheat closed down $0.10-cents at $4.44 1/2.
July Kansas City wheat closed lower on Tuesday ending a two-day bounce off Wednesday's low. The low-range close sets the stage for a steady to lower opening when Tuesday night session begins trading. Stochastics and the RSI are turning neutral to bullish signaling that sideways to higher prices are possible near-term. Closes above the 20-day moving average crossing at $4.68 are needed to confirm that a short-term low has been posted. If July resumes the decline off April's high, March's low crossing at $4.27 1/4 is the next downside target. First resistance is the 10-day moving average crossing at $4.54 1/4. Second resistance is the 20-day moving average crossing at $4.68. First support is Wednesday's low crossing at $4.38 3/4. Second support is March's low crossing at $4.27 1/4.
July Minneapolis wheat closed down $0.05-cents at $5.13.
July Minneapolis wheat closed lower on Friday. The low-range close sets the stage for a steady to lower opening when Tuesday's night session begins trading. Stochastics and the RSI are neutral to bullish signaling that sideways to higher prices are possible near-term. Closes above the 50-day moving average crossing at $5.23 would open the door for a possible test of April's high crossing at $5.48 1/4. If July renews this year's decline, psychological support crossing at $5.00 is the next downside target. First resistance is the 50-day moving average crossing at $5.23. Second resistance is April's high crossing at 5.48 1/4. First support is May's low crossing at $5.02. Second support is psychological support crossing at $5.00.
SOYBEAN COMPLEX? http://quotes.ino.com/ex?changes/?c=grains "
July soybeans closed down $0.01 3/4-cents at $8.33 1/4.
July soybeans closed lower on Friday. The mid-range close sets the stage for a steady to lower opening when Tuesday's night session begins trading. Stochastics and the RSI are neutral to bearish signaling that sideways to lower prices are possible near-term. If July resumes this year's decline, psychological support crossing at $8.00 is the next downside target. Closes above the 50-day moving average crossing at $8.52 are needed to confirm that a short-term low has been posted. First resistance is the 50-day moving average crossing at $8.52. Second resistance is the April 13th high crossing at $8.77 1/2. First support is April's low crossing at $8.18 1/2. Second support is psychological support crossing at $8.00.
July soybean meal closed up $1.60 at $284.10.
July soybean meal closed higher on Friday as it consolidated some of this month's decline. The low-range close sets the stage for a steady to lower opening when Tuesday's night session begins trading. Stochastics and the RSI are oversold but remain neutral to bearish signaling that sideways to lower prices are possible near-term. If July extends the decline off March's high, monthly support crossing at $278.80 is the next downside target. Closes above the reaction high crossing at $294.30 are needed to confirm that a short-term low has been posted. First resistance is the reaction high crossing at $294.30. Second resistance is the 50-day moving average crossing at $297.60. First support is today's low crossing at $282.00. Second support is monthly support crossing at $278.80.
July soybean oil closed down 44-pts. At 26.67.
July soybean oil closed lower on Friday. The low-range close sets the stage for a steady to lower opening when Tuesday's night session begins trading. Stochastics and the RSI are turning neutral to bearish signaling that sideways to lower prices are possible near-term. If July renews the decline off April's high, March's low crossing at 25.02 is the next downside target. If July extends the rally off April's low, the 25% retracement level of the December-March-decline crossing at 27.84 is the next upside target. If July renews the decline off April's high, March's low crossing at 25.02 is the next downside target. First resistance is the 25% retracement level of the December-March-decline crossing at 27.84. Second resistance is April's high crossing at 28.14. First support is April's low crossing at 25.09. Second support is March's low crossing at 25.02.
LIVESTOCKhttp://quotes.ino.com/exchanges/?c=livestock
June hogs closed down $0.58 at $58.78.
June hogs closed higher on Friday. The low-range close sets the stage for a steady to lower opening when Tuesday's night session begins trading. Stochastics and the RSI are turning neutral to bullish signaling that sideways to higher prices are possible near-term. If June renews the rally, the 50% retracement level of the 2019-2020-decline crossing at $68.55 is the next upside target. Closes below Wednesday's low crossing at $55.75 would confirm that a short-term top has been posted. First resistance is the 50% retracement level of the 2019-2020 decline crossing at $68.55. Second resistance is the 62% retracement level of the 2019-2020 decline crossing at $74.93. First support is Wednesday's low crossing at $55.75. Second support is the April 29th low crossing at $54.78.
June cattle closed down $1.10 at $97.70.
June cattle closed lower on Friday. The low-range close sets the stage for a steady to lower opening on Tuesday. Stochastics and the RSI are overbought but remain neutral to bullish signaling that sideways to higher prices are possible near-term. If June extends the rally off April's low, the 62% retracement level of the January-April-decline crossing at $103.37 is the next upside target. Closes below the 20-day moving average crossing at $92.31 would confirm that a short-term top has been posted. First resistance is Monday's high crossing at $100.00. Second resistance is the 62% retracement level of the January-April-decline crossing at $103.37. First support is the 10-day moving average crossing at $96.72. Second support is the 20-day moving average crossing at $92.31.
August Feeder cattle closed down $0.08-cents at $128.80.
August Feeder cattle closed lower on Friday as it extended the decline off May's high. Stochastics and the RSI are neutral to bearish signaling that sideways to lower prices are possible near-term. The low-range close sets the stage for a steady to lower opening when Tuesday's session begins trading. If August extends the aforementioned decline, the 50-day moving average crossing at 127.31 is the next downside target. Closes above the 10-day moving average crossing at $131.48 is the next upside target. First resistance is the 62% retracement level of the January-April-decline crossing at $138.77. Second resistance is the 75% retracement level of the January-April-decline crossing at $144.91. First support is the 50-day moving average crossing at $127.31. Second support is May's low crossing at $125.30.
FOOD & FIBERhttp://quotes.ino.com/ex changes/?c=food
July coffee closed lower on Friday as it extends the decline off March's high. The mid-range close sets the stage for a steady to lower opening on Tuesday. Stochastics and the RSI are oversold but remain neutral to bearish signaling that sideways to lower prices are possible near-term. If July resumes the decline off March's high, last-October's low crossing at 10.03 is the next downside target. Closes above the 50-day moving average crossing at 11.29 would confirm that a low has been posted.
July cocoa closed higher on Friday. The high-range close sets the stage for a steady to higher opening on Tuesday. Stochastics and the RSI are neutral to bearish signaling that sideways to lower prices are possible near-term. Closes below the 50-day moving average crossing at 23.34 would confirm that a short-term top has been posted. If July renews the rally off March's low, the 50% retracement level of the February-March decline crossing at 25.68 is the next upside target.
July sugar closed lower on Friday as it consolidates some of the rally off April's low. The high-range close set the stage for a steady to higher opening on Tuesday. Stochastics and the RSI are overbought, diverging and are turning neutral to bearish hinting that a short-term top might be in or is near. Closes below the 20-day moving average crossing at 10.42 would signal that a short-term top has been posted. If July extends the rally off April's low, the 38% retracement level of the February-April-decline crossing at 11.45 is the next upside target.
July cotton closed lower on Friday as it consolidates some of the rally off April's low. The mid-range close sets the stage for a steady to lower opening on Tuesday. Stochastics and the RSI are turning neutral to bearish signaling that sideways to lower prices are possible near-term. Closes below the 50-day moving average crossing at 54.93 would confirm that a short-term top has been posted. If July extends the rally off April's low, the 50% retracement level of the January-April-decline crossing at 61.06.
Thanks Tallpine!
Long weekend coming up so the weather outlook on Friday will be a thing of the distant past when the grains open up again Monday evening!
Pretty big rains coming up the next week, some of it in dry spots.
Will an upper level heat ridge start building towards the end of 2 weeks?
1 week rains below:
Liquid equivalent precip forecasts for the next 7 days are below.
Big rains in the Plains/SW Midwest, where some places will welcome it.
Day 1 below:
http://www.wpc.ncep.noaa.gov/qpf/fill_94qwbg.gif?1526306199054

Day 2 below:
http://www.wpc.ncep.noaa.gov/qpf/fill_98qwbg.gif?1528293750112

Day 3 below
http://www.wpc.ncep.noaa.gov/qpf/fill_99qwbg.gif?1528293842764

Days 4-5 below:
http://www.wpc.ncep.noaa.gov/qpf/95ep48iwbg_fill.gif?1526306162

Days 6-7 below:
http://www.wpc.ncep.noaa.gov/qpf/97ep48iwbg_fill.gif?1526306162

7 Day Total precipitation below:
https://www.wpc.ncep.noaa.gov/qpf/p168i.gif?1566925971

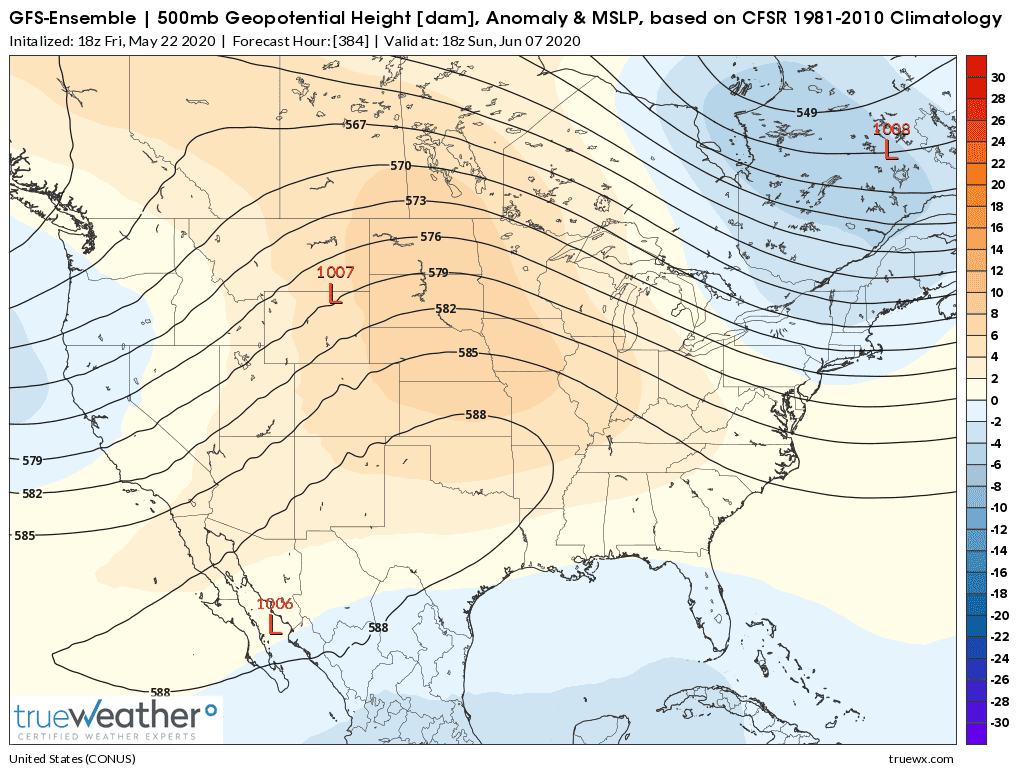
Last map(384 hours) June 7..... from the last 18z GFS ensemble just out.
Upper level ridge building in the Plains. Will this continue into the 2nd week of June and turn bullish?