Welcome to May...........23rd!
MUCH WARMER weather but models have been shifting the heat westward in week 2 with a possible heat ridge building. Could get bullish grains in early June if this leads to an AMPLIFIED pattern. Just depends on where the heat ridge develops .........IF it develops.
Late week 2 temps looking warmer and more bullish for natural gas on Saturday but with great uncertainty.
NEW: My Summer Forecast/La Nina's/Climate Change
Started by metmike - May 23, 2020, 11:33 p.m.
https://www.marketforum.com/forum/topic/52701/
This very warm/humid weather could help lessen coronavirus survival times.
Game changing?-Summer kills COVID-19
https://www.marketforum.com/forum/topic/51095/
Warm weather and CV
https://www.marketforum.com/forum/topic/52562/
Latest COVID-19 numbers:
https://www.marketforum.com/forum/topic/52243/
Scroll down and enjoy the latest comprehensive weather to the max...... occurring because of the natural physical laws in our atmosphere as life on this greening planet continues to enjoy the best weather/climate in at least 1,000 years(the last time that it was this warm) with the added bonus of extra beneficial CO2.
Reasons to keep being thankful here in 2020!
https://www.marketforum.com/forum/topic/45623/
Go to the link below, then hit the location/county on the map for details.
https://www.spc.noaa.gov/ Go to "hazards"
Here are the latest hazards across the country.
 |
Purple/Pink/blue on land is cold/Winter weather. Brown is wind, Green is flooding. Gray is fog. Reddish is a red flag advisory.
Go to the link below, then hit the location/county on the map for details.
https://www.spc.noaa.gov/ Go to "hazards"
https://www.mesonet.org/index.php/weather/map/us_air_temperature/air_temperature

https://www.mesonet.org/index.php/weather/map/wind_chill_heat_index1/air_temperature

Current Weather Map
| NCEP Days 0-7 Forecast Loop | NCEP Short-Range Model Discussion | NCEP Day 3-7 Discussion |


Current Jet Stream

| Low Temperatures Tomorrow Morning |

Highs today and tomorrow.


Highs for days 3-7:
Very warm period!


Temperatures compared to Average for days 3-7
Mostly reds.
https://www.wpc.ncep.noaa.gov/medr/medr_mean.shtml


Surface Weather features day 3-7:

Liquid equivalent precip forecasts for the next 7 days are below.
Heaviest TX/OK!
Day 1 below:
http://www.wpc.ncep.noaa.gov/qpf/fill_94qwbg.gif?1526306199054

Day 2 below:
http://www.wpc.ncep.noaa.gov/qpf/fill_98qwbg.gif?1528293750112

Day 3 below
http://www.wpc.ncep.noaa.gov/qpf/fill_99qwbg.gif?1528293842764

Days 4-5 below:
http://www.wpc.ncep.noaa.gov/qpf/95ep48iwbg_fill.gif?1526306162

Days 6-7 below:
http://www.wpc.ncep.noaa.gov/qpf/97ep48iwbg_fill.gif?1526306162

7 Day Total precipitation below:
https://www.wpc.ncep.noaa.gov/qpf/p168i.gif?1566925971

Excessive rain potential.
Mesoscale Precipitation Discussions
Current Day 1 Forecast Valid 16Z 08/30/19 - 12Z 08/31/19 |
Day 1 Threat Area in Text Format
| Day 2 and Day 3 Forecasts |
Current Day 2 Forecast Valid 12Z 08/31/19 - 12Z 09/01/19 |
Day 2 Threat Area in Text Format
Current Day 3 Forecast |
Severe Storm Risk the next 8 days:
Current Day 1 Outlook | |
Current Day 2 Outlook | |
Current Day 3 Outlook | F |
Current Day 4-8 Outlook |
Current Dew Points
Dry air/low dew points................that likely helps virus's in the air to survive longer.
Higher dew points cuts down on survival time.
It's thought that doubling the humidity(amount of moisture in the air) will decrease the amount of a virus that survives in the air for 1 hour by 50%. Based on the study out April 23rd.......we do know this now with COVID-19.
Game changing-Summer kills COVID-19
https://www.marketforum.com/forum/topic/51095/

Latest radar loop
http://www.nws.noaa.gov/radar_tab.php


| (3400x1700 pixels - 2.2mb) Go to: Most Recent Image |

Go to: Most Recent Image
You can go to this link to see precipitation totals from recent time periods:
https://water.weather.gov/precip/
Go to precipitation, then scroll down to pick a time frame. Hit states to get the borders to see locations better. Under products, you can hit "observed" or "Percent of Normal"
Soilmoisture anomaly:
These maps sometimes take a day to catch up to incorporate the latest data(the bottom map is only updated once a week).
Soils in many parts of the Cornbelt have dried out enough for early planting. Corn and bean planting is well ahead of the average for mid May.
https://www.cpc.ncep.noaa.gov/products/Soilmst_Monitoring/US/Soilmst/Soilmst.shtml#
![]()


Drought Monitor maps:
Latest: The first map below is the latest. The 2nd one is from last week.
April 23: LOOKY_LOOKY! For the first time this year, its gotten dry enough for a few (small)areas in the Upper Midwest/Western Cornbelt to report slight drought.
April 30: Drought increased a bit......Plains and U.Midwest.
May: 7: Drought increased a bit from KS westward.
May 14: Drought increased a bit again, now, parts of Iowa have slight drought(this dry weather is why planting is ahead of schedule). Rains are coming to the dry spots in the forecast though.......bearish.
May 21: A bit more drought in ND.
The maps below are updated on Thursdays.
https://droughtmonitor.unl.edu/


The top map is the Canadian ensemble average, the maps below are the individual members that make up the average at the end of week 2.
+++++++++++++++++++++++++++++++++++++++++
Each member is like the parent, Canadian model operational model.......with a slight tweek/variation in parameters. Since we know the equations to represent the physics of the atmosphere in the models are not perfect, its useful to vary some of the equations that are uncertain(can make a difference) to see if it effects the outcome and how.
The average of all these variations(ensembles) often yields a better tool for forecasting. It's always more consistent. The individual operational model, like each individual ensemble member can vary greatly from run to run.........and represent an extreme end of the spectrum at times. The ensemble average of all the members, because it averages the extremes.............from opposite ends of the spectrum.........changes much less from run to run.
End of week 2....................0z Canadian ensembles:
Last Monday: Very Warm. How much rain??? Will a zone of heavy rains set up north of a heat ridge in the South with a strong Pacific jet stream?
Wednesday: Fast zonal flow in the northern tier?? The average has that but the pattern might be different.
Thursday: Huge disparity in solutions.
Friday: Will the pattern become amplified and turn bullish?
Saturday: Some solutions amplify and have a heat ridge. Very uncertain.
360h GZ 500 forecast valid on Jun 07, 2020 12 UTC


Forecasts for the control (GEM 0) and the 20 ensemble members (global model not available)
Individual GFS ensemble solutions for the latest 0z run:

GFS Ensemble mean(average of all the individual solutions above). The first map is a mid/upper level map. The 2nd one is a temperatures map at around 1 mile above the surface. These are anomalies(difference compared to average).
NCEP Ensemble t = 360 hour forecast
Last: Saturday: Warm. Mostly positive anomalies in the US.
Monday: Positive anomalies and very warm for much of the country.
Wednesday: Positive anomalies in the Northeast at the end of week 1. Weakening in week 2 and maybe not as warm, certainly not as warm looking as the maps from earlier this week.
Saturday: Positive anomalies and very warm in much of the country. How amplified does the pattern get? Rains could get shut down, especially if the positive anomaly is in the Plains.
1 week out below
2 weeks out below

Latest, updated graph/forecast for AO and NAO and PNA here, including an explanation of how to interpret them...............mainly where they stand at the end of 2 weeks.
https://www.marketforum.com/forum/t
Previous analysis, with the latest day at the bottom for late week 2 period.
Discussions, starting with the oldest below.
Last Monday: Indices close to 0, not a factor. They become less useful in the warm season as they are best used for northern stream indicators.
Tuesday: Positive AO. Near 0 for NAO and PNA.
Wednesday: AO goes from positive to near 0, same with PNA. NAO near 0. Getting to the time of year when they are not that important, since they work best predicting a northern stream that is seasonally shifting north of the US.
Saturday: Close enough to 0 to not matter, especially in the warm season.
National Weather Service 6-10 day, 8-14 day outlooks.
Updated daily just after 2pm Central.
Temperature Probability
 Precipitation Probability

| the 8-14 day outlooks ArchivesAnalogsLines-Only FormatGIS Data | |
Temperature Probability | |
 | |
I'm thinking that we could rapidly shift to a La Nina this Summer! This contrasts with the models and NOAA forecast below.
La Nina Summers have a strong tendency to be hotter and drier than average. More on that below.
From NOAA: "Summary *Equatorial sea surface temperatures (SSTs) are near average across most of the Pacific Ocean.The tropical atmospheric circulation is consistent with ENSO-neutral.There is a ~65% chance of ENSO-neutral during Northern Hemisphere summer 2020, with chances decreasing through the autumn (to 45-50%)"
metmike: The models keep the odds highest of neutral until late this year, when La Nina odds are slightly higher. Odds of an El Nino are very low from the models and looking at ocean temperatures right now, it would be almost impossible to have an El Nino this Summer.
Here is a summary of the model output and forecast:
.png)
Here are the individual models:
.png)
Why I disagree with that.
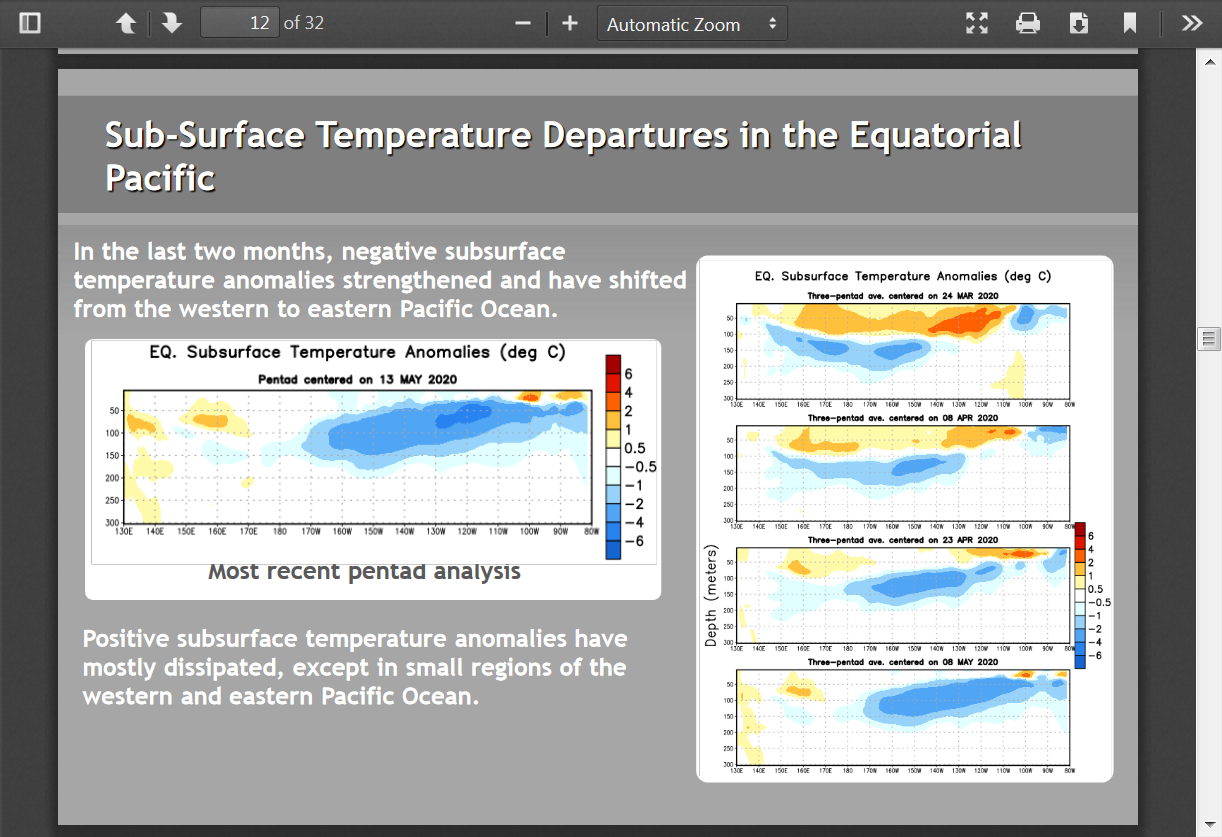
Look at the changes in the upper ocean heat content right now in the Central and Eastern Pacific. WOW! Subsurface temperatures have fallen off a cliff. Much of this colder water is just below the surface but is likely to make it to the surface this Summer.
The 2nd set of graphs below, show the colder water heading towards the surface since March(maps on the right). Note that we have a pretty big -2.0 C contour just below the surface, expanding in size from 80W to 160W. This is the recipe for a La Nina which is defined by surface water temps of -.5 deg C or colder in this part of the Tropical Pacific.
.png)
Why is this potentially a big deal?
https://weatherworksinc.com/news/el-nino-la-nina-summer-2020
1. La Nina Summer's have very strong tendencies to be hot. El Nino Summers tend to be cool.
What Effect does an El Niño or La Niña have on Summer Weather?

Temperature departures during the summer in the last 10 El Niños, left, and La Niñas, right, courtesy of NOAA and ESRL
+++++++++++++++++++++++++++++++++++++++++++++++++++++++++++++++++++++++++++++++++++++++++++
2. During La Nina's the southern half of the country has a strong tendency to be dry to very dry.......into the S.Plains to KS/MO but also to the Mid Atlantic States. During El Nino's the regional patterns are not as clear but El Nino Summers are usually much wetter than La Nina Summers........with the Upper Midwest sometimes an exception.....but even there, the added heat evaporates much more moisture.

Here is the latest NWS outlook for this Summer. Clearly its based on Neutral ENSO conditions continuing and no La Nina. I suspect that La Nina conditions will be present much sooner than the models predict and the lag time for the atmosphere to respond is almost immediate(ocean temperatures affect the atmosphere above right away) vs NOAA waiting for several month of La Nina conditions to officially call it a La Nina.
So I would ADD much more heat to the center of the country and take out most of the above precip, especially in the South, even though recent Summers have featured more precip.
I never do long range forecasts but that huge blob of cold water coming to the surface in the Central/Eastern Tropical Pacific is very significant.
+++++++++++++++++++++++++++++++++++++++++++++++++++++++++++++++++
From NOAA: Summer outlook (J-J-A) updated May 21st:
Bearish grains(high odds for above rain Cornbelt-Average temps).
Potentially pretty bullish for Natural Gas. Elevated chance for heat in the West and as well as the East and also the deep south.
Take this with an even smaller grain of salt!


Let's look at some previous significant droughts and we can see that they usually correlate with a La Nina. That doesn't mean every La Nina causes a drought but the strong tendency is there.
++++++++++++++++++++++++++++++++
In 2010/11, a long lasting drought was present in the S.Plains, likely the result of a nearly 2 year long La Nina. Then, in early 2012, it expanded northeast into the Midwest. This was our last major Cornbelt drought.
The ONI index below is one measure that we use to determine an El Nino or La Nina. At +.5 Deg. C and above it's considered El Nino, -.5 Deg C and below are La Nina.
https://origin.cpc.ncep.noaa.gov/products/analysis_monitoring/ensostuff/ONI_v5.php
Year | DJF | JFM | FMA | MAM | AMJ | MJJ | JJA | JAS | ASO | SON | OND | NDJ |
| 2010 | 1.5 | 1.3 | 0.9 | 0.4 | -0.1 | -0.6 | -1.0 | -1.4 | -1.6 | -1.7 | -1.7 | -1.6 |
| 2011 | -1.4 | -1.1 | -0.8 | -0.6 | -0.5 | -0.4 | -0.5 | -0.7 | -0.9 | -1.1 | -1.1 | -1.0 |
| 2012 | -0.8 | -0.6 | -0.5 | -0.4 | -0.2 | 0.1 | 0.3 | 0.3 | 0.3 | 0.2 | 0.0 | -0.2 |
| 2013 | -0.4 | -0.3 | -0.2 | -0.2 | -0.3 | -0.3 | -0.4 | -0.4 | -0.3 | -0.2 | -0.2 | -0.3 |
+++++++++++++++++++++++++++++++++++++++++++++++++++++++++++++++++++++++++++++++++++++
The previous period of a La Nina was 2007/8.
| 2007 | 0.7 | 0.3 | 0.0 | -0.2 | -0.3 | -0.4 | -0.5 | -0.8 | -1.1 | -1.4 | -1.5 | -1.6 |
| 2008 | -1.6 | -1.4 | -1.2 | -0.9 | -0.8 | -0.5 | -0.4 | -0.3 | -0.3 | -0.4 | -0.6 | -0.7 |
I was able to pull up a drought monitor map for August 2007. Extreme drought in dark red under a long lived, rain suppressing heat ridge. The heat ridge was farther north in 2008 but soybean yields were below trend in both years with that La Nina.
++++++++++++++++++++++++++++++++++++++++++++++++++++++++++++++++++++++++++++++++++++++++++++
Producers may remember the Summers with the previous long lived LaNina before that one. 2nd half of the Summers in 1998/99/2000 were especially hot and dry. Soybean yields were just below trendline in the later 2 years.
| 1997 | -0.5 | -0.4 | -0.1 | 0.3 | 0.8 | 1.2 | 1.6 | 1.9 | 2.1 | 2.3 | 2.4 | 2.4 |
| 1998 | 2.2 | 1.9 | 1.4 | 1.0 | 0.5 | -0.1 | -0.8 | -1.1 | -1.3 | -1.4 | -1.5 | -1.6 |
| 1999 | -1.5 | -1.3 | -1.1 | -1.0 | -1.0 | -1.0 | -1.1 | -1.1 | -1.2 | -1.3 | -1.5 | -1.7 |
Year | DJF | JFM | FMA | MAM | AMJ | MJJ | JJA | JAS | ASO | SON | OND | NDJ |
| 2000 | -1.7 | -1.4 | -1.1 | -0.8 | -0.7 | -0.6 | -0.6 | -0.5 | -0.5 | -0.6 | -0.7 | -0.7 |
| 2001 | -0.7 | -0.5 | -0.4 | -0.3 | -0.3 | -0.1 | -0.1 | -0.1 | -0.2 | -0.3 | -0.3 | -0.3 |
Note the huge drop in soil moisture as we went from the wetter SUPER El Nino in 97/98 to the La Nina in 99/00/01:

+++++++++++++++++++++++++++++++++++++++++++++++++++++++
I have to do this one from memory. 1995 was a wet Spring, then turned very hot/dry late June thru August, then we had the early freeze in September. Did morphing from the El Nino early in the year to the La Nina by August have an affect?
| 1995 | 1.0 | 0.7 | 0.5 | 0.3 | 0.1 | 0.0 | -0.2 | -0.5 | -0.8 | -1.0 | -1.0 | -1.0 |
| 1996 | -0.9 | -0.8 | -0.6 | -0.4 | -0.3 | -0.3 | -0.3 | -0.3 | -0.4 | -0.4 | -0.4 | -0.5 |
++++++++++++++++++++++++++++++++++++++++++++++++++++++++++++++++++++++++++++++++++++++++
The historic drought of 1988! That drought started very early in the year, before the "official" value dropped into La Nina zone in May. Sometimes, it appears that a rapidly falling into a La Nina or rising in an El Nino matters before the value gets into the "official" category.
| 1987 | 1.2 | 1.2 | 1.1 | 0.9 | 1.0 | 1.2 | 1.5 | 1.7 | 1.6 | 1.5 | 1.3 | 1.1 |
| 1988 | 0.8 | 0.5 | 0.1 | -0.3 | -0.9 | -1.3 | -1.3 | -1.1 | -1.2 | -1.5 | -1.8 | -1.8 |
| 1989 | -1.7 | -1.4 | -1.1 | -0.8 | -0.6 | -0.4 | -0.3 | -0.3 | -0.2 | -0.2 | -0.2 | -0.1 |
Year | DJF | JFM | FMA | MAM | AMJ | MJJ | JJA | JAS | ASO | SON | OND | NDJ |
++++++++++++++++++++++++++++++++++++
The previous major drought, 1983 was much different. We went from very wet conditions during the first half of the year, to somebody flipping an atmospheric switch at the end of June. After than, almost no rain and 90+ every day for the rest of Summer with many 100 degree temps. That was my first Summer on television forecasting weather for Cornbelt farmers. 7 days above 100 that Summer here in sw. Indiana. Though we didn't hit a La Nina until very late in the Summer, ONI numbers were PLUNGING lower from a SUPER El Nino.
| 1982 | 0.0 | 0.1 | 0.2 | 0.5 | 0.7 | 0.7 | 0.8 | 1.1 | 1.6 | 2.0 | 2.2 | 2.2 |
| 1983 | 2.2 | 1.9 | 1.5 | 1.3 | 1.1 | 0.7 | 0.3 | -0.1 | -0.5 | -0.8 | -1.0 | -0.9 |
| 1984 | -0.6 | -0.4 | -0.3 | -0.4 | -0.5 | -0.4 | -0.3 | -0.2 | -0.2 | -0.6 | -0.9 | -1.1 |
| 1985 | -1.0 | -0.8 | -0.8 | -0.8 | -0.8 | -0.6 | -0.5 | -0.5 | -0.4 | -0.3 | -0.3 | -0.4 |
+++++++++++++++++++++++++++++++++++++++++++++++++++++++++++++++++++++++++++
The Summer of 1980 brought an historic heat ridge to the S.Plains and drought to much of the country.....but with neutral conditions. La Nina's and a cooling Pacific don't always mean widespread heat ridges and widespread heat ridges can happen for reasons different than a La Nina.
Year | DJF | JFM | FMA | MAM | AMJ | MJJ | JJA | JAS | ASO | SON | OND | NDJ |
| 1980 | 0.6 | 0.5 | 0.3 | 0.4 | 0.5 | 0.5 | 0.3 | 0.0 | -0.1 | 0.0 | 0.1 | 0.0 |

The early/mid 1970's were near the end of over 2 decades of modest global cooling and a period that strongly favored cooler Pacific Ocean temperatures and La Nina's as a result.
1974 was one of the worst years in history for growing crops in the US.
That was the year of the historic, widespread, crop killing Labor Day freezes. Though we had global cooling, there was record Summer heat and extreme dryness in the Summer of 1974.
https://journals.ametsoc.org/doi/pdf/10.1175/1520-0493%281974%29102%3C0736%3AWACOJ%3E2.0.CO%3B2
102%200736%20WACOJ%202%200%20CO%3B2_JJ3SEaX.png)
102%200736%20WACOJ%202%200%20CO%3B2(1).png)
Note the long lived La Nina and cooler tropical Pacific Ocean temperatures at the time:
| 1973 | 1.8 | 1.2 | 0.5 | -0.1 | -0.5 | -0.9 | -1.1 | -1.3 | -1.5 | -1.7 | -1.9 | -2.0 |
| 1974 | -1.8 | -1.6 | -1.2 | -1.0 | -0.9 | -0.8 | -0.5 | -0.4 | -0.4 | -0.6 | -0.8 | -0.6 |
| 1975 | -0.5 | -0.6 | -0.7 | -0.7 | -0.8 | -1.0 | -1.1 | -1.2 | -1.4 | -1.4 | -1.6 | -1.7 |
The time previous to that with a long lived La Nina was the mid 1950's. This also was in the middle of a decade of modest global cooling.
Again, you can find the La Nina data here:
https://origin.cpc.ncep.noaa.gov/products/analysis_monitoring/ensostuff/ONI_v5.php
| 1954 | 0.8 | 0.5 | 0.0 | -0.4 | -0.5 | -0.5 | -0.6 | -0.8 | -0.9 | -0.8 | -0.7 | -0.7 |
| 1955 | -0.7 | -0.6 | -0.7 | -0.8 | -0.8 | -0.7 | -0.7 | -0.7 | -1.1 | -1.4 | -1.7 | -1.5 |
| 1956 | -1.1 | -0.8 | -0.6 | -0.5 | -0.5 | -0.5 | -0.6 | -0.6 | -0.5 | -0.4 | -0.4 | -0.4 |
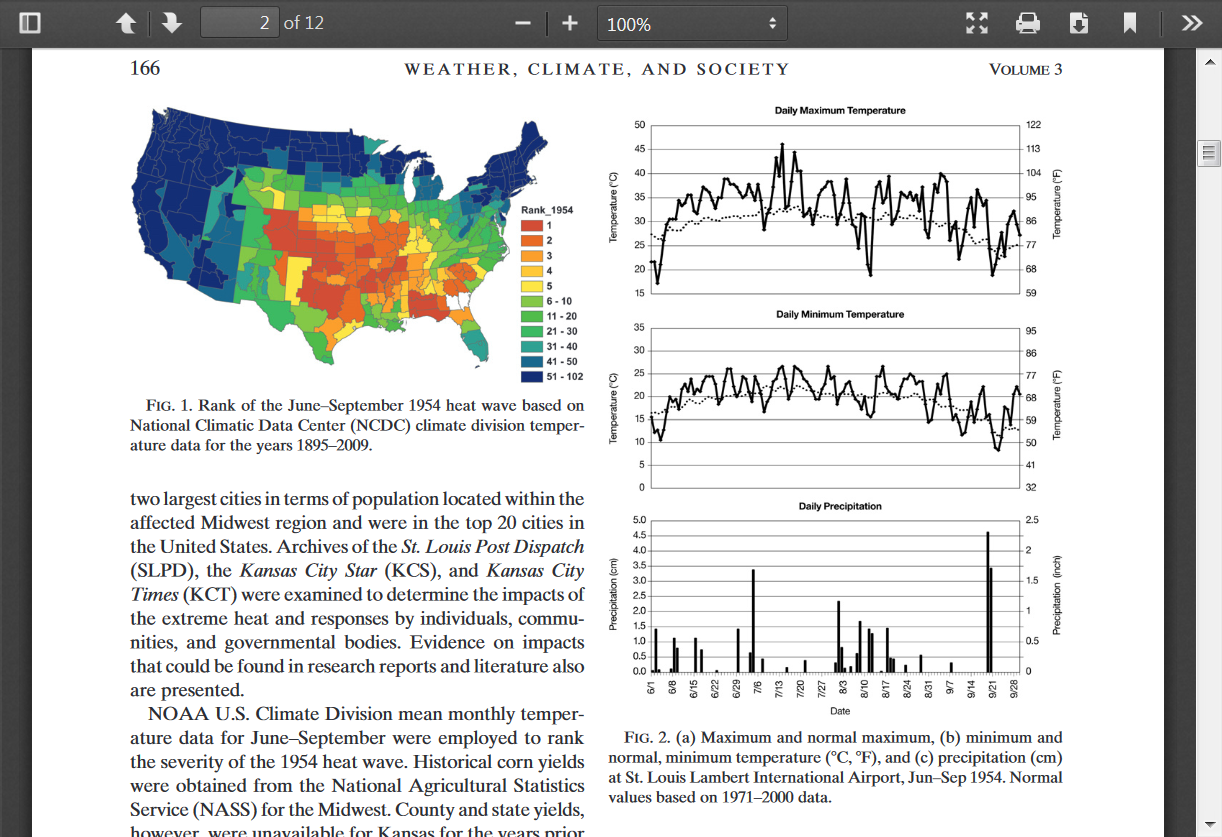
I remember from my weather history, that the Summer of 1954 featured the driest/hottest weather since the Dust Bowl, record hot/dry 1930's........in some places even hotter!
https://journals.ametsoc.org/doi/pdf/10.1175/WCAS-D-10-05002.1
The Prolonged 1954 Midwestern U.S. Heat Wave: Impacts and Responses NANCYE. WESTCOTT Midwestern Regional Climate Center, Illinois State Water Survey, Prairie Research Institute,University of Illinois at Urbana–Champaign, Urbana, Illinois(Manuscript received 29 September 2010, in final form 18 August 2011)ABSTRACTThe highest recorded temperature in Illinois, 117F (47.28C) occurred on 14 July 1954 in East St. Louis. This occurred in the midst of a widespread, long-lasting heat wave covering significant parts of 11 states: from eastern Colorado through Kansas, Oklahoma, part of Texas, Missouri, and Arkansas, southern Illinois, andextending to western Tennessee, Alabama, Georgia, and parts of the Carolinas. According to historical cli-mate data, this event ranked as one of the top five extended periods of heat in these states since 1895. No such prolonged heat wave has occurred in the Midwest since 1954. It stands to reason that since prolonged widespread heat waves have occurred in the last 100 years, there is a distinct possibility that they will occur again, and reviewing past impacts could help us plan for future events.
_h4OSHFE.png)
There are several things that we can learn by going back and looking at past weather/climate and La Nina's/El Nino's.
1. One of them is that La Nina's and cooler Pacific Ocean water temperatures increase the chances for extreme weather in the Midwest, especially widespread heat and dryness during the growing season.
2. El Nino's and warmer Tropical Pacific water temperatures increase the chances for favorable weather in the Cornbelt during the growing season.
3. Global warming/climate change has increased tropical Pacific Ocean water temperatures, with El Nino's also going up and it's one of the reasons that climate change has resulted in the best weather in recorded history for growing crops, including only 1 widespread Midwest drought since 1988(that one in 2012), when historically, 4 widespread, severe droughts would have been expected during that period (with the old climate).
4. This does not take into account the law of photosynthesis which is also adding greater to crop yields.
5. Additionally, we plant and grow crops like corn in tightly packed rows that are twice as dense as they were 40 years ago. This has resulted in a micro climate in the Midwest, several weeks after the majority of the corn plants have emerged. The massive increase in evapotranspiration from these plants, has increased low level moisture, with dew points in some cases, more than 5 deg. higher over several states.
Here's more:
Corn and climate change
13 responses |
Started by metmike - Dec. 6, 2018, 10:43 a.m.
https://www.marketforum.com/forum/topic/18987/
6. There is much more to it than just the temperatures in the Pacific Ocean and the benefits of climate change(CO2). Any one Summer can feature influencing factors that are completely independent of these factors and weather the complete opposite of the historical tendency. Related to this, the current forecast for the potential upcoming La Nina is also uncertain. This greatly reduces the skill of seasonal forecasts, so please keep that in mind with this Summer forecast that calls for widespread above normal temperatures and at least some areas with increasing drought.


