12Z Sun vs 12Z Fri in CDD:
GEFS -1
EPS +5
12Z Sun vs 0Z Fri in CDD:
GEFS: +3
EPS: +4
Friday was near unchanged in most active contract, August.
Overall, on the basis of wx alone, I'd call this slightly bullish and overall it is quite warm as it is slightly warmer than Friday overall and is quite warm in the Plains to the Midwest/NE. The SE is near normal rather than AN, largely a result of wet soils though it is quite humid and still seasonably hot which itself is not bearish.
But as always, especially in recent months due to COVID, it remains to be seen whether or not NG opens up.
Thanks much for getting us started on the new week again Larry! Your ng posts are the best!
I agree completely with that and will guess we open higher.......potential for a gap higher open if the market focuses on just the heat.
1.569 was the high on Friday.
Here's is the latest weather.
https://www.marketforum.com/forum/topic/54722/
Here was the previous ng thread. I'll try to add the relevant stuff to this thread this evening:
We opened a bit higher but a tad below Friday's highs but are just above those highs currently after an hour of trading.
The Dow and CL are down just a bit but behaving, so not that much of a factor at the moment.
Hot as a Firecracker as they say!
https://www.marketforum.com/forum/topic/54771/
NG having one of its biggest days in a long time because of the advertised, widespread heat coming up which will cause major demand for AC using ng to generate the electricity.
Let the (modest) heat wave begin! Here's your first weather discussion/maps and more to kick off the new month: https://www.marketforum.com/forum/topic/54920/
Not as hot(or as bullish for NG), especially later in week 2 on GFS products.
Last weeks EIA:
![]()
for week ending June 19, 2020 | Released: June 25, 2020 at 10:30 a.m. | Next Release: July 2, 2020
+120 BCF in mid June is off the charts bearish!
| Working gas in underground storage, Lower 48 states Summary textCSVJSN | |||||||||||||||||||||||||
|---|---|---|---|---|---|---|---|---|---|---|---|---|---|---|---|---|---|---|---|---|---|---|---|---|---|
| Historical Comparisons | |||||||||||||||||||||||||
| Stocks billion cubic feet (Bcf) | Year ago (06/19/19) | 5-year average (2015-19) | |||||||||||||||||||||||
| Region | 06/19/20 | 06/12/20 | net change | implied flow | Bcf | % change | Bcf | % change | |||||||||||||||||
| East | 619 | 586 | 33 | 33 | 491 | 26.1 | 515 | 20.2 | |||||||||||||||||
| Midwest | 716 | 688 | 28 | 28 | 528 | 35.6 | 571 | 25.4 | |||||||||||||||||
| Mountain | 165 | 156 | 9 | 9 | 124 | 33.1 | 157 | 5.1 | |||||||||||||||||
| Pacific | 299 | 290 | 9 | 9 | 242 | 23.6 | 284 | 5.3 | |||||||||||||||||
| South Central | 1,212 | 1,173 | 39 | 39 | 888 | 36.5 | 1,019 | 18.9 | |||||||||||||||||
| Salt | 372 | 358 | 14 | 14 | 263 | 41.4 | 304 | 22.4 | |||||||||||||||||
| Nonsalt | 840 | 815 | 25 | 25 | 625 | 34.4 | 715 | 17.5 | |||||||||||||||||
| Total | 3,012 | 2,892 | 120 | 120 | 2,273 | 32.5 | 2,546 | 18.3 | |||||||||||||||||
Totals may not equal sum of components because of independent rounding. | |||||||||||||||||||||||||
Working gas in storage was 3,012 Bcf as of Friday, June 19, 2020, according to EIA estimates. This represents a net increase of 120 Bcf from the previous week. Stocks were 739 Bcf higher than last year at this time and 466 Bcf above the five-year average of 2,546 Bcf. At 3,012 Bcf, total working gas is within the five-year historical range.
For information on sampling error in this report, see Estimated Measures of Sampling Variability table below.

Note: The shaded area indicates the range between the historical minimum and maximum values for the weekly series from 2015 through 2019. The dashed vertical lines indicate current and year-ago weekly periods.
| Release Date | Time | Actual | Forecast | Previous | |
|---|---|---|---|---|---|
| Jul 02, 2020 | 10:30 | 120B | |||
| Jun 25, 2020 | 10:30 | 120B | 106B | 85B | |
| Jun 18, 2020 | 10:30 | 85B | 85B | 93B | |
| Jun 11, 2020 | 10:30 | 93B | 93B | 102B | |
| Jun 04, 2020 | 10:30 | 102B | 110B | 109B | |
| May 28, 2020 | 10:30 | 109B | 107B | 81B |
7 day temps for the period of that last report:
Previous comment before the report: When its relatively cool compared to average in the Summer/cooling season, where all the people live, you don't use much electricity for air conditioning that is generated by burning natural gas..........and you have big injections into storage.
It was hot in the Plains but not as many people live there.
7 day temps for Thursday's report:
Warmer where most of the people live and cooler where they don't, so the injection will not be so huge.
![]()
for week ending June 26, 2020 | Released: July 2, 2020 at 10:30 a.m. | Next Release: July 9, 2020
+65 BCF Bullish!
| Working gas in underground storage, Lower 48 states Summary text CSV JSN | |||||||||||||||||||||||||
|---|---|---|---|---|---|---|---|---|---|---|---|---|---|---|---|---|---|---|---|---|---|---|---|---|---|
| Historical Comparisons | |||||||||||||||||||||||||
| Stocks billion cubic feet (Bcf) | Year ago (06/26/19) | 5-year average (2015-19) | |||||||||||||||||||||||
| Region | 06/26/20 | 06/19/20 | net change | implied flow | Bcf | % change | Bcf | % change | |||||||||||||||||
| East | 639 | 619 | 20 | 20 | 518 | 23.4 | 541 | 18.1 | |||||||||||||||||
| Midwest | 740 | 716 | 24 | 24 | 559 | 32.4 | 596 | 24.2 | |||||||||||||||||
| Mountain | 173 | 165 | 8 | 8 | 132 | 31.1 | 162 | 6.8 | |||||||||||||||||
| Pacific | 304 | 299 | 5 | 5 | 252 | 20.6 | 287 | 5.9 | |||||||||||||||||
| South Central | 1,222 | 1,212 | 10 | 10 | 903 | 35.3 | 1,025 | 19.2 | |||||||||||||||||
| Salt | 368 | 372 | -4 | -4 | 260 | 41.5 | 299 | 23.1 | |||||||||||||||||
| Nonsalt | 854 | 840 | 14 | 14 | 643 | 32.8 | 726 | 17.6 | |||||||||||||||||
| Total | 3,077 | 3,012 | 65 | 65 | 2,365 | 30.1 | 2,611 | 17.8 | |||||||||||||||||
Totals may not equal sum of components because of independent rounding. | |||||||||||||||||||||||||
Working gas in storage was 3,077 Bcf as of Friday, June 26, 2020, according to EIA estimates. This represents a net increase of 65 Bcf from the previous week. Stocks were 712 Bcf higher than last year at this time and 466 Bcf above the five-year average of 2,611 Bcf. At 3,077 Bcf, total working gas is within the five-year historical range.
For information on sampling error in this report, see Estimated Measures of Sampling Variability table below.
Note: The shaded area indicates the range between the historical minimum and maximum values for the weekly series from 2015 through 2019. The dash
| Jul 02, 2020 | 10:30 | 65B | 78B | 120B | |
| Jun 25, 2020 | 10:30 | 120B | 106B | 85B | |
| Jun 18, 2020 | 10:30 | 85B | 85B | 93B | |
| Jun 11, 2020 | 10:30 | 93B | 93B | 102B | |
| Jun 04, 2020 | 10:30 | 102B | 110B | 109B | |
| May 28, 2020 | 10:30 | 109B | 107B | 81B |
Hot weather Thursday, still bullish at the moment but there are a few, significant minority solutions that have some cooling later in week 2:
Plenty of heat and bullish weather!
Saturday weather discussion:
Huge drop in the CDDs in all the 0z models.
Still pretty hot overall but not AS hot now with several day much colder than before.
Sort of Sizzling Sunday to you! Here's your weather: https://www.marketforum.com/forum/topic/55146/
We got hotter on Saturday, then took out a bunch of heat on the overnight 0z runs for the end of this week/next weekend..............then today, added some back with week 2 maps still looking very hot.........on most models.
Overall, maybe a tad "not as hot" as our early close on Friday? But only because of the surprise cooling at the end of this week, which is temporary, not a pattern change.
Where will the dome be at the end of week 2???
Means everything to the key, high population centers that use up the most electricity for AC use generated by burning NG.
I'll guess a slightly lower open from the 1.750 close on Friday.
The EIA on Thursday was actually bullish but the increase in COVID is always a wild card.
Seasonals in July are extremely weak for ng.
Marvelous Monday to you! Here's your weather(HOT in week 2!): https://www.marketforum.com/forum/topic/55193/
Wonderful Wednesday to you! Here's your weather: https://www.marketforum.com/forum/topic/55329/
EIA is up Thursday at 9:30am.
The last one was bullish, the previous one very bearish.
Weather is still bullish after this interruption in the heat thru the weekend.
NG the cooler weather for several days has caused ng to pull back............actually, its more like not as hot weather.
NG weather is still bullish but other factors very bearish, so its hard to say how much higher the heat can take us.
This was the result of the last few EIA reports
| Jul 02, 2020 | 10:30 | 65B | 78B | 120B | |
| Jun 25, 2020 | 10:30 | 120B | 106B | 85B | |
| Jun 18, 2020 | 10:30 | 85B | 85B | 93B | |
| Jun 11, 2020 | 10:30 | 93B | 93B | 102B | |
| Jun 04, 2020 | 10:30 | 102B | 110B | 109B | |
| May 28, 2020 | 10:30 | 109B | 107B | 81B |
7 day temps from last Thursday's report:
Early last week comment: Warmer where most of the people live and cooler where they don't, so the injection will not be so huge.
7 day temps for this Thursday's report:
Much more heat in some of the high population areas vs the last couple of weeks, so the injection will be lower than last week by double digits.
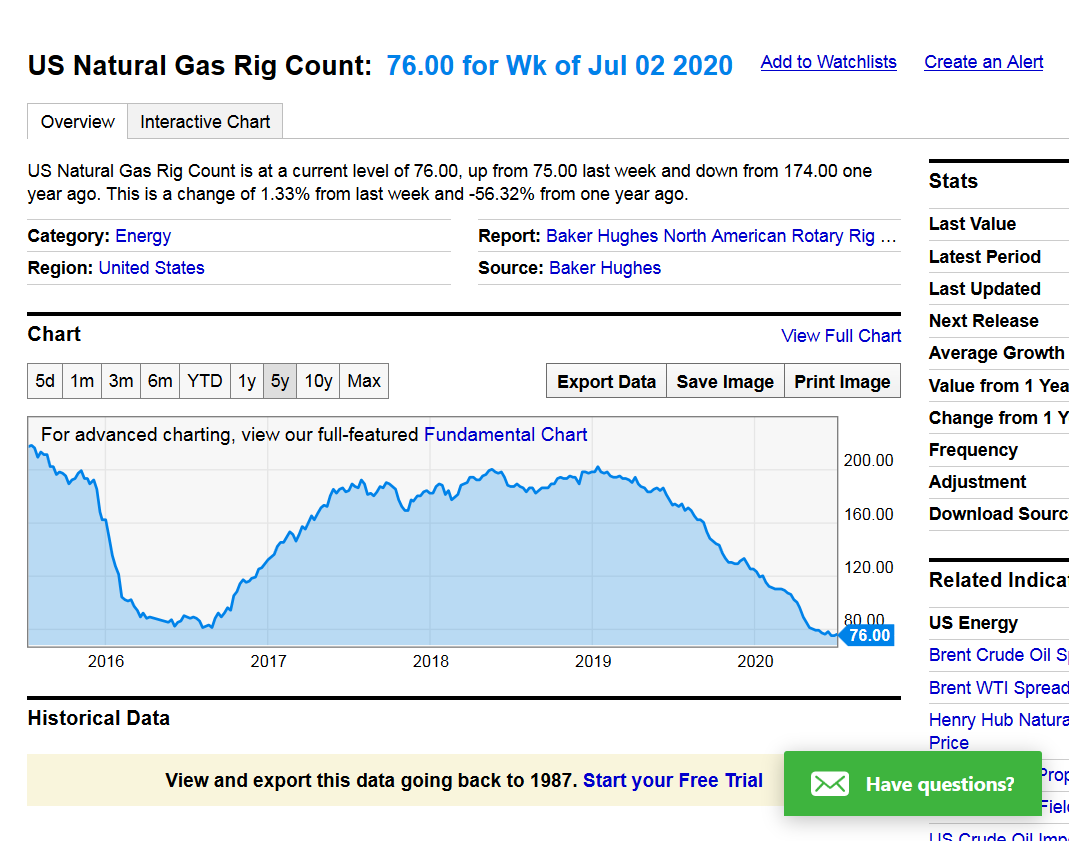
76 rigs are the lowest in history outside of the 75 the week prior.
One would think that this will be having an affect on supply pretty soon, to help offset the losses in industrial demand and exports plunging.
https://ycharts.com/indicators/us_gas_rotary_rigs
10 Rigs active and I have 1.
Waiting on May NDIC Directors cut for May info on production and shut ins. Next week.
Speculation is 1M Bbls per day produced in May down from high of 1.5M in Nov 2019.
Big news up here is Judge Boesberg, Fed Court of Washington DC and a FISC Court Judge, handed down an order to shut in / empty DAPL pipeline (600K Bbls per D capacity). DAPL was in preliminary stage of expansion.
https://oilpatchhotline.com/nd-fighting-back-against-adverse-dakota-access-ruling/
Energy Transfer Partners, managing owner, has given no indication todate it will comply with order. Still allocating August capacity.
Pipelines have become a soft target. See Dominion/ Duke cancellation of Atlantic.
Thanks very much for the update Joe!
![]()
for week ending July 3, 2020 | Released: July 9, 2020 at 10:30 a.m. | Next Release: July 16, 2020
+ 56 BCF Neutral Working gas in underground storage, Lower 48 states Summary text
Working gas in storage was 3,133 Bcf as of Friday, July 3, 2020, according to EIA estimates. This represents a net increase of 56 Bcf from the previous week. Stocks were 685 Bcf higher than last year at this time and 454 Bcf above the five-year average of 2,679 Bcf. At 3,133 Bcf, total working gas is within the five-year historical range.
For information on sampling error in this report, see Estimated Measures of Sampling Variability table below.
Note: The shaded area indicates the range between the historical minimum and maximum values for the weekly series from 2015 through 2019. The dashed vertical lines indicate current and year-ago weekly periods.
| Release Date | Time | Actual | Forecast | Previous | |
|---|---|---|---|---|---|
| Jul 09, 2020 | 10:30 | 56B | 58B | 65B | |
| Jul 02, 2020 | 10:30 | 65B | 78B | 120B | |
| Jun 25, 2020 | 10:30 | 120B | 106B | 85B | |
| Jun 18, 2020 | 10:30 | 85B | 85B | 93B | |
| Jun 11, 2020 | 10:30 | 93B | 93B | 102B | |
| Jun 04, 2020 | 10:30 | 102B | 110B | 109B |
By Kevin Dobbs Natural Gas Intelligence
July 9, 2020
The U.S. Energy Information Administration (EIA) reported an injection of 56 Bcf into natural gas storage for the week ending July 3, coming in slightly below average estimates and nudging Nymex natural gas futures lower. Analysts said the latest injection signals that demand, boosted by scorching summer heat that is driving energy use for cooling,…
metmike: I thought the injection could come in even lower after last weeks bullish number and will guess that many in the market thought so too.............so NG is getting hit pretty hard, now below 1.8
Also, fundamentals are pretty bearish and the upcoming heat which caused some huge short covering is no longer NEW news, even if it is bullish and can be MORE bullish, the longer that it lasts.
Seasonals in July are very weak for natural gas without extreme heat.
We have extreme heat though, so I, personally will not be short here until we see cooler temps
Thanks for another Thursday! Here's your weather: https://www.marketforum.com/forum/topic/55461/
A slightly bullish storage print and ongoing expectations for strong cooling demand proved too little to offset skepticism about excess supply, export weakness and ongoing fallout from the coronavirus pandemic. The August Nymex contract lost 4.5 cents day/day and settled at $1.779/MMBtu on Thursday. September fell 5.5 cents to $1.821. Boosted by waves of summer…
By Kevin Dobbs
July 9, 2020
With the amount of heat coming still very impressive, you would think that amount of bullish weather would be enough to at least support us and battle the negative price factors.
However, the heat has been on the models and in the forecast for weeks now.
Speculators control the price most of the time on most days. Many of them -large funds-decided to do some major short covering in late June and net buying because of change to much hotter July forecasts.
The heat can always last longer than expected or be greater and become more bullish but at this point in time, fresh buying/short covering may be harder to come by because the buyers that bought the first time are either already long and covered their shorts based on this forecast.
We may have more that want to buy on the same forecast lasting longer or if we drop to lower levels but its not conceivable that we can add as much heat to the forecast as we did in late June, start of July.........its already almost as hot as it can get for the hottest time of year(for this particular weather pattern over non drought soils).
Later this month, average temperatures start falling, so we will be battling that too and its possible the market is looking ahead that far.
It's also possible that today's price drop was just a correction and if the maps feature a mega dome with widespread heat next week that lasts longer.........speculators will be aggressive buyers again. In this environment, prices don't usually equate to the true value of ng.
It only matters on any one day, if people think the price is going higher or lower. The more that think higher...on that day, the bigger the spike higher will be that day and vice versa.
Figgity Diggity Friday!
Still plenty of heat in the forecast, really picking up/spreading to some of the high populations centers next week............but similar to previous days forecasts.
Big bullish turnaround today after a bearish start from the low of 1.737 (-4.2 cents) at 7:15 AM EDT to the high of 1.835 (+5.6 cents) at 10:38 AM EDT. The lion's share of the buying was from 8 AM til 9:10 AM. It had nothing to do with the 0Z/6Z models being hotter as they actually were very similar to the 12Z runs of yesterday and had already been out awhile. The 0Z EPS was even 2 CDD cooler. And it had nothing to do with hotter forecasts as the Maxar 15 day forecast was 3 CDD cooler than yesterday.
So what caused this? The rise imo had everything to do with the fact that:
1) The current 15 day forecast (based on US pop. weighted CDDs), using Maxar as my reference, is not just hot, it is THE hottest for 7/10-24 on record back to 1950 and with no clearcut end in sight to the heat even on day 15! And that's after it cooled 2 CDD. That equates to a very impressive (after adjustment to NOAA estimates) 92 CDD for the EIA week starting today and 104 CDD for the EIA week starting one week from today! The current record is 105 CDD set in both 2006 and 2016. Both of those weeks actually had extremely rare small summer draws. Whereas the weeks preceding the draw in 2016 had a tighter balance vs 2020, 2006 was fairly comparable to 2020. So, a draw wouldn't be impossible.
The current EIA week looks to be near 88 CDD, which itself is easily the hottest so far this season
2) Although the EIA yesterday was neutral, NG pulled back quite a bit yesterday and NG is still historically cheap. So, it bouncing back, especially ahead of a weekend, isn't surprising with the oncoming historic heat.
3) The Dow was up nicely today, which may have given it an extra boost.
Terrific analysis as usual Larry!
The heat coming up is sprawled out across most of the country, including high population areas where the ACs will be cranked up using electricity generated from burning natural gas........which is helping to maximize those cumulative CDDs.
Regardless of cuts in industrial demand or LP exports, residential demand will not suffer. If anything, more people at home means an increase in residential demand.
So we are assured of some small/bullish injection numbers coming up for the rest of the month.
Splendid Saturday to you! Here's your weather(not as much heat for ng):
From the link below on Saturday ;On Friday, late week 2 maps backed the dome up slightly and allowed for some northwest flow but the European model was still pretty bullish. Dome should be centered in the S.Plains. This less hot trend has continued with the GFS ensemble CDD's dropping by 10 in the last day. NG weather less bullish today.
Despite these trends, there will be a mega dome, centered in the S.Plains which could expand north or east later this month.............and the models just don't realize it yet.(actually a few, minority solutions have this idea)
The 12Z EPS of course hasn’t even started yet, but based on the 12Z GEFS and 0Z EPS, I wouldn’t want to be long NG right now. (I’m flat as usual.) If I get a chance before the open, I’ll give the 12Z Sun vs 12Z Fri modeled CDD changes.
Big agreement here Larry!
Not totally a shock when the pattern had become about as bullish as possible.........and had almost no room to get hotter but plenty of room to get cooler.
Funny thing about market perspective and the RELATIVE view.
If we had been very cool and the forecast was bearish, with prices dropping earlier this month THEN had these exact same weather maps, NG would gap higher on the open because it would be so MUCH hotter from cool to hot.
But instead, on Friday, we had really hot and we've dropped down to just hot.
+++++++++++++++++++++++++++++++++++++++++
I am also flat but toyed with the idea of buying in the last hour on Friday based on a set up from the market that suggested many were expecting a potential gap higher on Sunday Night.
And the outlooks for sustained widespread heat.
Honestly, the -AO and -NAO and tendency for those situations to result in models and weather morphing cooler in the Midwest/East under that situation that I discussed here was the main reason to refrain.
"Friday: -AO, -NAO(bring the risk for cooler air to push farther south into the Midwest) but increasing to 0 at the end of 2 weeks. +PNA decreasing to near 0 at the end of 2 weeks.
Saturday: -AO/-NAO favor less heat than the models predict in the Northern Tier. +PNA drops to near 0 late."
By metmike - July 10, 2020, 4:14 p.m.
" Best post ever Dave!
Just to add a few things.
It's tough to generate 100 degree heat until you dry the soils out first. With moist soils, alot of the heating energy goes into evaporation. Once we dry things out in the South, temperatures can really get going higher with this same pattern.
Also, in the Summer, the AO/NAO/PNA, being more northern stream indicators usually don' t matter as much Winter. However, with regards to the trough and cold front next week, we will have a -AO and -NAO, along with a +PNA which is favorable for cold fronts to make good penetration in the Midwest.
This doesn't mean its going to happen but the latest guidance continues in that direction(which often happens when you have these indices pointed in 1 direction-model updates more often than not go in that direction."
This is sort of bragging but is intended to provide the predictable reason(without me having to type it all over again) for why the models have been cooling things off the last few days.