Scroll way down for the latest update. A new thread will begin soon.
Covering up massive COVID being spread from protests-8/8 update below 23 responses |
Started by metmike - July 30, 2020, 7:28 p.m.
https://www.marketforum.com/forum/search/
July 11 update: The latest evidence below(scroll down), shows that the massive protesting is either a main factor or the biggest contributor in many states.
July: The new case numbers are soaring higher from opening things up(and lack of wearing masks in some places....... and massive protesting with no social distancing.
Much of the increase has also come from the quadruple number of tests compared to 2 months ago.
Deaths so far, have not increased like this but there is a 2 week lag in time from testing positive to dying in many cases.
The previous coronavirus thread was getting excessively long, so we've started another new one.
See the previous COVID tracking posts below:
Tracking COVID-19 #4 Jul 3, 2020
64 responses |
Started by metmike - May 16, 2020, 12:12 p.m.
https://www.marketforum.com/forum/topic/52243/
++++++++++++++++++++++++++++++++++++++++
Tracking COVID-19 #3 THU
52 responses |
Started by metmike - April 20, 2020, 12:48 p.m.
https://www.marketforum.com/forum/topic/50858/
++++++++++++++++++++++++++++++++++++++++++++
Tracking the Coronavirus#2-SUN
45 responses |
Started by metmike - April 1, 2020, 1:26 p.m.
https://www.marketforum.com/forum/topic/49863/
++++++++++++++++++++++++++++++++++++++++++++++++++++++
*Tracking the Coronavirus-TUE#'s at the bottom-rate slowing down a bit?
41 responses |
Started by metmike - March 14, 2020, 11:49 a.m.
https://www.marketforum.com/forum/topic/48892/
+++++++++++++++++++++++++++++++++++++++++++++++++++++++++++++++++++++++++++++++++
These were the last several posts from the previous thread:
By metmike - July 2, 2020, 10:14 p.m.
New daily positives with the much higher rate of testing and opening up.............and widespread protesting with no social distancing have been going up the last 2 weeks. Possibly, over half of this is from the increase in testing. Some is surely from opening up and poor habits/lack of precautions and some from the protests.
Deaths had been going down steadily for 2 months but could be turning higher. The next 2 weeks will tell us a great deal(the time lag between testing positive and dying in many cases).
Find this data here: https://coronavirus.1point3acres.com/en
Daily new infection cases in zig zag blue below. Cumulative new cases in orange on graph 1.
On graph 2, deaths in zig zag purple. Totals deaths in red..png)
++++++++++++++++++++++++++++++++++++++++++++++++
By wxdavid - July 2, 2020, 10:19 p.m.
MIke come on man...
the data is clear.... the BLM protesting had NO impact at all on the rising Covid 19 cases in the conservative southern ignore science states. In fact there very few if any significant BLM protests in GA SC NC FL TX AZ LA MO TN AL
https://apnews.com/a7acb77702b740cfb17d84023482417a
or here
https://www.kqed.org/science/1966378/no-coronavirus-spike-from-black-lives-matter-protests-experts-say
+++++++++++++++++++++++++++++++++++++++++++++++++
By metmike - July 3, 2020, 12:16 a.m.
Right Dave,
The most contagious virus in our lifetime with a million people, often packed together for long periods but most of them wearing masks and there was no spread of the virus?
Fortunately the science is telling us that its much harder to spread the virus outdoors vs indoors and this was a great real life laboratory experiment with the protestors as the guinea pigs.
When I attended a local BLM protest last month, I wore an N-95 mask. Every body there had masks. There were around 300 people there.
They took them off to speak in to the microphone but that was about the only time.
I was not worried about getting COVID, for numerous reasons.......outdoors........ people wore masks and we have very low numbers in this county of Indiana.
I have not been wearing a mask to when going to the store because I don't have it and numbers are so low here.
However, when I go to visit my Dad in Detroit in a month, I will be wearing a mask EVERYWHERE that I go because COVID cases are so much higher.
In his county Wayne county, during April cases were so high that they were coming in higher than 41 entire states..........just that one county.
++++++++++++++++++++++++++++++++++++++++++++++++++++++
By TimNew - July 3, 2020, 6:10 a.m.
I don't know about the rest of those states, 1st hand, but anyone who says there are no BLM or assorted other protests in Atlanta Ga is obviously not paying attention. I'll leave the rest of my comments to your imagination,
+++++++++++++++++++++++++++++++++++++++
By metmike - July 3, 2020, 1:39 p.m.
Good point Tim!
Let's put wxdavid's superior science to the test.
Dave: "ignore science states. In fact there very few if any significant BLM protests in GA SC NC FL TX AZ LA MO TN AL"
metmike: Checking the actual data, I found protests in cities of each state listed by Dave, with the number of cities listed . Actual protest numbers are much higher because many of these cities feature ongoing protests-more than 1 protest:
GA-15 cities
SC-9 cities
NC-15 cities
FL-29 cities
TX-25 cities
AZ-10 cities
LA-7 cities
MO-7 cities
TN-6 cities
AL-11 cities
That would be 135 cities where significant protests are being held in the 10 states that Dave said this about: "there very few if any significant BLM protests"
Many of those cities have been having numerous protests.
https://en.wikipedia.org/wiki/List_of_George_Floyd_protests_in_the_United_States
+++++++++++++++++++++++++++++++++++++++
By metmike - July 3, 2020, 1:49 p.m.
New reports: COVID-19 cases rising fastest among minorities, young people
"One report, by the Bellevue-based Institute for Disease Modeling, examined the ages of people becoming infected by the coronavirus pandemic. It found that people under age 35 represented 22% of cases from January to March, but by May and June that younger population represented 46 percent of cases.
That report also found that infection rates are rising faster among communities of color than among the white population"
metmike: What a strange coincidence. That's EXACTLY the age and racial distribution of the protesters!
++++++++++++++++++++++++++++++++++++++++++++++++++
By metmike - July 3, 2020, 2:03 p.m.
For people to think that a million protesters can be smashed together for long periods during the pandemic with the most contagious virus in our life time rampant and only need for most of them to wear masks for hardly anyone to get COVID is not using critical thinking.
Trumps rally in OK was really, really, really dumb, especially with very few people wearing masks(add a few more really's because of that).
Out of 6,000 people that showed up, certainly some had COVID(maybe none of them knew it) and for sure others sitting by them got it from them.
Let's just say that less than 1% had COVID, hypothetical very conservative number of 30.
Out of those 30, many could have been contagious and some super carriers. So they could have easily spread it to 100+ other people(again, being conservative because the numbers could have been much higher).
Out of those 100 that get/got it, they will then spread it to hundreds of others after the rally...........and its out of control. Some of those people will die.
With the protests, wearing a mask makes it much safer(small risk) but not completely safe. You are multiplying the rally numbers by 200!
If you have a small number and multiply it by a big enough number............that number becomes BIG!
The people exposed to COVID from the protests was a big number.
++++++++++++++++++++++++++++++++++++++++
By TimNew - July 3, 2020, 6:57 p.m.
We see reports of dozens, even hundreds getting positive results from a bar in Kalamazoo. Wouldn't the press be all over incidents resulting from a Trump rally? Weird Huh?
New daily positives with the much higher rate of testing and opening up.............and widespread protesting with no social distancing have been going up the last 2+ weeks. Possibly, over half of this is from the increase in testing. Some is surely from opening up and poor habits/lack of precautions and some from the protests.
Deaths had been going down steadily for 2 months but could be turning higher soon. The next 2 weeks will tell us a great deal(the time lag between testing positive and dying in many cases).
Find this data here: https://coronavirus.1point3acres.com/en
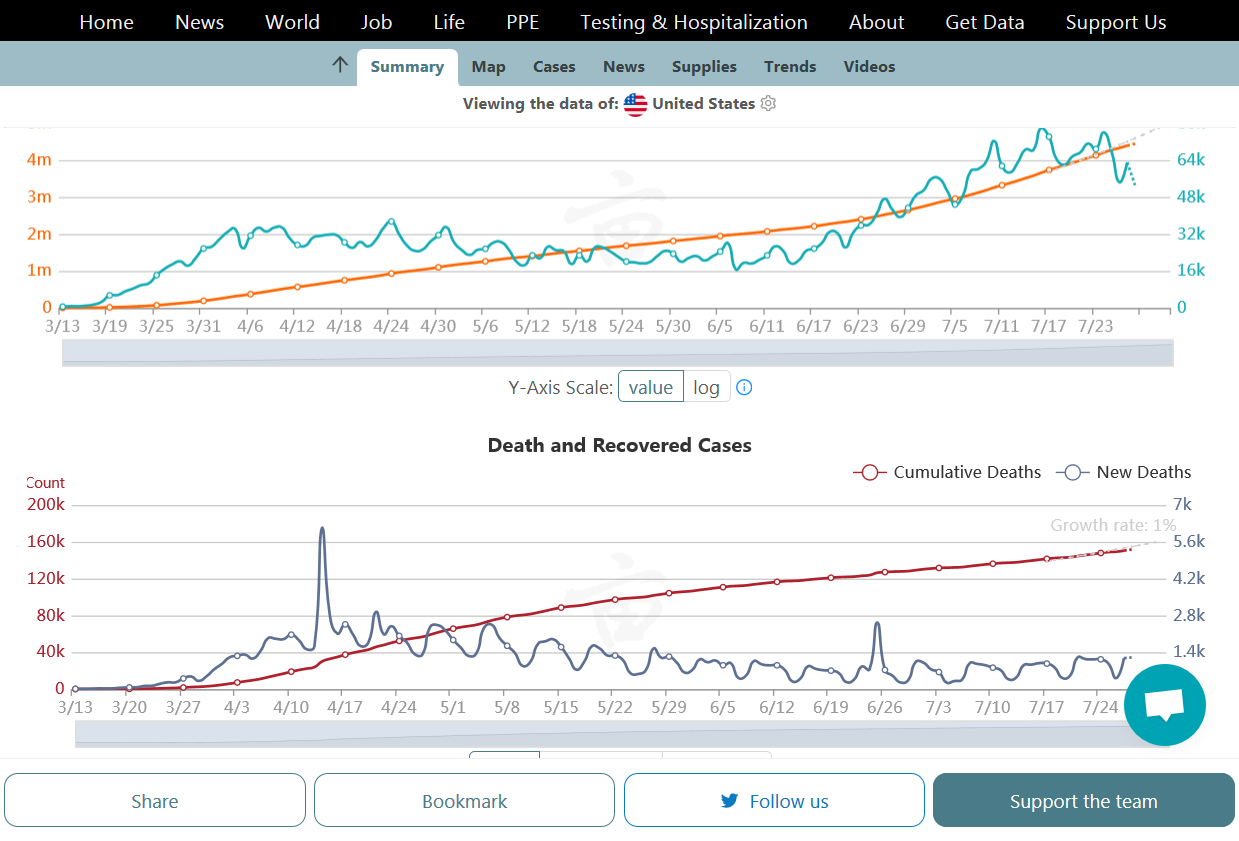
Daily new infection cases in zig zag blue below. Cumulative new cases in orange on graph 1.
On graph 2, deaths in zig zag purple. Totals deaths in red.
New daily positives with the much higher rate of testing and opening up.............and widespread protesting with no social distancing have been going up the last 2+ weeks. Possibly, over half of this is from the increase in testing. Some is surely from opening up and poor habits/lack of precautions and some from the protests.
Deaths had been going down steadily for 2 months but could be turning higher soon. The next 2 weeks will tell us a great deal(the time lag between testing positive and dying in many cases).
Find this data here: https://coronavirus.1point3acres.com/en
Daily new infection cases in zig zag blue below. Cumulative new cases in orange on graph 1.
On graph 2, deaths in zig zag purple. Totals deaths in red.
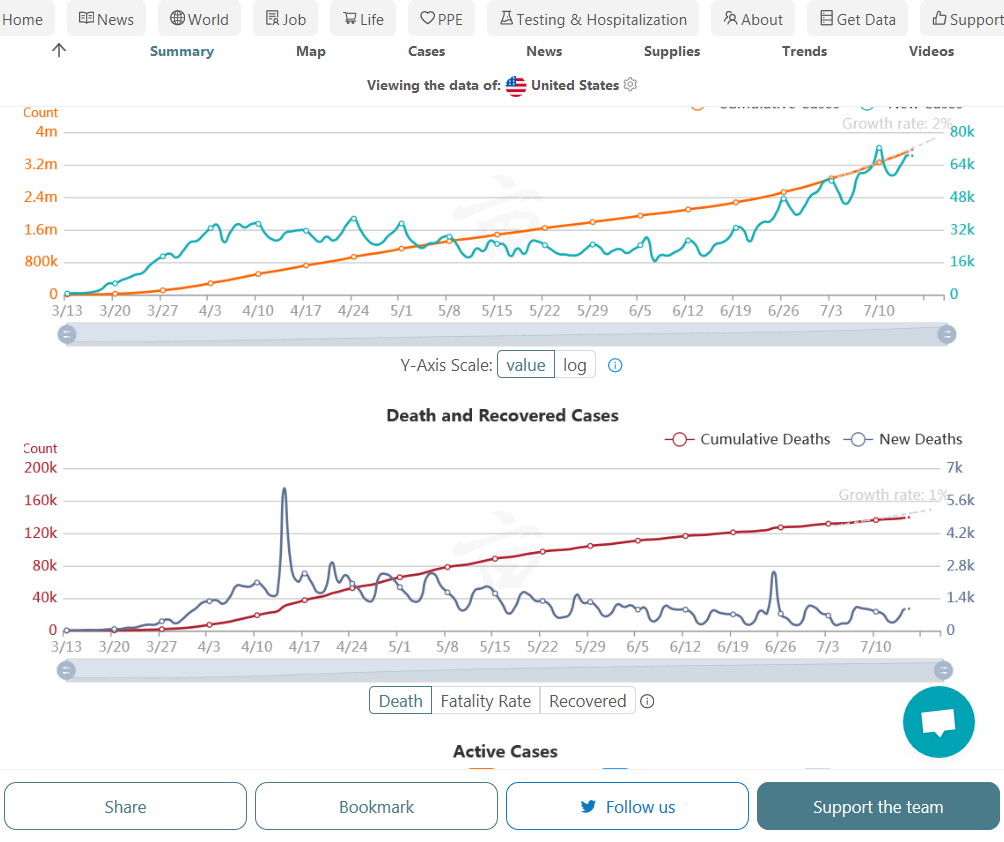
New daily positives with the much higher rate of testing and opening up.............and widespread protesting with no social distancing have been going up the last 2+ weeks. Possibly, over half of this is from the increase in testing. Some is surely from opening up and poor habits/lack of precautions and some from the protests.
Deaths had been going down steadily for 2 months but could be turning higher soon. The next 2 weeks will tell us a great deal(the time lag between testing positive and dying in many cases). Deaths STILL NOT GOING HIGHER!
Find this data here: https://coronavirus.1point3acres.com/en
Daily new infection cases in zig zag blue below. Cumulative new cases in orange on graph 1.
On graph 2, deaths in zig zag purple. Totals deaths in red.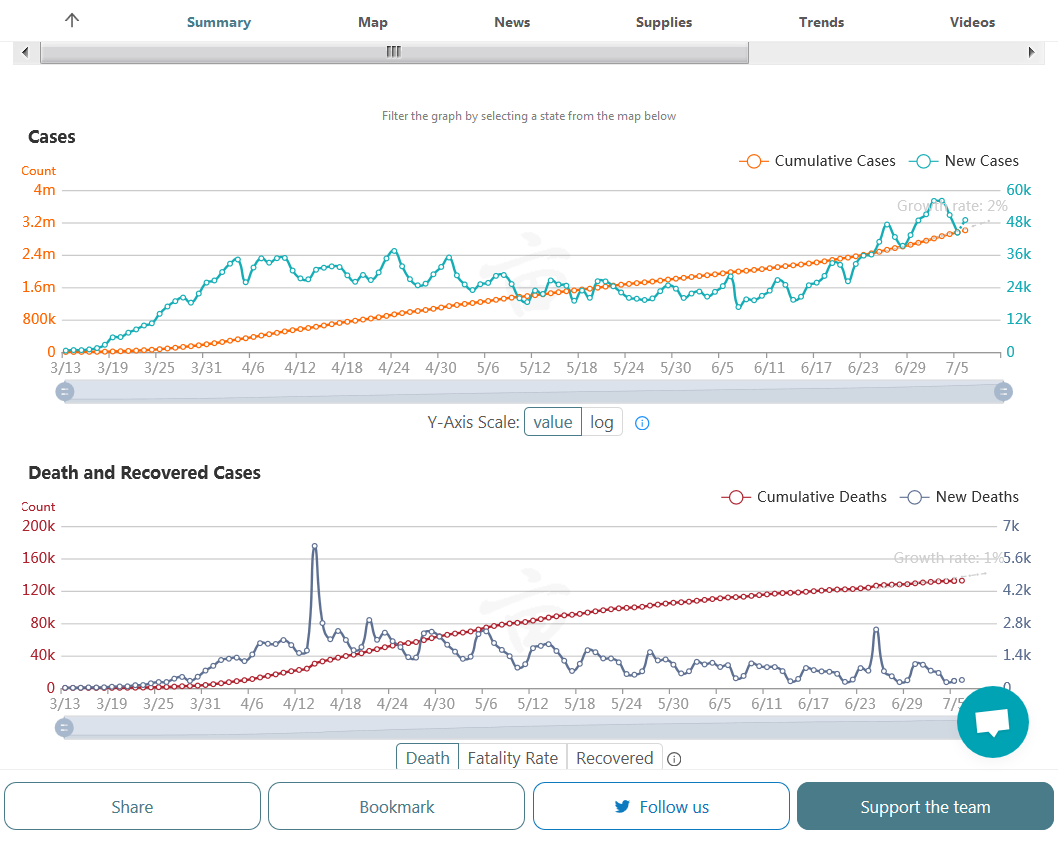
New daily positives with the much higher rate of testing and opening up.............and widespread protesting with no social distancing have been going up the last 3 weeks. Possibly, over half of this is from the increase in testing. Some is surely from opening up and poor habits/lack of precautions and some from the protests.
Deaths had been going down steadily for 2 months but could be turning higher soon. The next 2 weeks will tell us a great deal(the time lag between testing positive and dying in many cases).
Find this data here: https://coronavirus.1point3acres.com/en
Daily new infection cases in zig zag blue below. Cumulative new cases in orange on graph 1.
On graph 2, deaths in zig zag purple. Totals deaths in red.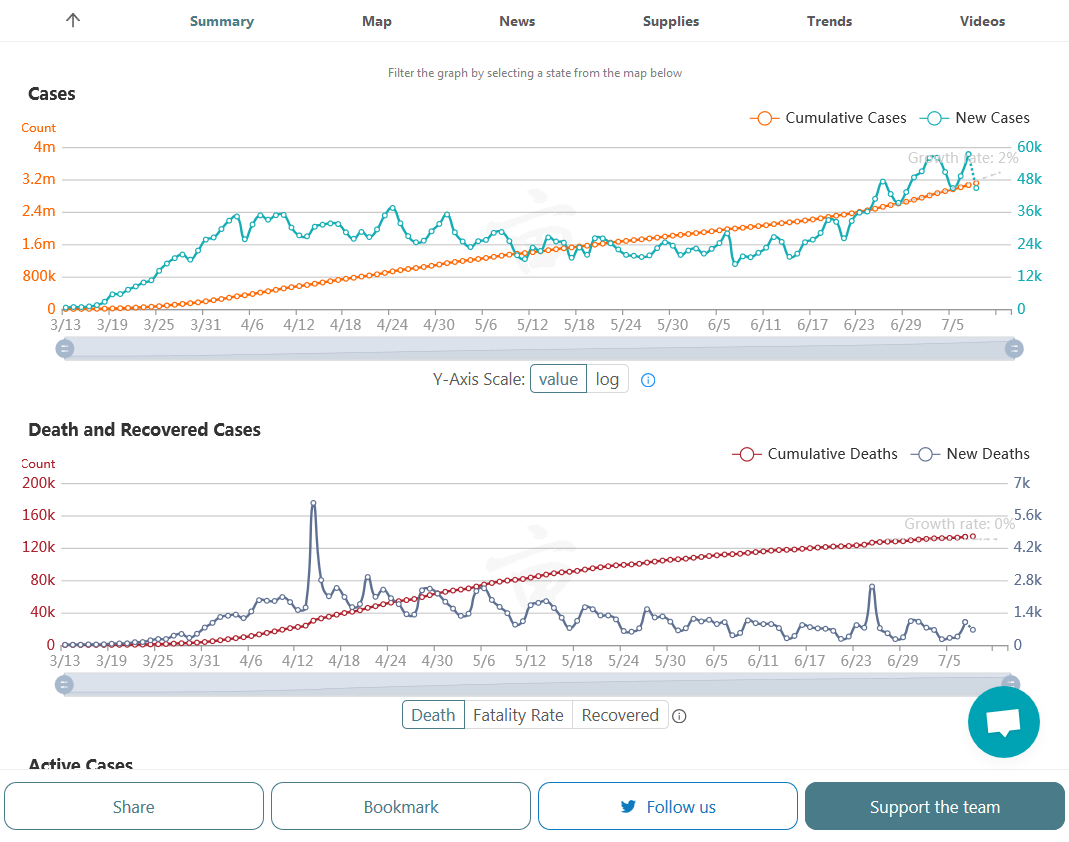
_YxBPK6U.png)
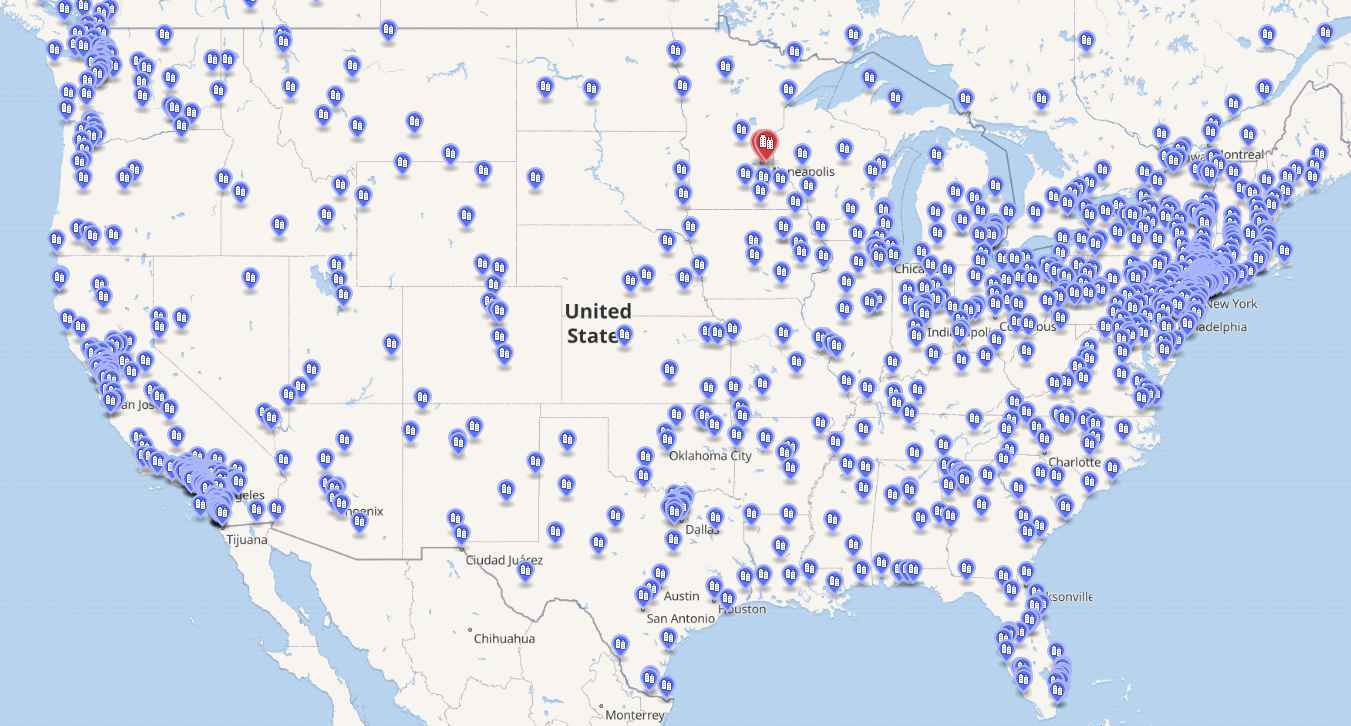
Mike that map you have posted clearly shows that the vast majority of the protests were in the northern states.
And that's exactly where there has not been a massive outbreak in coronavirus cases.
I know this is a problem for you Mike. And I am sorry. And you can keep arguing until you're blue in the face that all the social protesting in the NORTHERN STATES is what is causing the outbreaks in the cases in the southern states.
Of course the data shows your data shows that is not the case at all.
The only reason you are maintaining that the social protesting has led to an explosion of cases is because of your politics. The data clearly shows that in the areas where they are very high numerous frequent social protesting NY PA NJ MO OH ILL IND VA MASS CT WI MN -there has not been anything close to the explosive growth we have seen in the southern states.

USA LIKELY TO HIT 100,000 cases in next 5 days !!!
VA VS NC .... Here in Old Virginny..... the differences are Massive. Firrt we had a lot more protest than NC did... I mean here in Richnind we had 30 straight days of protest around these vile CSA statues. 3 weeks ago BC was 13 000 cases BEHIND Virginia . Now NC is 10000+ cases ahead .
the difference? VA we were shit down until JUNE 3 ... Northern VA to JUNE 10 .
Virginia is one of 10 states right now in PHASE 3
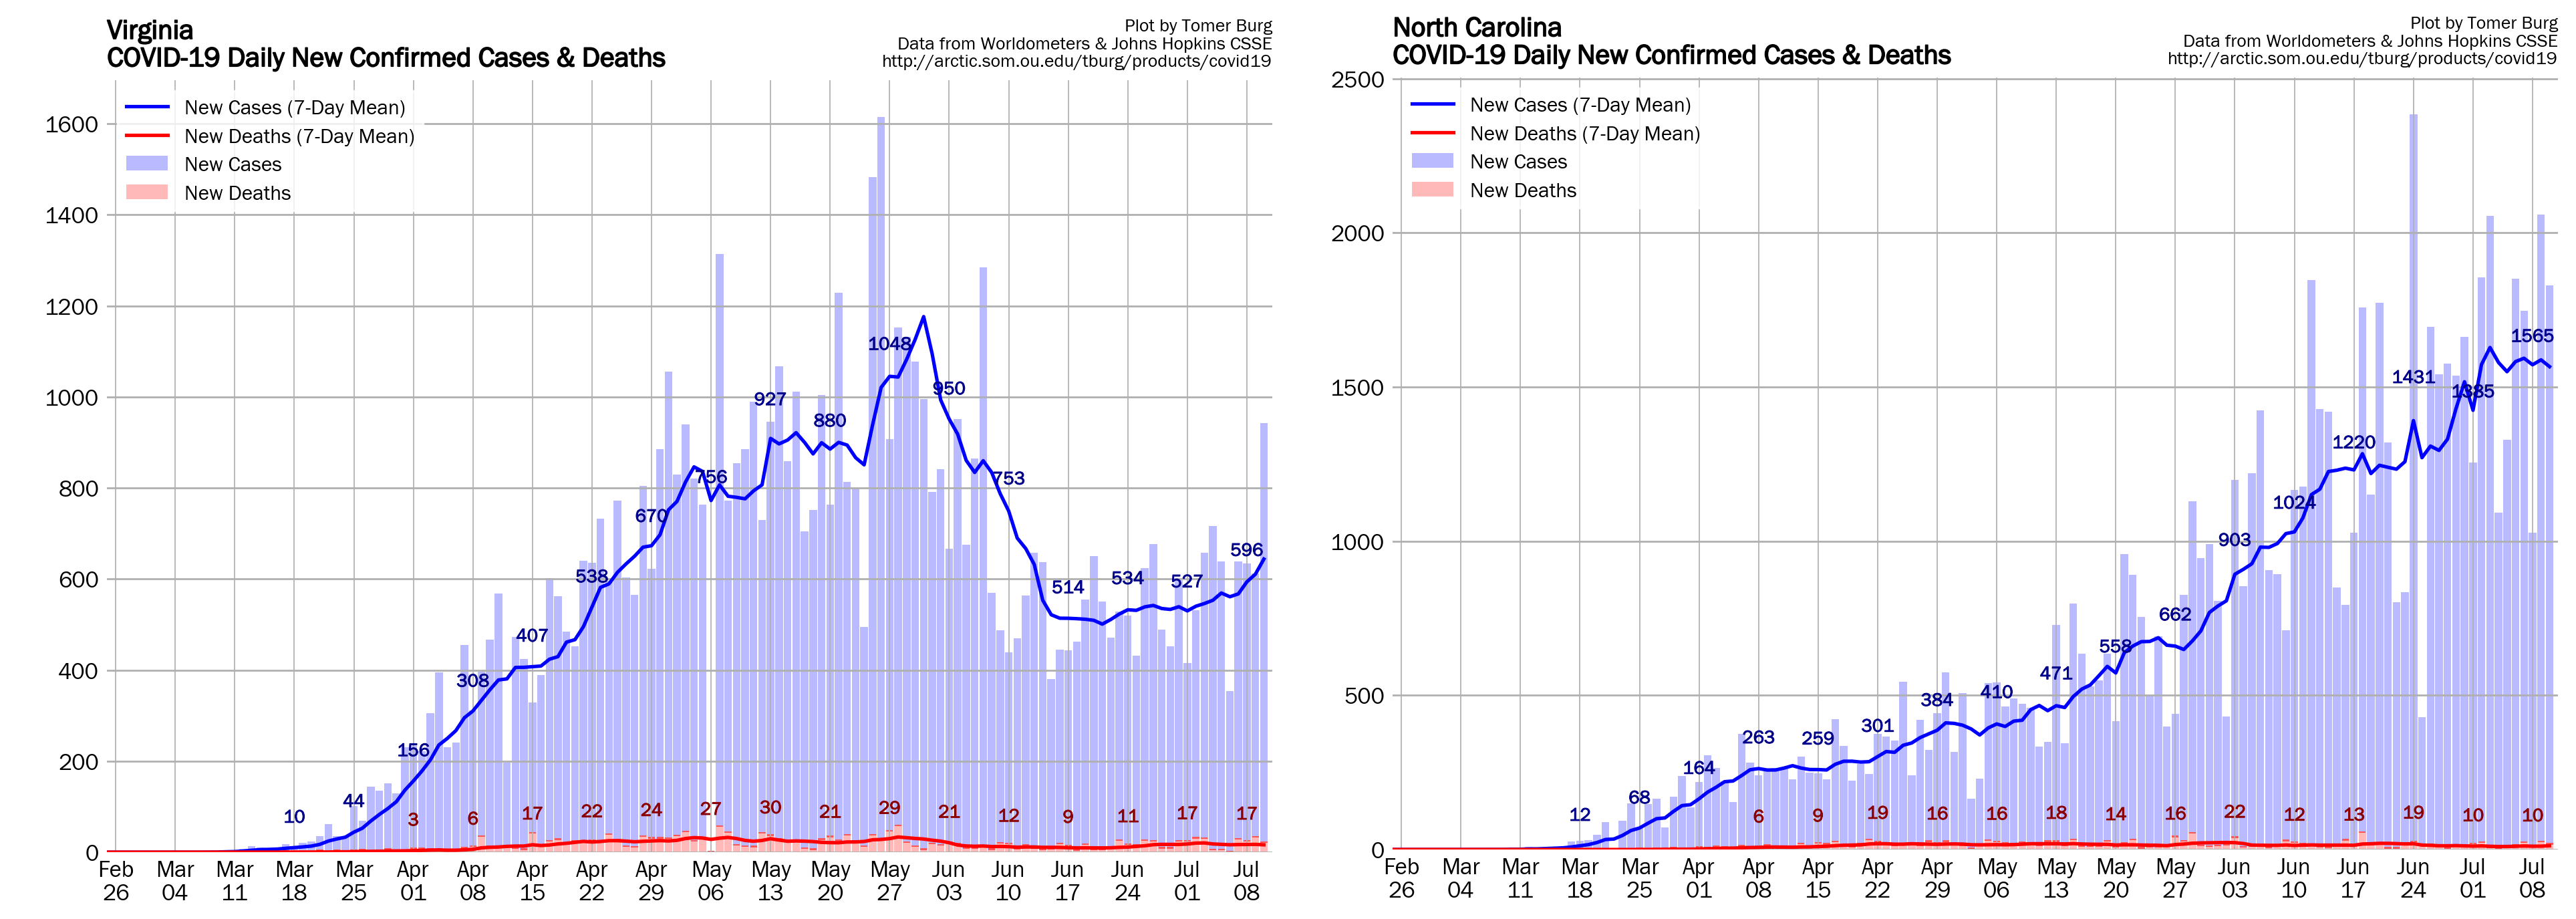
note that in these northern states even though they had massive numbers of social protesting police brutality for days and days if not weeks. And in numbers far greater than what we saw in the southern states. These northern states we have not seen anything like the explosive if not exponential growth in cases that we have seen in the southern states.
obviously there has been some cases where people who have been involved in the social protest have been infected and picked up the virus. Obviously that's true.
But it's simply not to the same degree because the population of the states as a whole have not been impacted.


SOUTHERN STATES ARE GETTING SLAMMED

Thanks Dave(or maybe not based on the objective analysis below)
You continue to mis characterize others statements, then use cherry picked, misleading data to show why that person is wrong in an intentionally deceptive way.
1. Dave says: "you can keep arguing until you're blue in the face that all the social protesting in the NORTHERN STATES is what is causing the outbreaks in the cases in the southern states."
2. metmike actually said: "Some is surely from opening up and poor habits/lack of precautions and some from the protests."
3. Dave said: "In fact there very few if any significant BLM protests in GA SC NC FL TX AZ LA MO TN AL"
4. metmike PROVED above(using DAVE's EXACT WORDS)
That would be 135 cities where significant protests are being held in the 10 states that Dave said this about: "there very few if any significant BLM protests"
Many of those cities have been having numerous protests.
5. THis one is where you show your true BIASED colors Dave and I'm disappointed in you for trying to pass this off as objective.
You outlined around a dozen high population states, which obviously have had the most protesting, then cherry picked the 4 states that had the highest peaks in the Spring to compare today's numbers with(where herd immunity is also becoming a factor) and completely left out others that showed the complete opposite of what you want to show.
California for instance(where rates have gone from less than 2,500 to over 8,000 and almost a 4 fold increase)
metmike:What makes this despicably deceptive, is this
https://www.sacbee.com/news/coronavirus/article244065197.html
I could make a very strong case that this is powerful evidence that this massive increase is mainly from protesting.
Same thing in OR rates up almost 4 times since the protests started
.png)
And from Washington(what a coincidence, the exact same age and racial profile of the protesters):
New reports: COVID-19 cases rising fastest among minorities, young people
6. In the Southern States, they are in fact having the highest rate of increase because of opening up and the significant protesting(at 135 cities). How much is from each factois impossible to know but its protester age and racial make up experiencing the HIGHEST increase is the same.
7. All these Southern states came from very low numbers, to start(THIS IS WHY THEY OPENED UP and the others with really high rates DID NOT OPEN UP) and with the highest % in the population vulnerable............including protesters that have been led to believe that wearing a mask,protects them, even in environments with no regards for social distancing with hundreds of thousands of REAL people in REAL protests smashed together during the most contagious pandemic in our lives.
8. Why didn't you show any of the many states that have had even LESS protesting, than the Southern States and OPENED up but did not have similar increases to those experienced in the South?
9. At least half of the new cases are from the increase in testing. You can't quadruple the testing from April and not measure many more cases that were not measured before.
10. You are a very clever guy Dave but you ran into the wrong person............a scientist armed with the objective data that sees exactly what you did to try to trick people that don't have the data.
11. Speaking of which, you were very critical of my views on climate change and I responded to you with a reality check and have asked you(4 previous times) a meteorologist to look over my 3 dozen posts on this (using authentic data) and tell me what I have wrong. Please give me examples of the crisis happening NOW in the REAL world, using objective, authentic data. You seem to have read all the other posts, so I know that you are not responding for a reason. You started it, with the attack on my position, so let's settle it with the authentic science between 2 meteorologists.
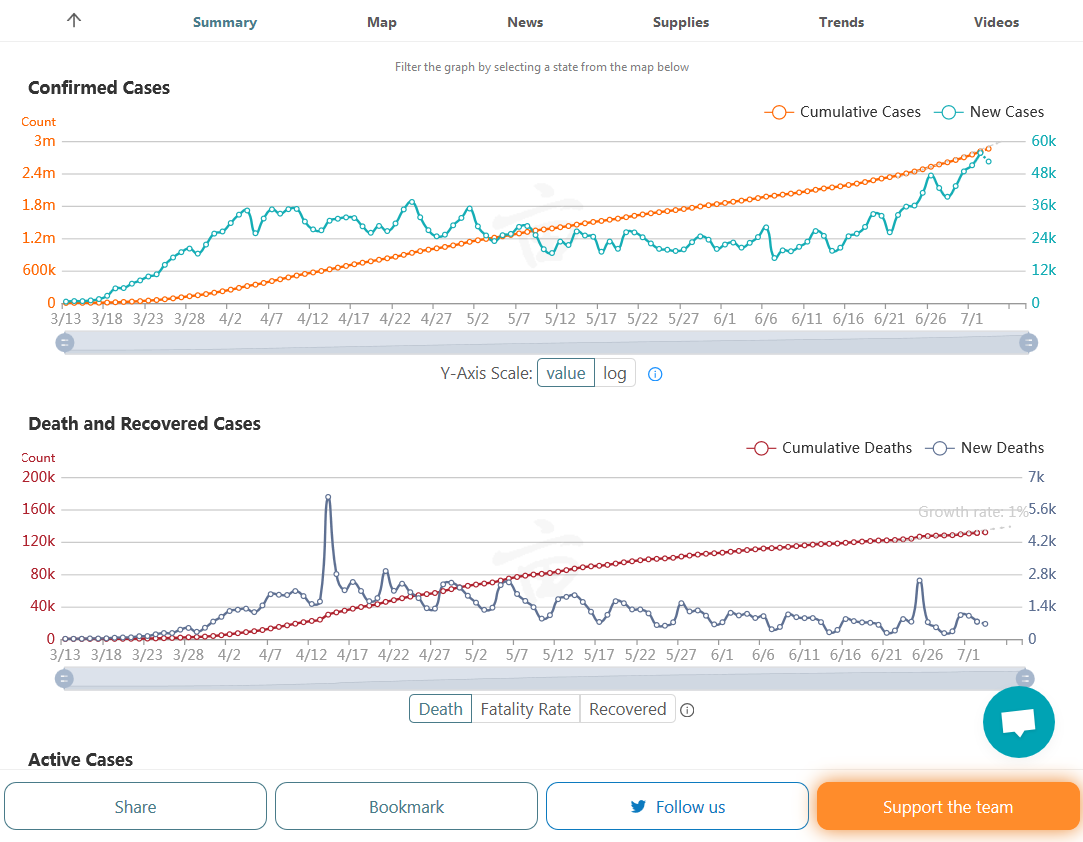
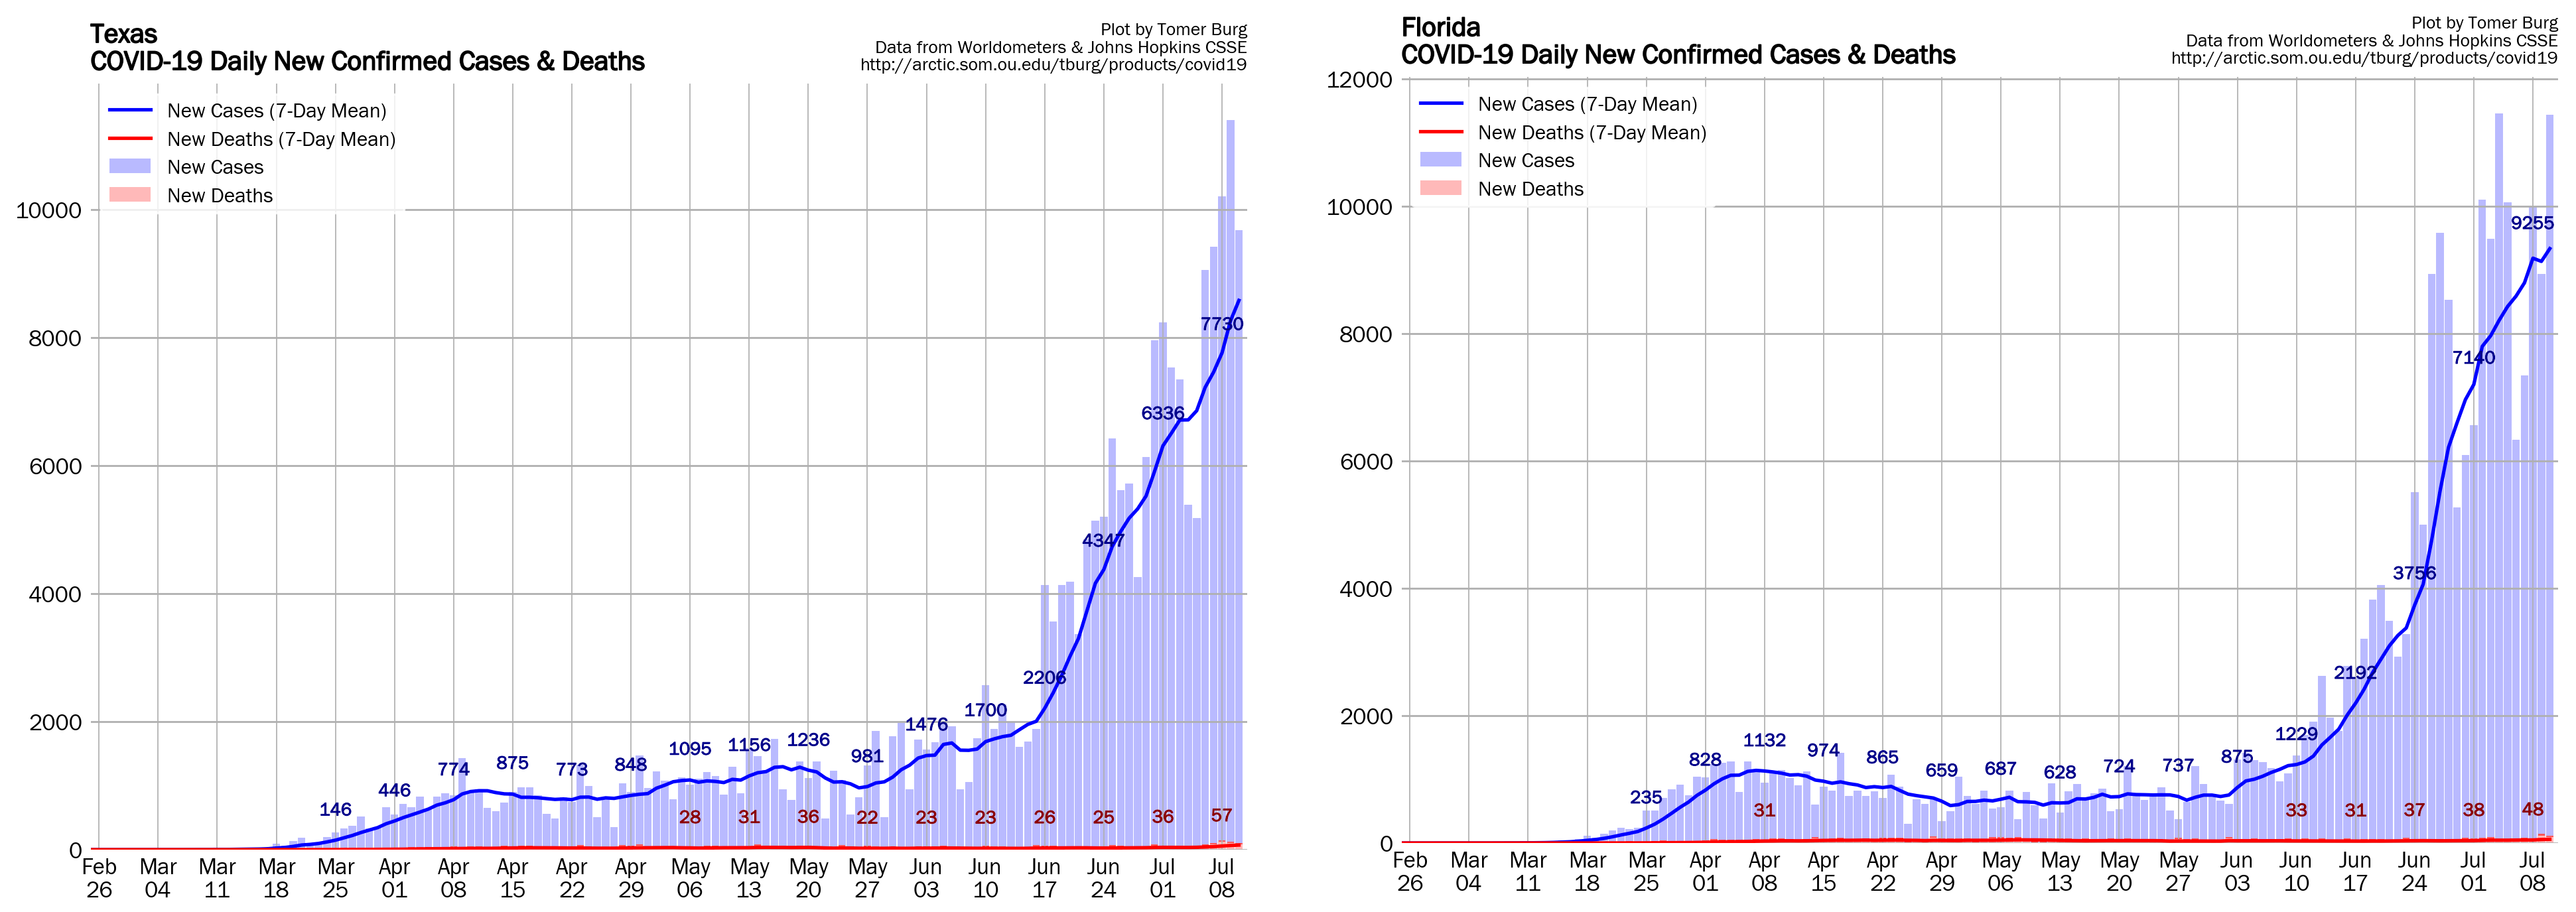
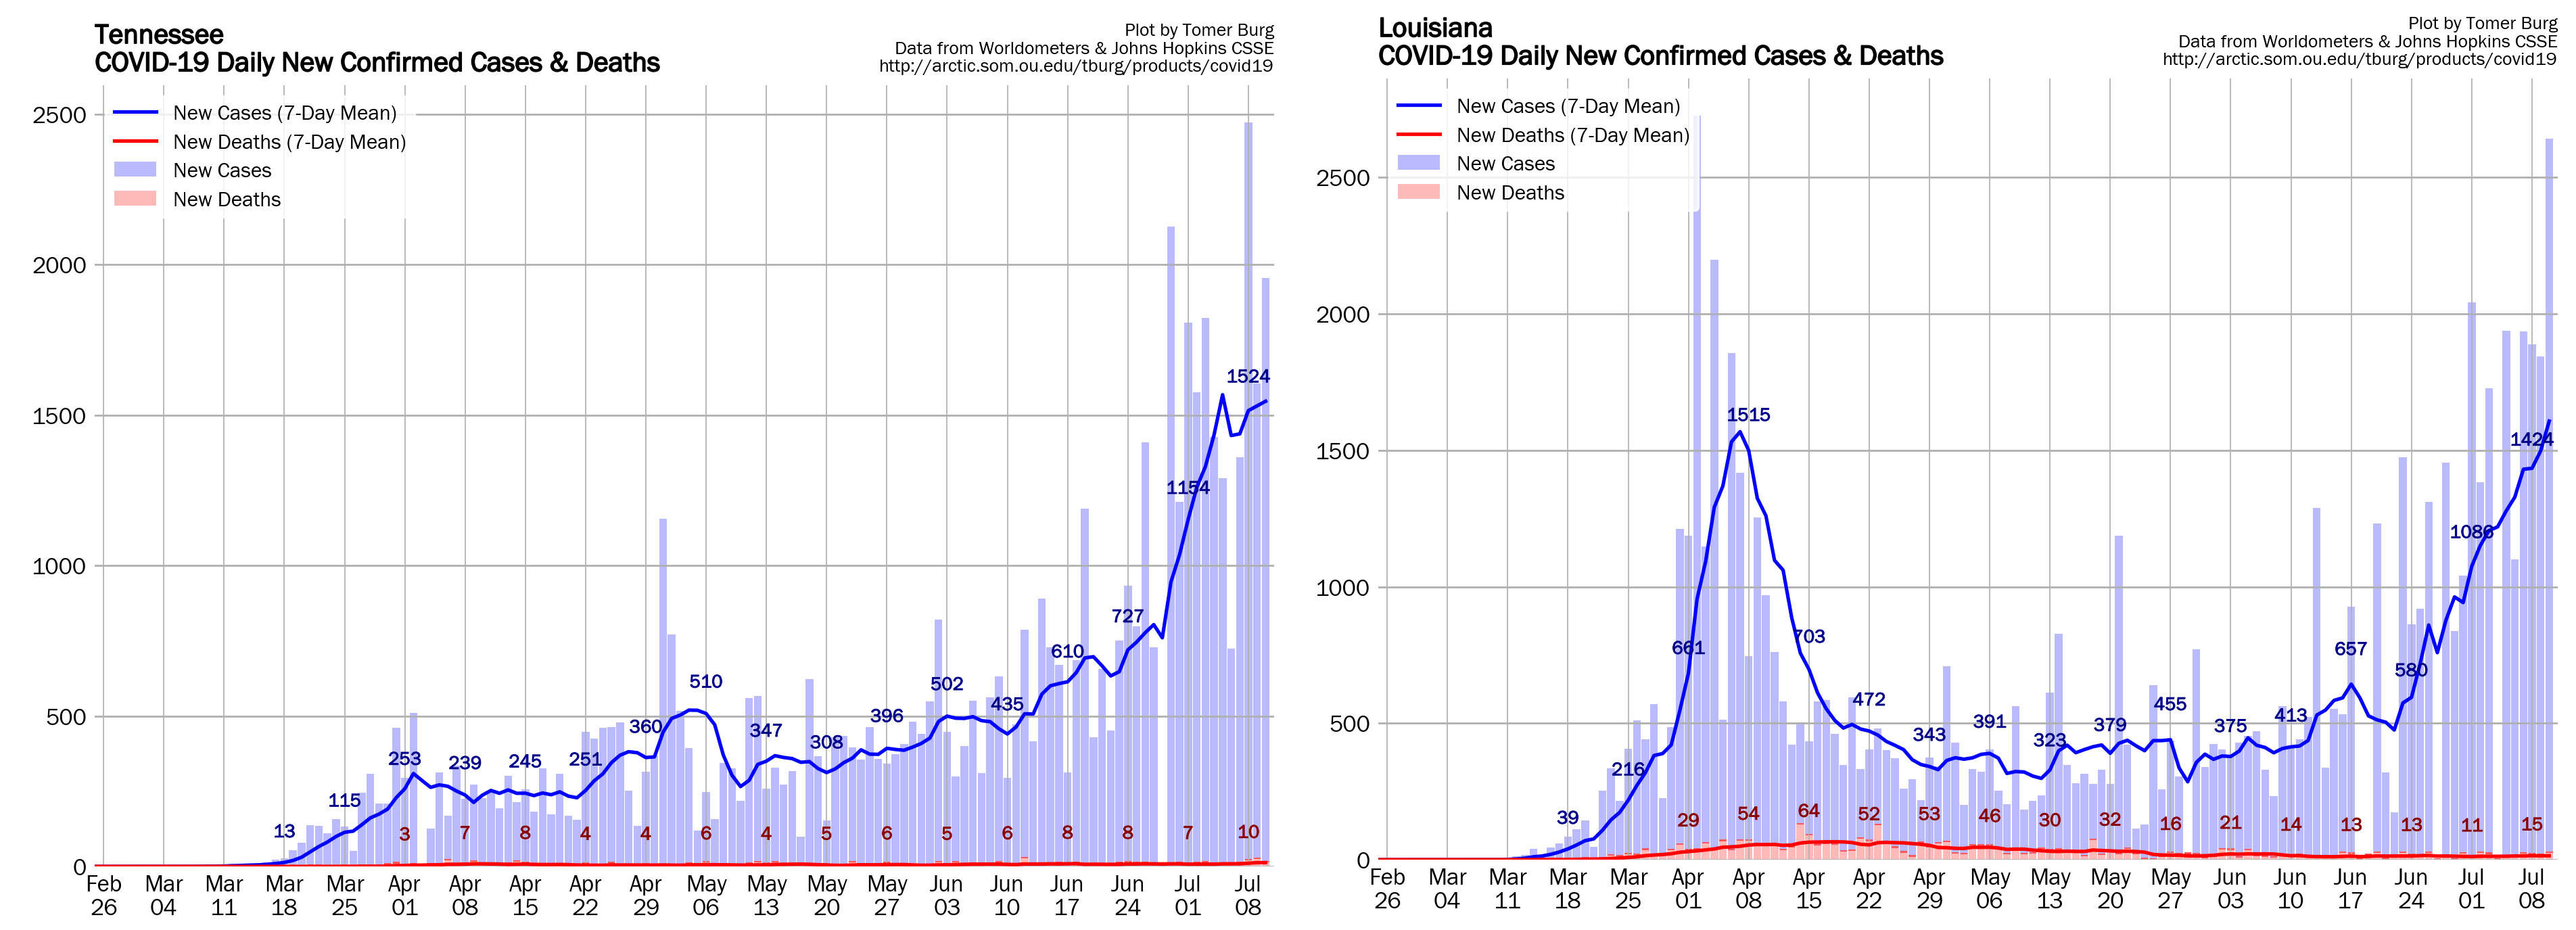
Tim started a thread on GA earlier, which caused me to look up their stats.............it shows an overwhelming profound LEGIT link to the big increase in protesting NO link to reopening.
How do we know that?
GA was the very first state to re open in late April, with much criticism, even from President Trump for opening up TOO SOON.
See the graph below: https://coronavirus.1point3acres.com/en
New cases actually went down more in May and were steady in early June, despite testing doubling(so the real rates were much lower for over 6 weeks after reopening, then suddenly during the 2nd half of June, rates tripled.
What the heck could have caused then?
Rayshard Brooks was killed in Atlanta on June 14th and the MASSIVE protesting began immediately and has continued.
.png)
By Dakin Andone, Natasha Chen and Kevin Conlon, CNN
Updated 5:58 PM ET, Fri May 15, 2020
https://www.cnn.com/2020/05/15/business/georgia-reopening-3-weeks-later/index.html
https://www.bbc.com/news/world-us-canada-53047282
late APRIL it was NOT hot.
Again you could be right Mike the problem here is your counter argument about the social protesting has had no major increase in the northern states where they've had far more social protesting.
there has been no significant rise in the northern states with covid-19 cases weather has been massive numbers and persistent social protesting. The data shows that and anything else is nonsense
My contention is what's causing the explosion in cases in the Southern States during the summer months -- which by the way proves conclusively this is not flu because that does not happen during the summer season-- has to do with the extensive use of air conditioning in the summer months during and across the Southern States in June July August.
as I posted earlier the research clearly shows that an air-conditioned rooms droplets and particles of coronavirus will last 15 hours in the air in 20 hours on surfaces. During the summer months air conditioning is on full blast all the time across the Southern States because of extremely high temperatures and high dew points.
Tim started a thread on GA earlier, which caused me to look up their stats.............it shows an overwhelming profound LEGIT link to the big increase in protesting NO link to reopening.
How do we know that? we don't. Your data does not support your argument at all You can't have it both ways. Either the social protesting is causing a huge rise in cases everywhere or it's not. It's not causing a huge rise in cases in some locations and not in other ones .
See the graph below: https://coronavirus.1point3acres.com/en
New cases actually went down more in May and were steady in early June, despite testing doubling(so the real rates were much lower for over 6 weeks after reopening, then suddenly during the 2nd half of June, rates tripled.
What the heck could have caused then?
Rayshard Brooks was killed in Atlanta on June 14th and the MASSIVE protesting began immediately and has continued.
mm: "Deaths had been going down steadily for 2 months but could be turning higher soon."
7 day total deaths Sat 6/20 to Fri 6/26 =4228
7 day total deaths Sat 6/27 to Fri 7/3 =3879
7 day total deaths Sat 7/4 to Fri 7/10 =4597
"there has been no significant rise in the northern states with covid-19 cases weather has been massive numbers and persistent social protesting. The data shows that and anything else is nonsense"
False,
Whats true is that there was no significant rise in the northern states that you cherry picked and chose to display.
The Northeast states are coming down from massive spikes higher in the Spring.
Oregon and Washington are northern states with persistent social protesting that have seen cases quadruple since the protests started.
I already showed you Oregon, Washingtons increase is similar.
So do blacks use more air conditioning or are they more likely to go to a BLM protest?
I didn't cherry pick the ages or race of those getting COVID at the higher rates and I used GA because of unique FACTS that only affected GA relating to THEIR protesting that ramped up after June 14th and THEM being the first to open up.
Other states have other things going on that don't provide us with the same characteristics which allow us to separate out the variables like we can do for GA. It's right there in the data.
Thanks pj,
With the new cases soaring higher, it's would be shocking if deaths did not follow.
Fortunately, its hitting many more young people this time and the death rates will be MUCH lower for them. Also, we have some treatments that are saving lives now and cutting the death rate.
Steroids, remdesivir, HCQ(yeah I know, not proven but alot of doctors are prescribing it because they understand medicine-not waiting for studies of the FDA to tell them-after their patient is dead...........it significantly reduces inflammation in the human body and is proven safe from hundreds of millions of people taking it)
New daily positives with the much higher rate of testing and opening up.............and widespread protesting with no social distancing have been going up the last 3 weeks. Possibly, over half of this is from the increase in testing. Some is surely from opening up and poor habits/lack of precautions and some from the protests.
Deaths STILL NOT GOING HIGHER YET! but could be turning higher soon. The next 2 weeks will tell us a great deal(the time lag between testing positive and dying in many cases).
Find this data here: https://coronavirus.1point3acres.com/en
Daily new infection cases in zig zag blue below. Cumulative new cases in orange on graph 1.
On graph 2, deaths in zig zag purple. Totals deaths in red..png)
New daily positives with the much higher rate of testing and opening up.............and widespread protesting with no social distancing have been going up the last 3 weeks. Possibly, over half of this is from the increase in testing. Some is surely from opening up and poor habits/lack of precautions and some from the protests.
Deaths STILL NOT GOING HIGHER YET! In fact, they dropped for 6 straight days!! They are close the the lowest since the outbreak.
Find this data here: https://coronavirus.1point3acres.com/en
Daily new infection cases in zig zag blue below. Cumulative new cases in orange on graph 1.
On graph 2, deaths in zig zag purple. Totals deaths in red.
mm: "Deaths STILL NOT GOING HIGHER YET! In fact, they dropped for 6 straight days!! They are close the the lowest since the outbreak."
These data must quite different than Worldometers?
For US daily deaths Worldometers shows :
| Mon | 6/29 | 366 |
| Tue | 6/30 | 727 |
| Wed | 7/1 | 676 |
| Thu | 7/2 | 687 |
| Fri | 7/3 | 626 |
| Sat | 7/4 | 265 |
| Sun | 7/5 | 262 |
| Mon | 7/6 | 378 |
| Tue | 7/7 | 993 |
| Wed | 7/8 | 890 |
| Thu | 7/9 | 960 |
| Fri | 7/10 | 849 |
| Sat | 7/11 | 732 |
| Sun | 7/12 | 380 |
Only 3 days in a row of declines with Sunday 7/12 most likely due to the (weekly) weekend drop.
Also, in the past 14 days every day of the week has shown a week to week increase.
I'm grateful to you for posting this pj.
It makes much more sense than the source I use showing the drop during the previous 6 days, which you can see on their graph.
Not sure what the reason is but it helps my attempt to understand the big picture of what's going on.
New daily positives with the much higher rate of testing and opening up.............and widespread protesting with no social distancing have been going up the last 3 weeks. Possibly, over half of this is from the increase in testing. Some is surely from opening up and poor habits/lack of precautions and some from the protests.
Deaths STILL NOT GOING HIGHER YET! In fact, they dropped for 6 straight days!! They are close the the lowest since the outbreak. Monday was the 2nd lowest since early March. This is strange, we are supposed to be going much higher.
Find this data here: https://coronavirus.1point3acres.com/en
Daily new infection cases in zig zag blue below. Cumulative new cases in orange on graph 1.
On graph 2, deaths in zig zag purple. Totals deaths in red.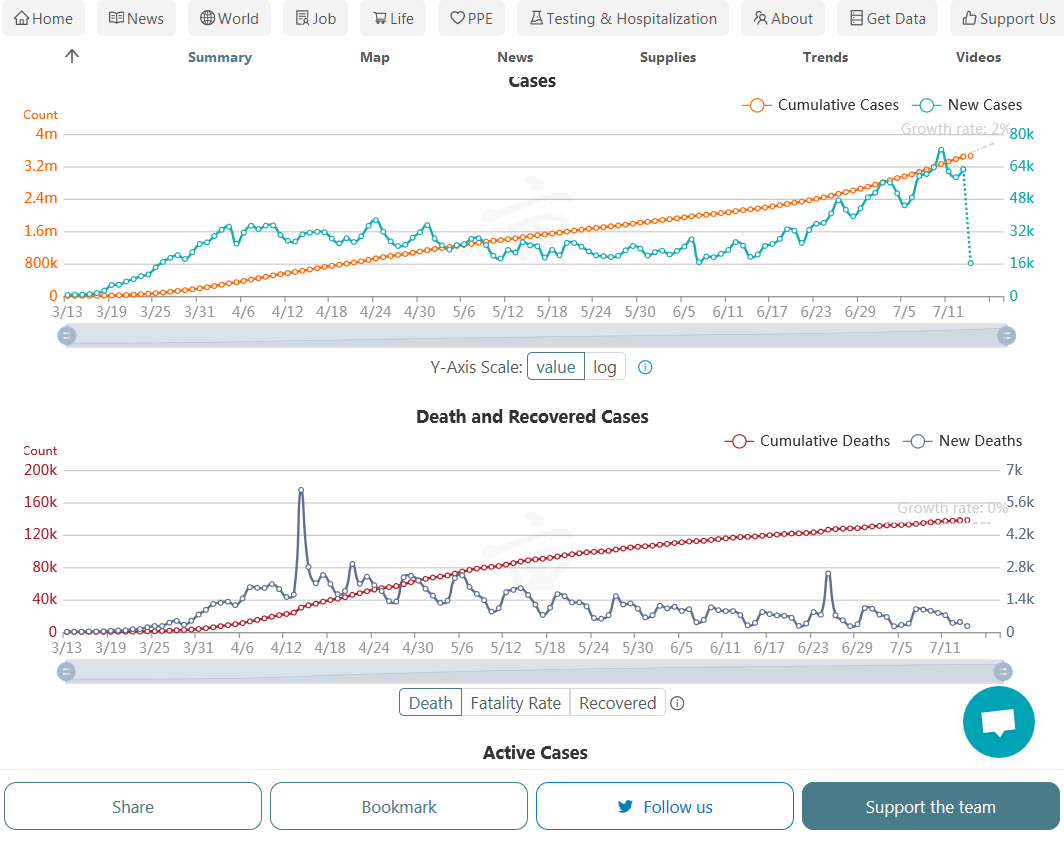
New daily positives with the much higher rate of testing and opening up.............and widespread protesting with no social distancing have been going up the last 3 weeks. Possibly, over half of this is from the increase in testing. Some is surely from opening up and poor habits/lack of precautions and some from the protests.
Deaths STILL NOT GOING HIGHER YET!
Find this data here: https://coronavirus.1point3acres.com/en
Daily new infection cases in zig zag blue below. Cumulative new cases in orange on graph 1.
On graph 2, deaths in zig zag purple. Totals deaths in red.
so last nite it was reported that a patient who was tested positive say 15 times was then reported as 15 positives to the cdc. With data like this and all the other trumped up numbers over th summer how can we trust any of the numbers to be remotely accurate. This is crazy to throw junk data out to thee public and then direct them to close down.
mcfarm,
You just raised an interesting point that I never thought about.
After a person tests positive, how do they know when they are no longer positive and safe to leave isolation?
They can either recover to the point of not having symptoms and assume they are probably not contagious/positive OR
They get tested again to get a medical confirmation.
Many of them will likely want to know ASAP to get on with their lives, to the point of testing before they are negative yet. When this happens, this results in a 2nd positive COVID test result from 1 case, no?
Not sure on how this is handled but the COVID tests now seem to be really easy to get and take and are responsible for at least half the new cases. Deaths may have finally started to creep higher, after the new cases have doubled since mid June, likely, in many areas from the protesting.
New daily positives with the much higher rate of testing and opening up.............and widespread protesting with no social distancing have been going up the last month. Possibly, over half of this is from the increase in testing. Some is surely from opening up and poor habits/lack of precautions and some from the protests.
Deaths may be or soon be going higher by a bit.
Find this data here: https://coronavirus.1point3acres.com/en
Daily new infection cases in zig zag blue below. Cumulative new cases in orange on graph 1.
On graph 2, deaths in zig zag purple. Totals deaths in red..png)
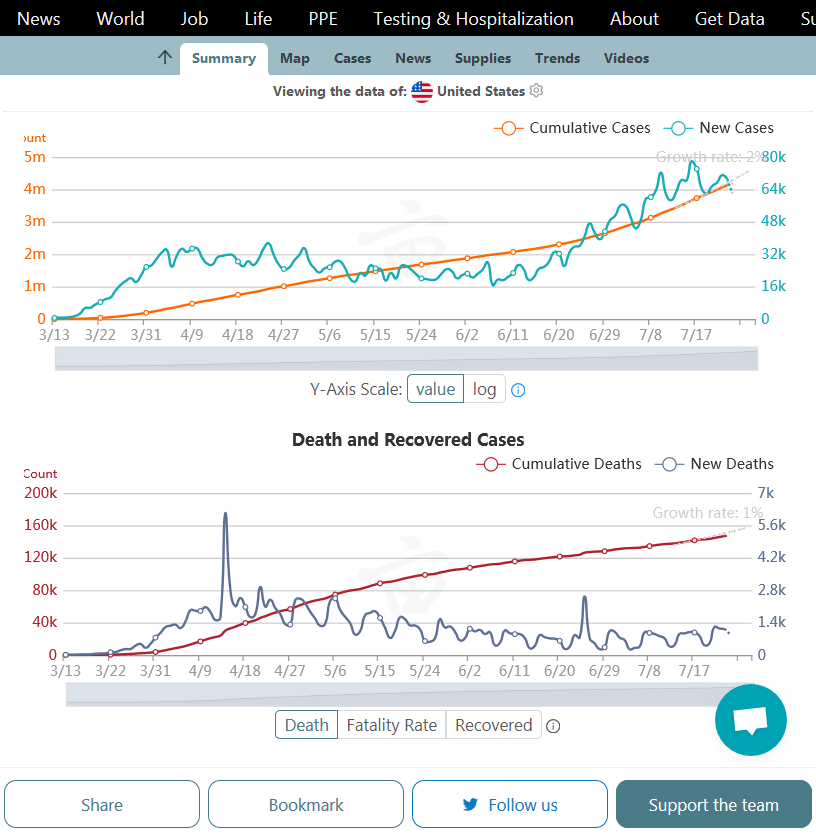
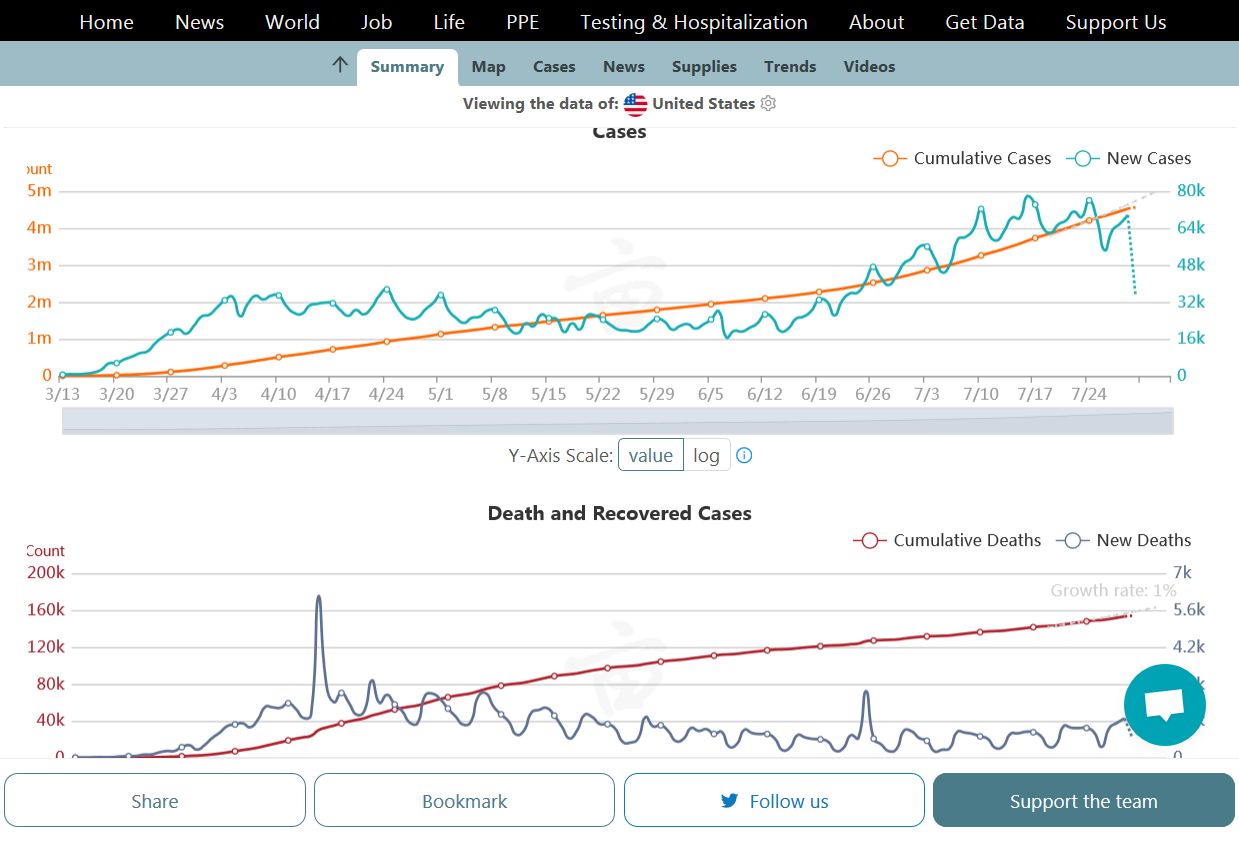
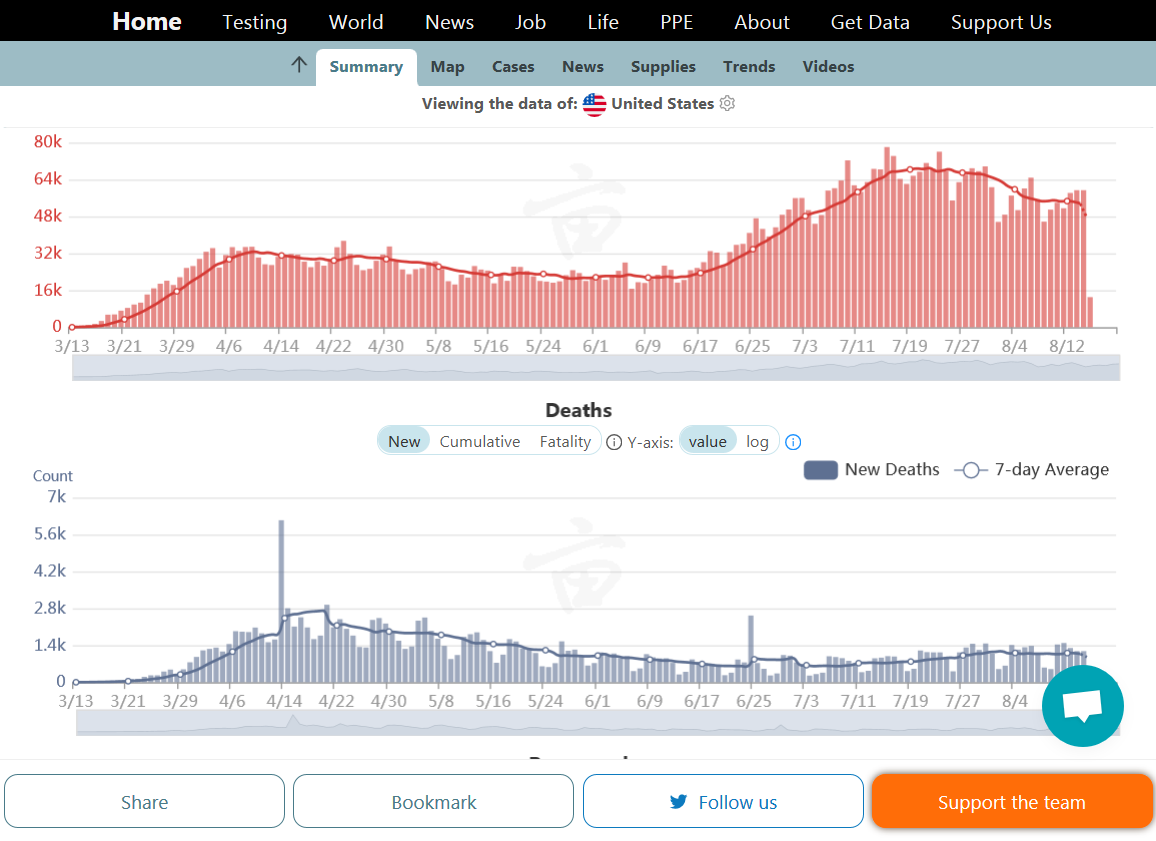
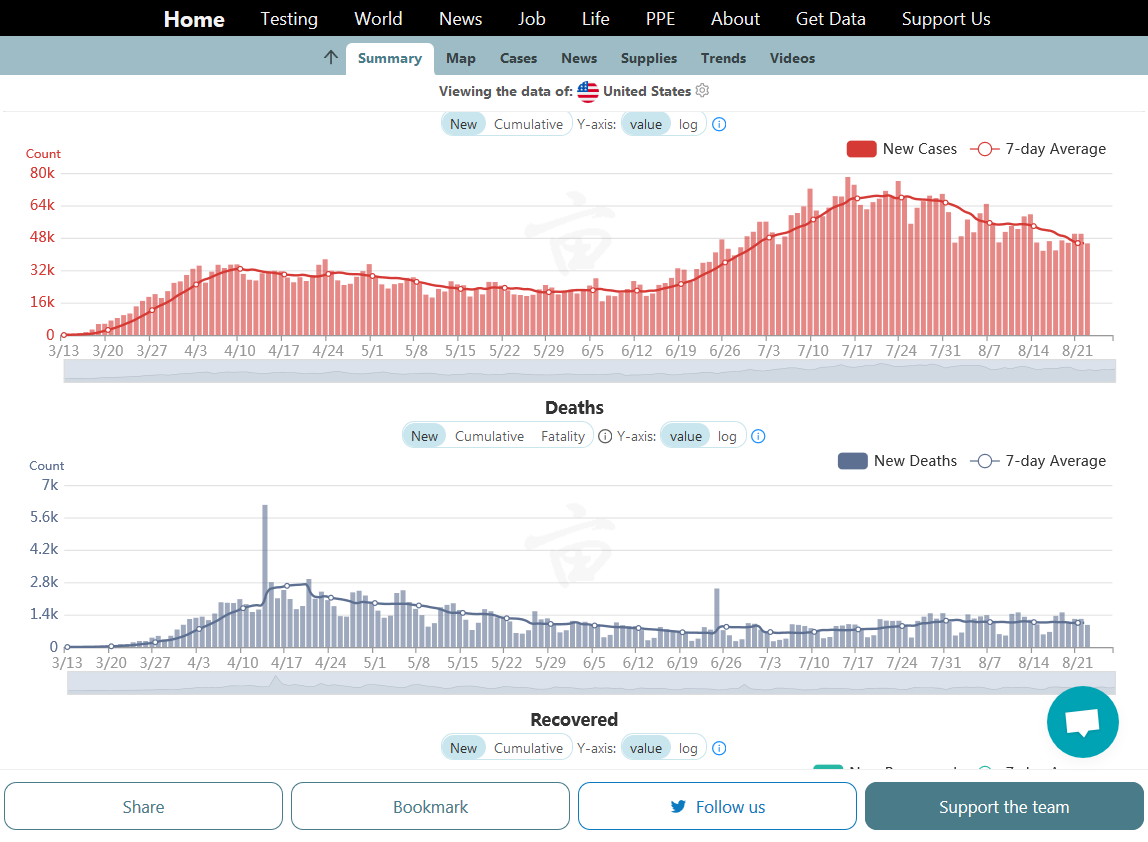
New daily positives with the much higher rate of testing and opening up.............and widespread protesting with no social distancing have been soaring higher the last month(at double the April peak). Possibly, over half of this is from the increase in testing. Some is surely from opening up and poor habits/lack of precautions and some from the protests.
Deaths have started slowly going higher.........this should continue.
Find this data here: https://coronavirus.1point3acres.com/en
Daily new infection cases in zig zag blue below. Cumulative new cases in orange on graph 1.
On graph 2, deaths in zig zag purple. Totals deaths in red.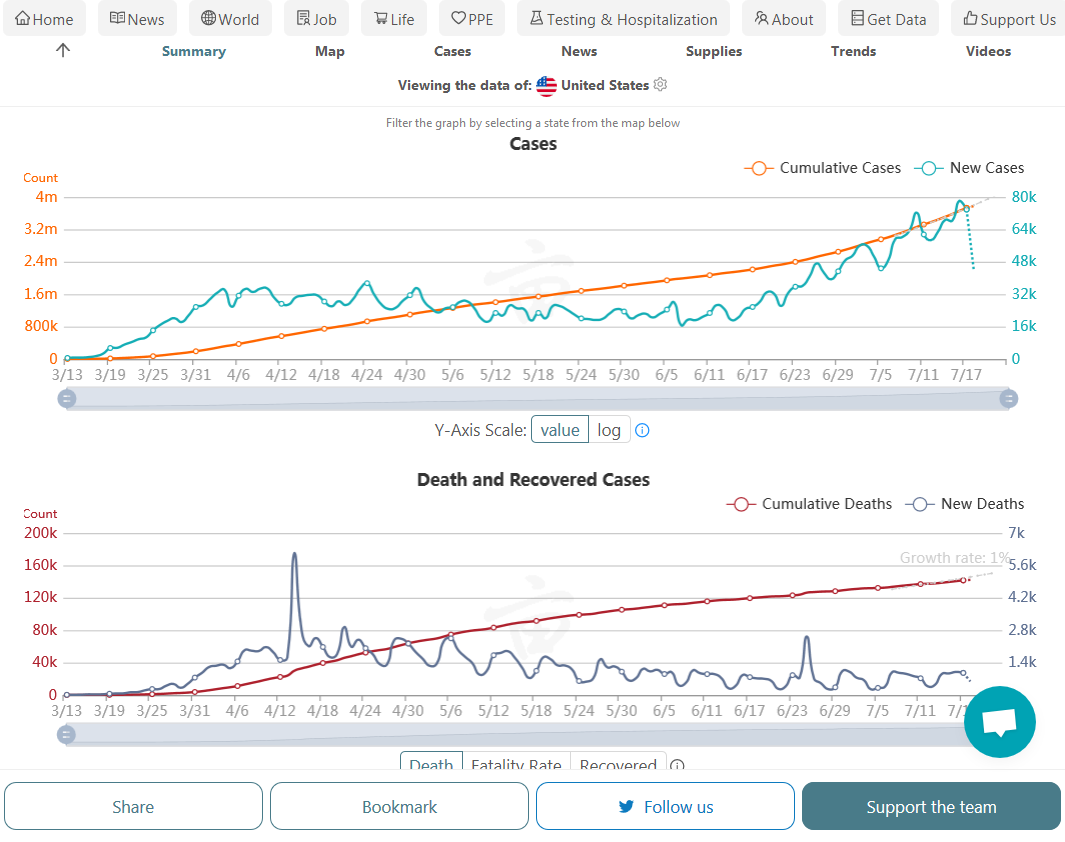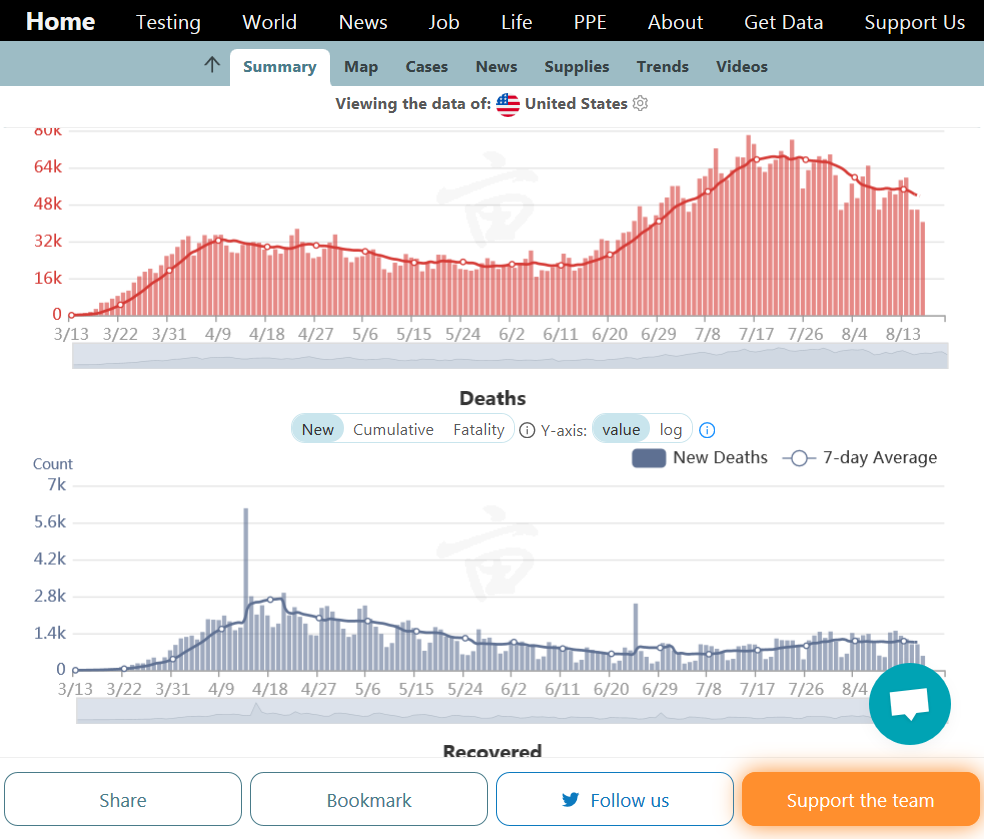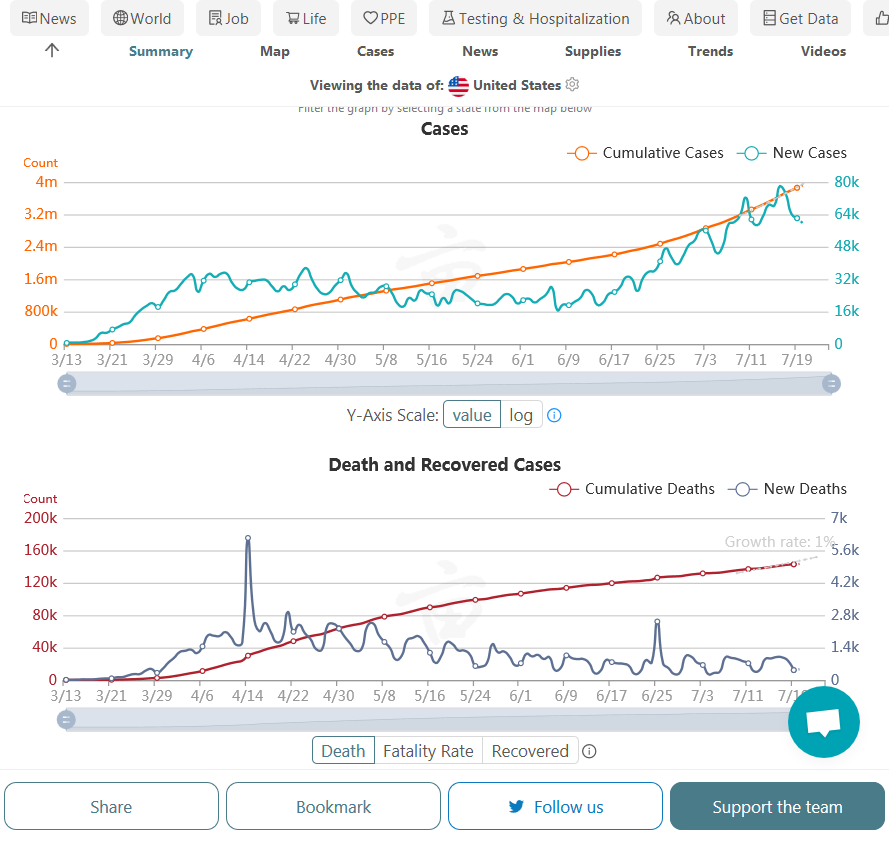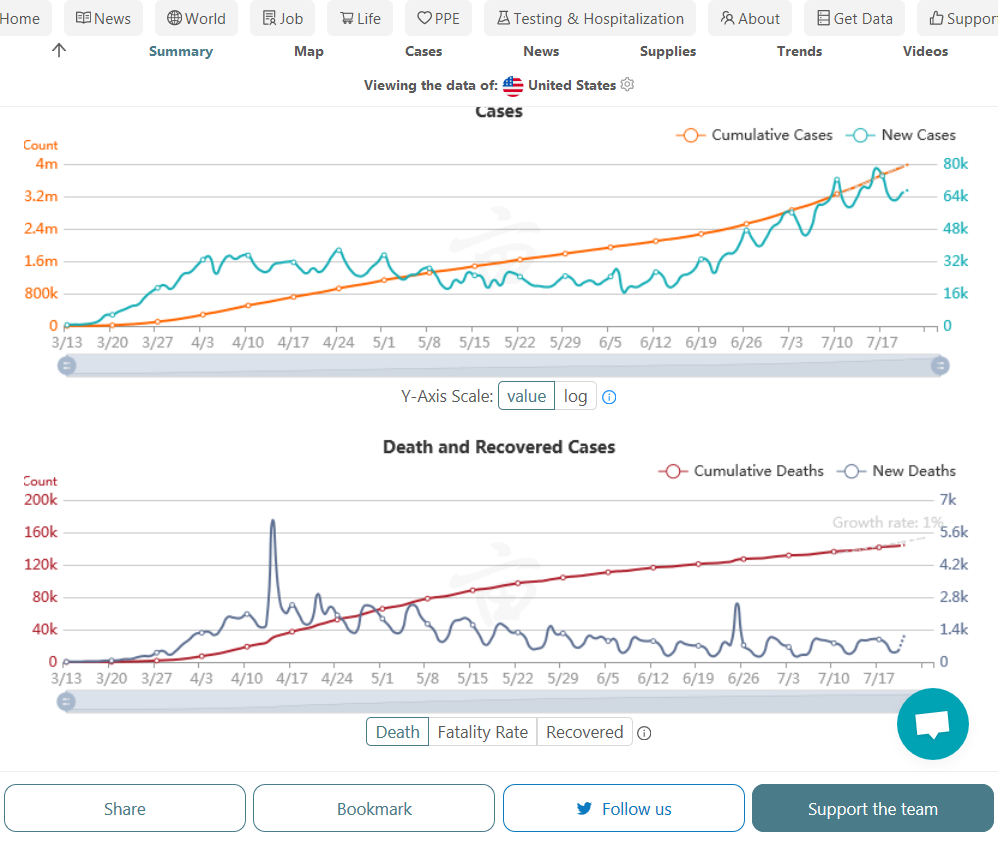
https://www.vox.com/21333964/covid-19-coronavirus-trump-briefing-today
:no_upscale()/cdn.vox-cdn.com/uploads/chorus_asset/file/20105945/Screen_Shot_2020_07_22_at_9.23.35_AM.png)
My interpretation:
1. New tests are 4 times what they were less than 3 months ago. This is contributing to the new cases(detected).
2. New cases were going down thru May, the suddenly in the 2nd week of June, reversed and have accelerated higher.......now 3 times higher.......than what they were before the protesting. Yes, we were opening stuff up which is increasing rates but states NOT opening much that have lots of protesting, like CA are having some of the biggest increases. OR's rate is 6 times higher than the early June rate. New cases are double the peak in April!! Protest aged people and blacks have been the most affected.
3. Hospitalizations are a key number. They dropped to half the peak by mid June, then have spiked back up to the peak right now. So hospitalizations per case are about half of what they were in the Spring. Part of this is because many are minor cases that were not tested before and a big part of that is these are younger people.........the age of protesters that don't get as sick.
4. Deaths had dropped to something like 25% of those reported during the Spring peak. Those bottomed at the start of July and are slowly turning higher. So far, not showing the same huge increase higher that the other metrics have shown for weeks. This is likely because its more young people and we are finding effective treatments.
New daily positives with the much higher rate of testing and opening up.............and widespread protesting with no social distancing have been soaring higher the last month(at double the April peak). Possibly, over half of this is from the increase in testing. Some is surely from opening up and poor habits/lack of precautions and some from the protests.
Deaths have started slowly going higher.........this should continue.
Find this data here: https://coronavirus.1point3acres.com/en
Daily new infection cases in zig zag blue below. Cumulative new cases in orange on graph 1.
On graph 2, deaths in zig zag purple. Totals deaths in red.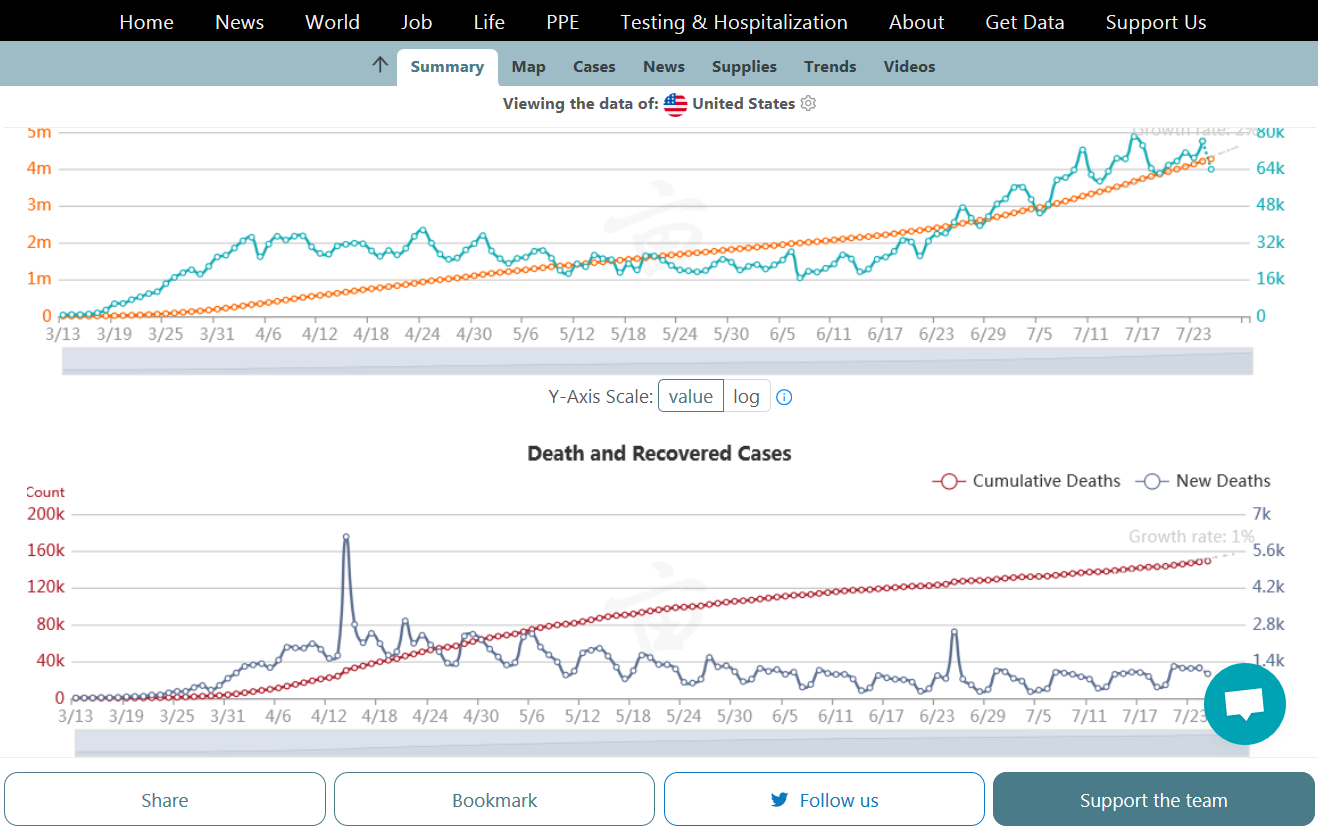
Thru July 28, 2020
Has the rate in increase of new cases peaked?
Deaths, a lagging indicator should continue to go up but the death rate for the virus is much lower than it was in the Spring.
Has the rate in increase of new cases peaked?
Deaths, a lagging indicator should continue to go up but the death rate for the virus is much lower than it was in the Spring.
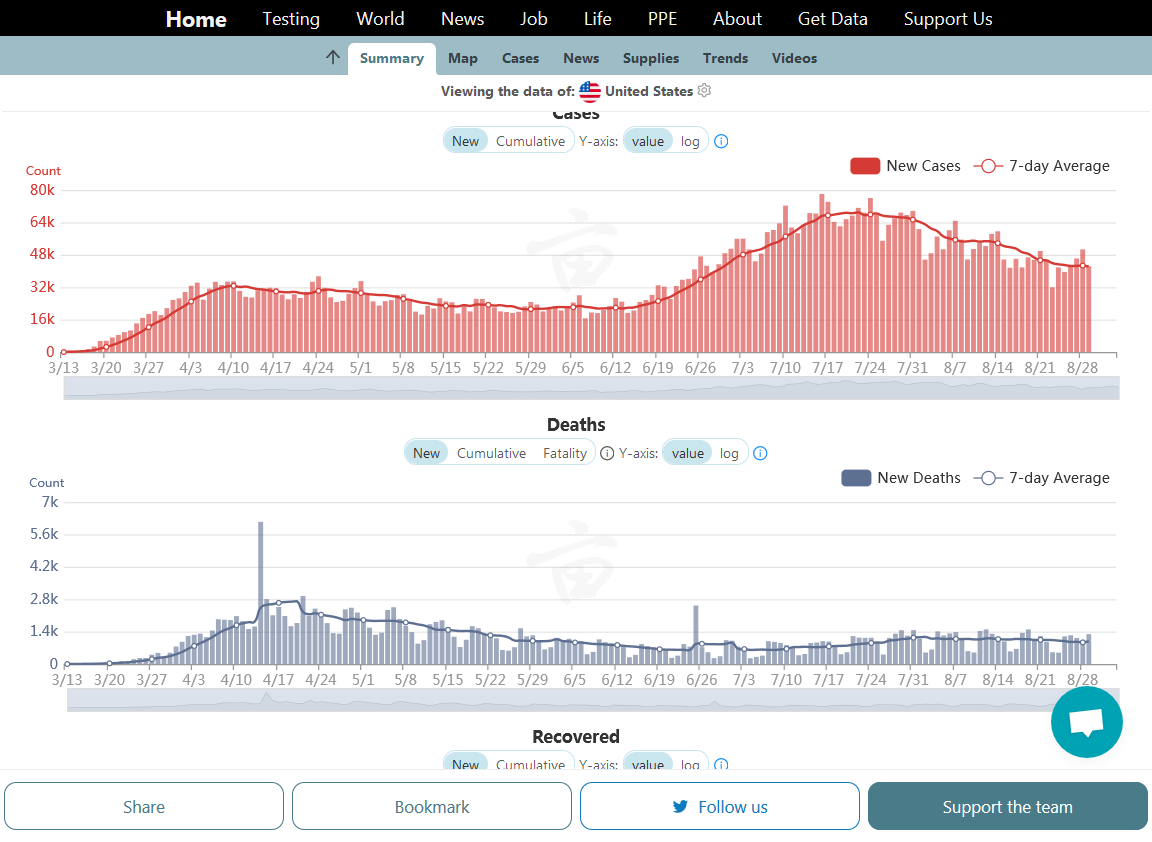
New daily positives with the much higher rate of testing and opening up.............and widespread protesting with no social distancing had been soaring higher the last month(at double the April peak). Possibly, over half of this is from the increase in testing. Some is surely from opening up and poor habits/lack of precautions and some from the protests.
However, it looks like we have peaked, with help from the COVID spreading protests winding down.
Deaths have started slowly going higher.........this should continue.
Find this data here: https://coronavirus.1point3acres.com/en
Daily new infection cases on the first graph below.
On graph 2, deaths.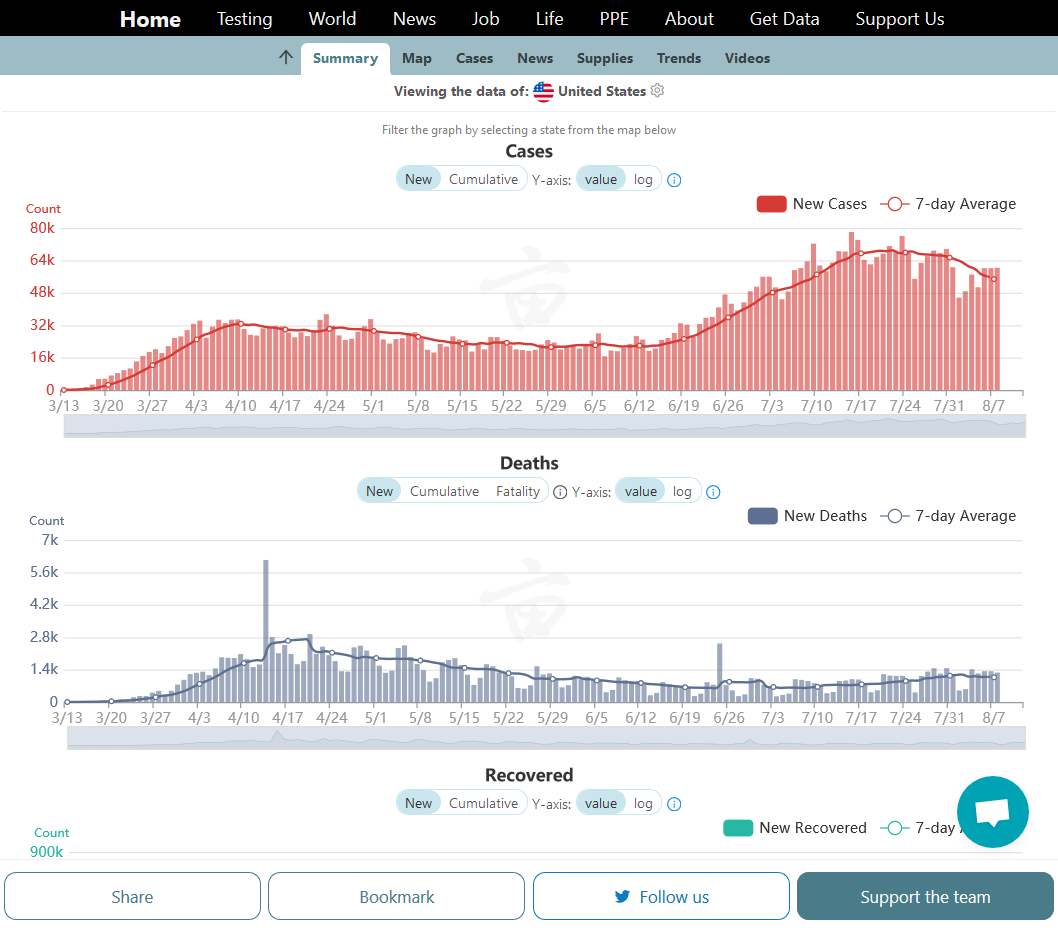
Covering up massive COVID being spread from protests-8/8 update below
https://www.markLog outetforum.com/forum/topic/57070/
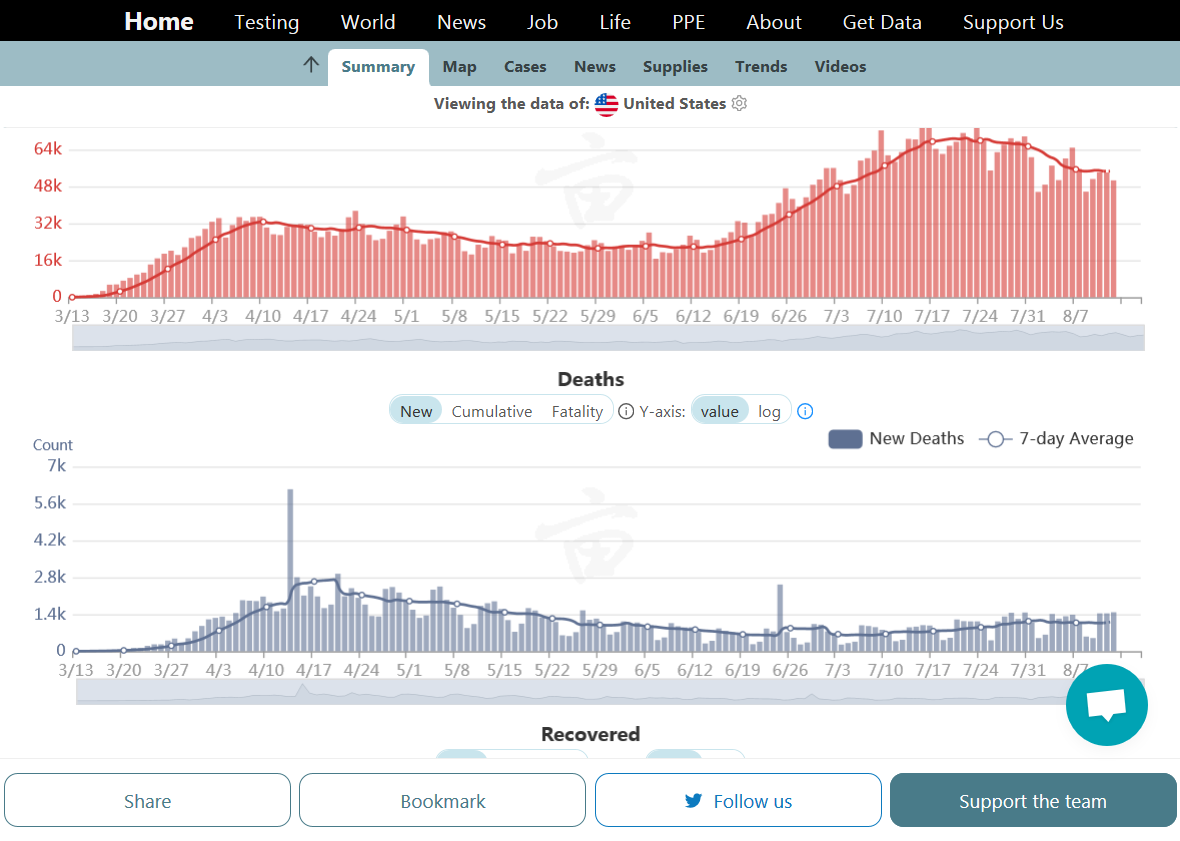
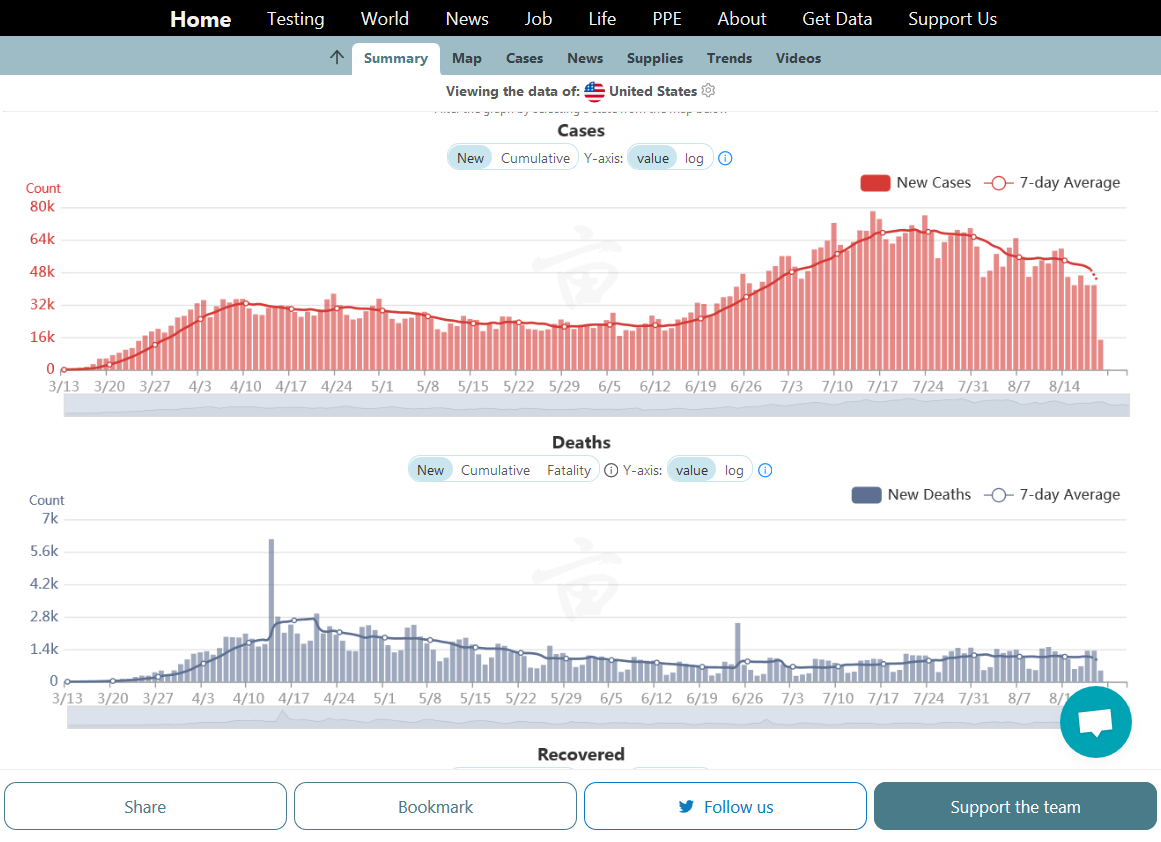
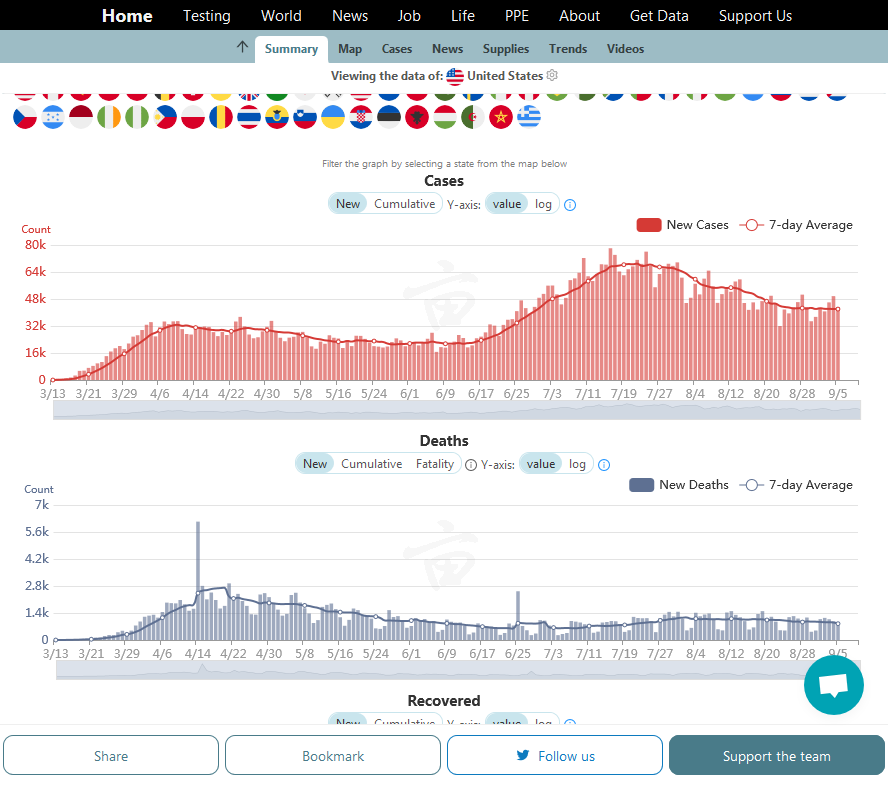
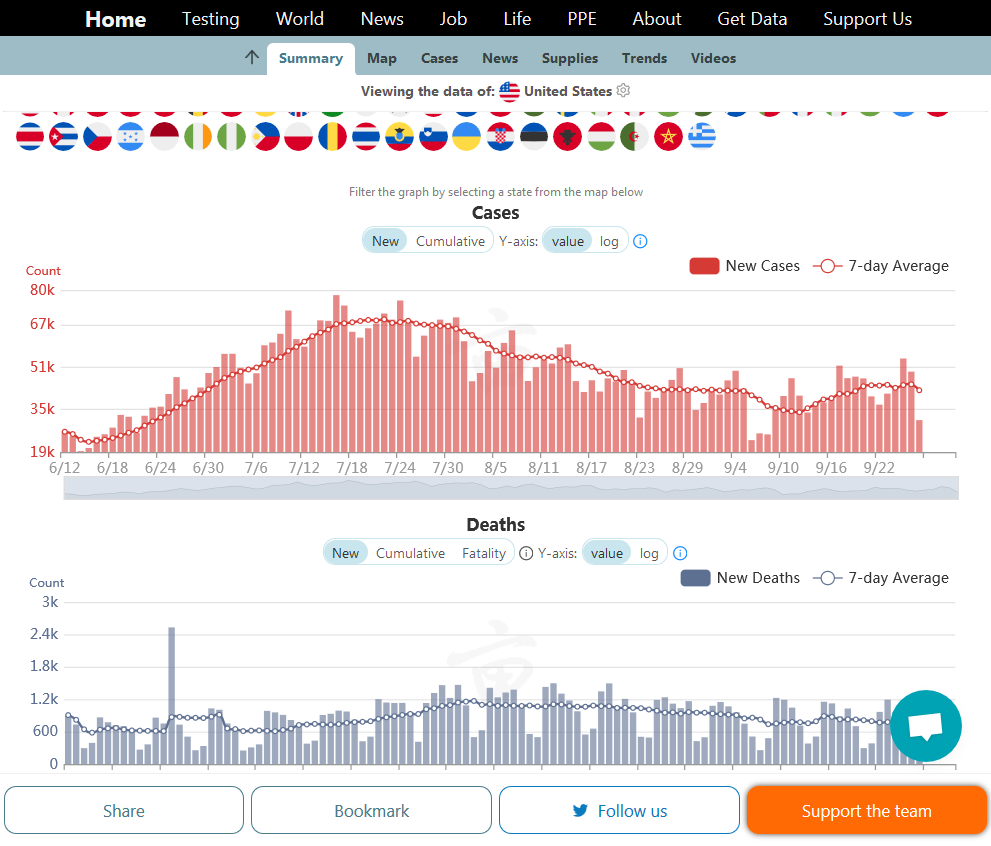
New daily positives with the much higher rate of testing and opening up.............and widespread protesting with no social distancing had been soaring higher in June/July(at double the April peak). Possibly, over half of this is from the increase in testing. Some is surely from opening up and poor habits/lack of precautions and some from the protests.
However, it looks like we have peaked, with help from the COVID spreading protests winding down.
Deaths have started slowly going higher.........they maybe have leveled off.
Find this data here: https://coronavirus.1point3acres.com/en
Daily new infection cases on the first graph below.
On graph 2, deaths.
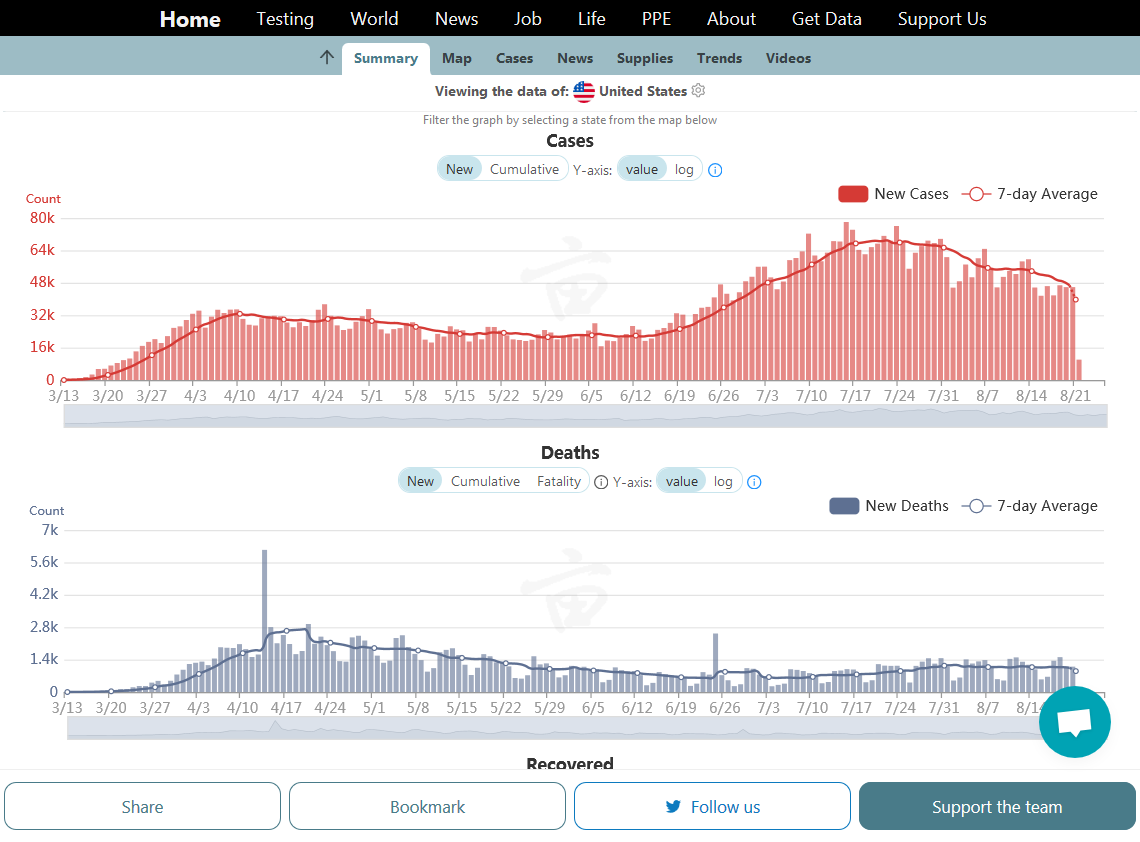
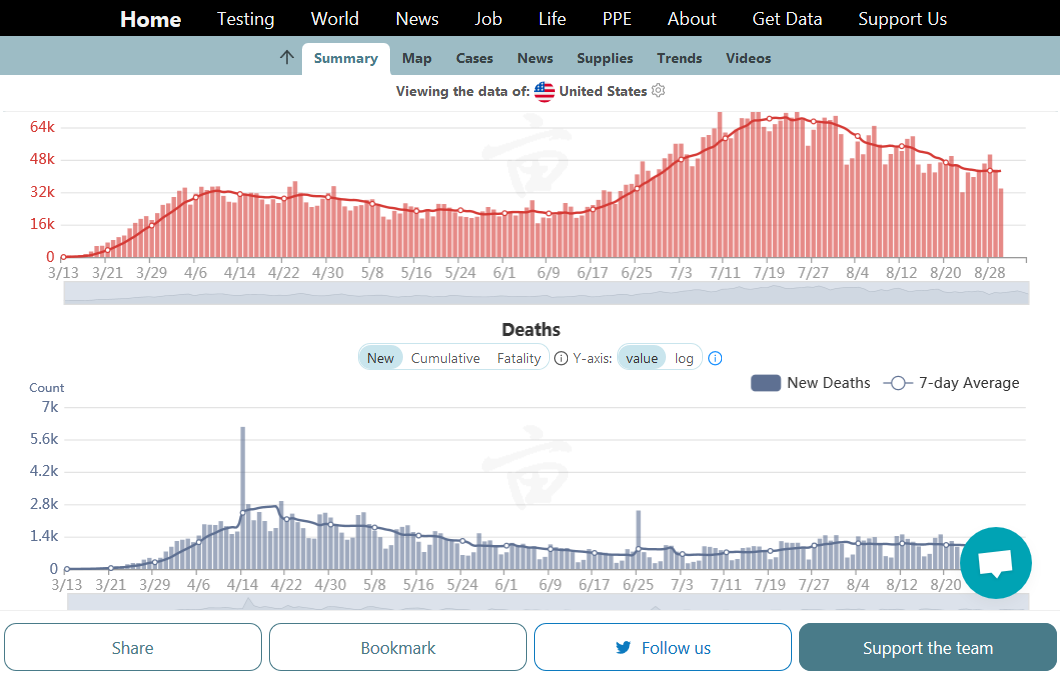
AUGUST 15: ..........new positive cases have peaked.....deaths may also be peaking(at much less than 50% of the April peak).
AUGUST 17: ..........new positive cases have peaked.....deaths may also be peaking(at much less than 50% of the April peak).
AUGUST 19: ..........new positive cases have peaked!.....deaths may also be peaking(at much less than 50% of the April peak).
Find this data here: https://coronavirus.1point3acres.com/en
AUGUST 21: ..........new positive cases have peaked!.....deaths may also have peaked(at much less than 50% of the April peak).
Find this data here: https://coronavirus.1point3acres.com/en
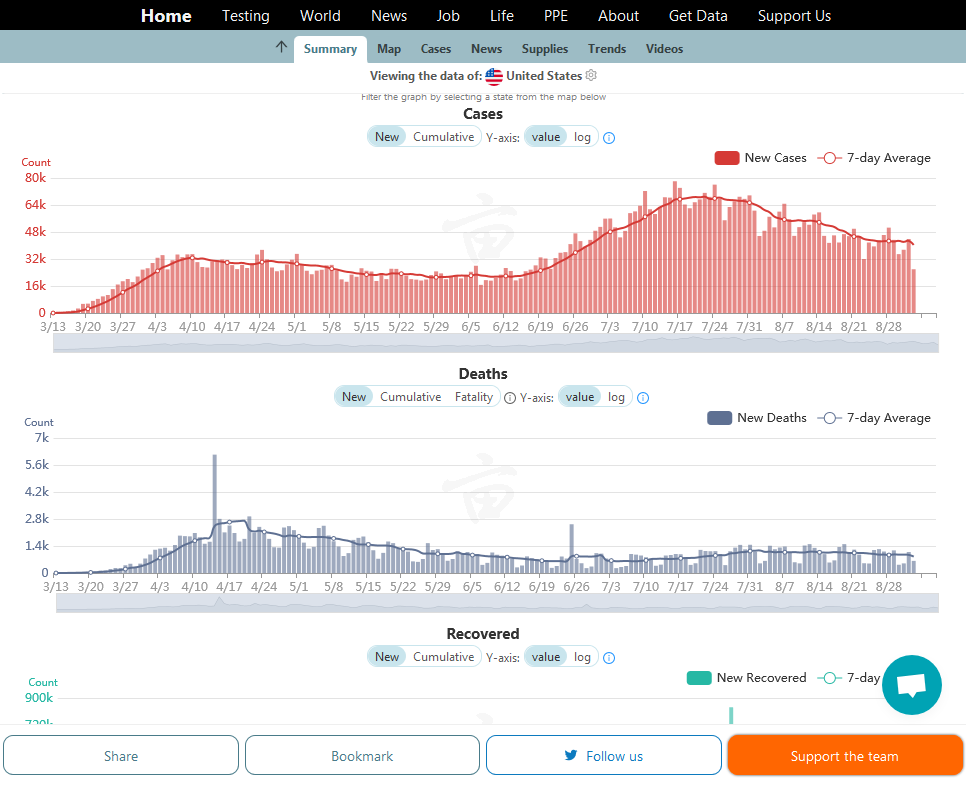
AUGUST 22: ..........new positive cases peaked a month ago!(the MSM is still focused on the negatives).....deaths also have peaked(at much less than 50% of the April peak).
Find this data here: https://coronavirus.1point3acres.com/en
AUGUST 25: ..........new positive cases peaked just over a month ago!(the MSM is still focused on the negatives).....deaths also have peaked(at much less than 50% of the April peak).
Find this data here: https://coronavirus.1point3acres.com/en

AUGUST 25: ..........new positive cases peaked over a month ago!(the MSM is still focused on the negatives).....deaths also have peaked(at much less than 50% of the April peak).
As we continue to open up. Hopefully, protests won't ramp up again.
Find this data here: https://coronavirus.1point3acres.com/en

AUGUST 29
: ..........new positive cases peaked over a month ago!(the MSM is still focused on the negatives).....deaths also have peaked(at much less than 50% of the April peak).
As we continue to open up. Hopefully, protests won't ramp up again.
Find this data here: https://coronavirus.1point3acres.com/en
AUGUST 31
New positive cases peaked over a month ago!(the MSM is still focused on the negatives).....deaths also have peaked(at much less than 50% of the April peak).
As we continue to open up. Hopefully, protests won't ramp up again.
Find this data here: https://coronavirus.1point3acres.com/en
New positive cases peaked over a month ago!(the MSM is still focused on the negatives).....deaths also have peaked(at much less than 50% of the April peak).
As we continue to open up. Hopefully, protests won't ramp up again.
Find this data here: https://coronavirus.1point3acres.com/en

New positive cases peaked over a month ago!(the MSM is still focused on the negatives).....deaths also have peaked(at much less than 50% of the April peak).
As we continue to open up. Hopefully, protests won't ramp up again.
Find this data here: https://coronavirus.1point3acres.com/en
New positive cases peaked over a month ago!(the MSM is still focused on the negatives).....deaths also have peaked(at much less than 50% of the April peak).
As we continue to open up. Hopefully, protests won't ramp up again.
Find this data here: https://coronavirus.1point3acres.com/en
New positive cases peaked over 6 weeks ago!(the MSM is still focused on the negatives).....deaths also have peaked(at much less than 50% of the April peak).
Even as we continue to open up. Hopefully, protests won't ramp up again.
Find this data here: https://coronavirus.1point3acres.com/en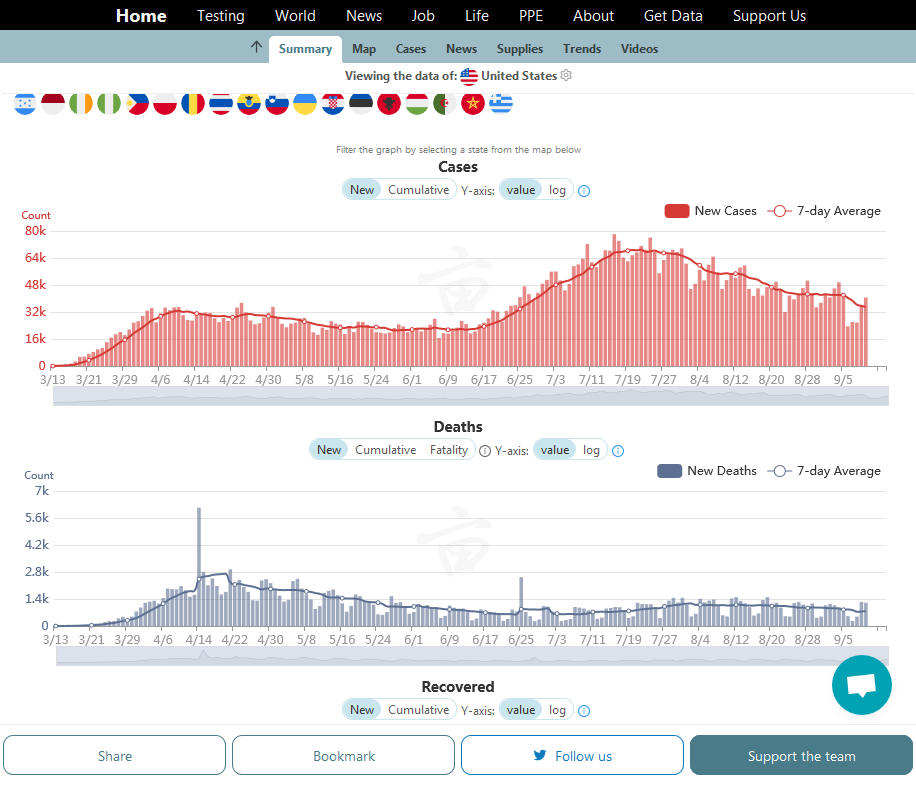
New positive cases peaked over 7 weeks ago!(the MSM is still focused on the negatives).....deaths also have peaked(at much less than 50% of the April peak).
Even as we continue to open up. Hopefully, protests won't ramp up again.
Find this data here: https://coronavirus.1point3acres.com/en.png)
New positive cases peaked 2 months ago (however, last week, they WENT UP for the first week since then).....deaths also have peaked(at much less than 50% of the April peak).
Find this data here: https://coronavirus.1point3acres.com/en
New positive cases peaked 2 months ago (however, last week, they WENT UP for the first week since then).....deaths also have peaked(at much less than 50% of the April peak).
Find this data here: https://coronavirus.1point3acres.com/en
New positive cases peaked over 2 months ago (however, the last 2 weeks, they WENT UP a bit).....deaths also peaked(at much less than 50% of the April peak).
Find this data here: https://coronavirus.1point3acres.com/en

New positive cases peaked over 2 months ago (however, the last 2 weeks, they WENT UP a bit).....deaths also peaked(at much less than 50% of the April peak).
COVID spreading protesting picking up again is bad news.
Find this data here: https://coronavirus.1point3acres.com/en
New positive cases peaked over 2 months ago (however, they WENT UP a bit earlier this month).....deaths also peaked(at much less than 50% of the April peak).
COVID spreading protesting picking up again is bad news.
Find this data here: https://coronavirus.1point3acres.com/en

New positive cases peaked over 2 months ago (however, they have been going up a bit the past several weeks)....deaths also peaked(at much less than 50% of the April peak).
COVID spreading protesting picking up again in some places is bad news.
Find this data here: https://coronavirus.1point3acres.com/en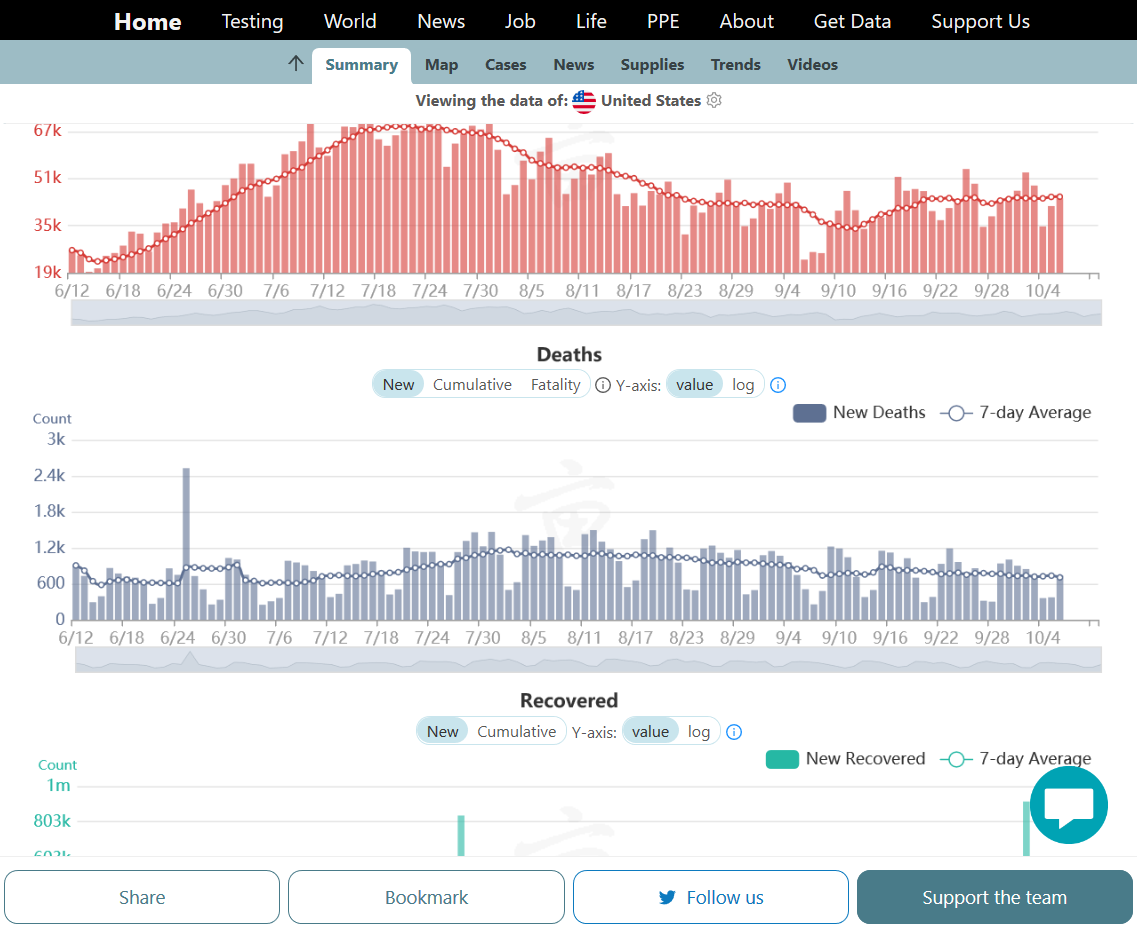
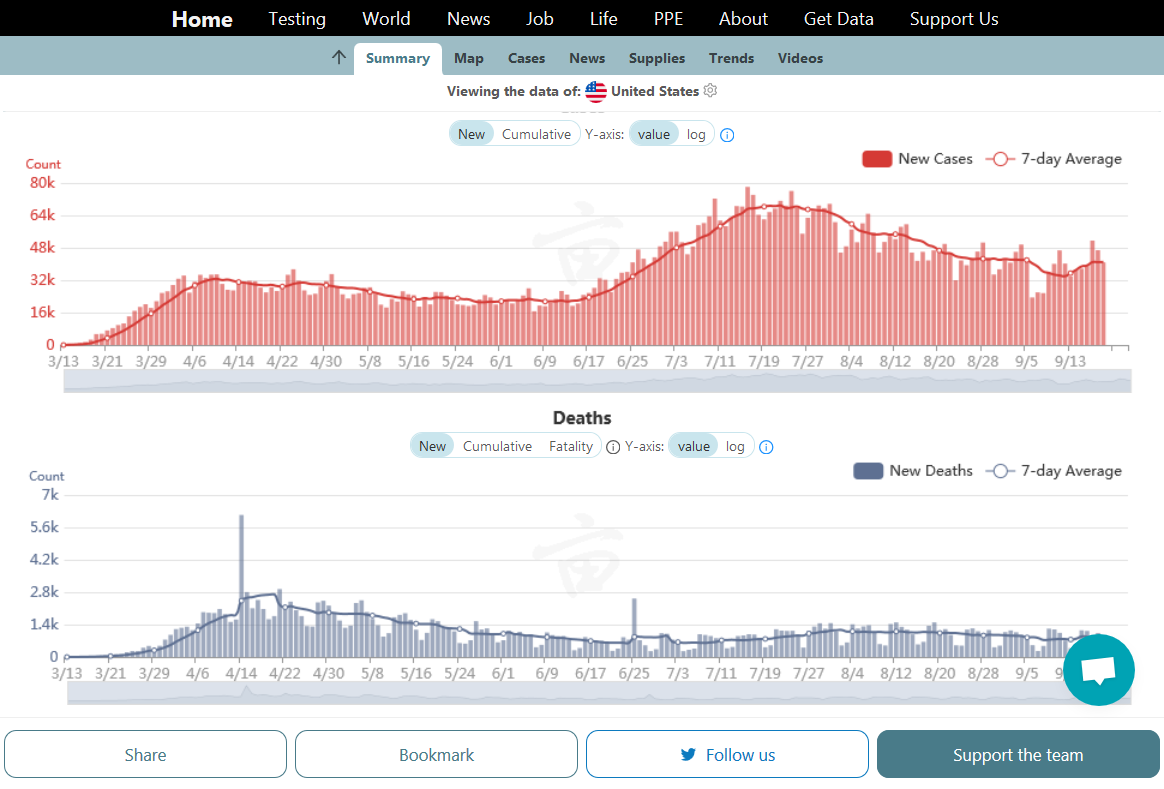
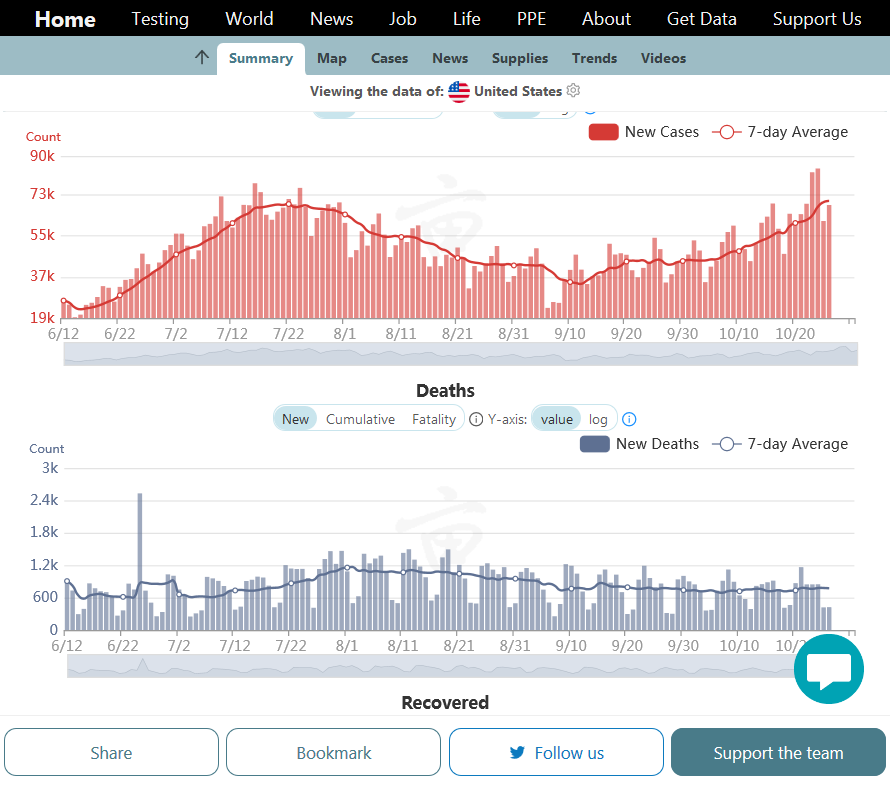
New positive cases peaked over 2 months ago (however, they increased a bit in September)....deaths also peaked(at much less than 50% of the April peak).
COVID spreading protesting picking up again in some places is bad news.
Find this data here: https://coronavirus.1point3acres.com/en
New positive cases peaked almost 3 months ago (however, they've increased s bit during the last month)....deaths also peaked(at much less than 50% of the April peak and are holding around steady to a slight drop).
Find this data here: https://coronavirus.1point3acres.com/en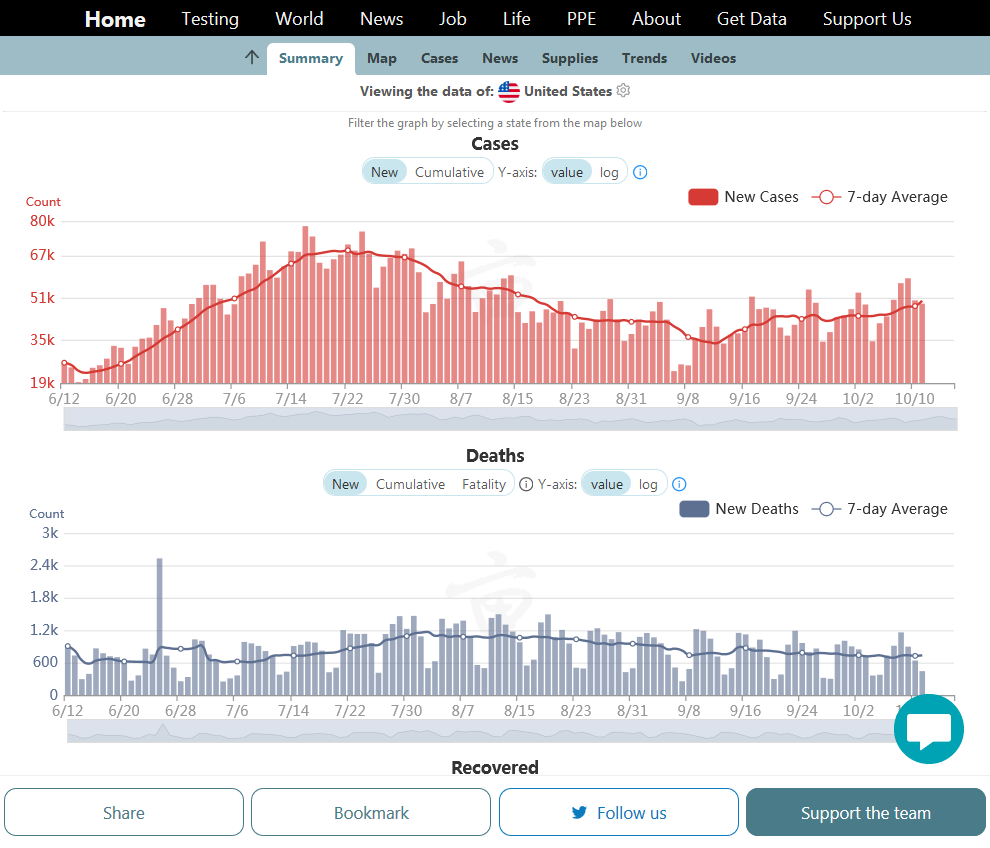
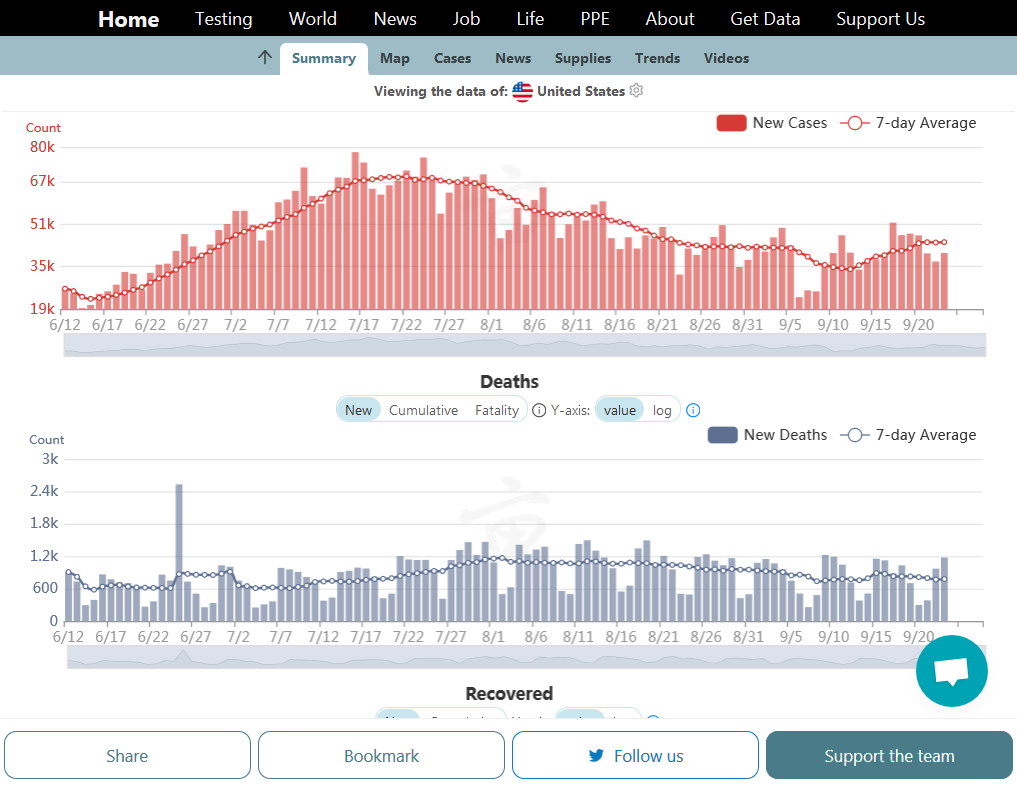
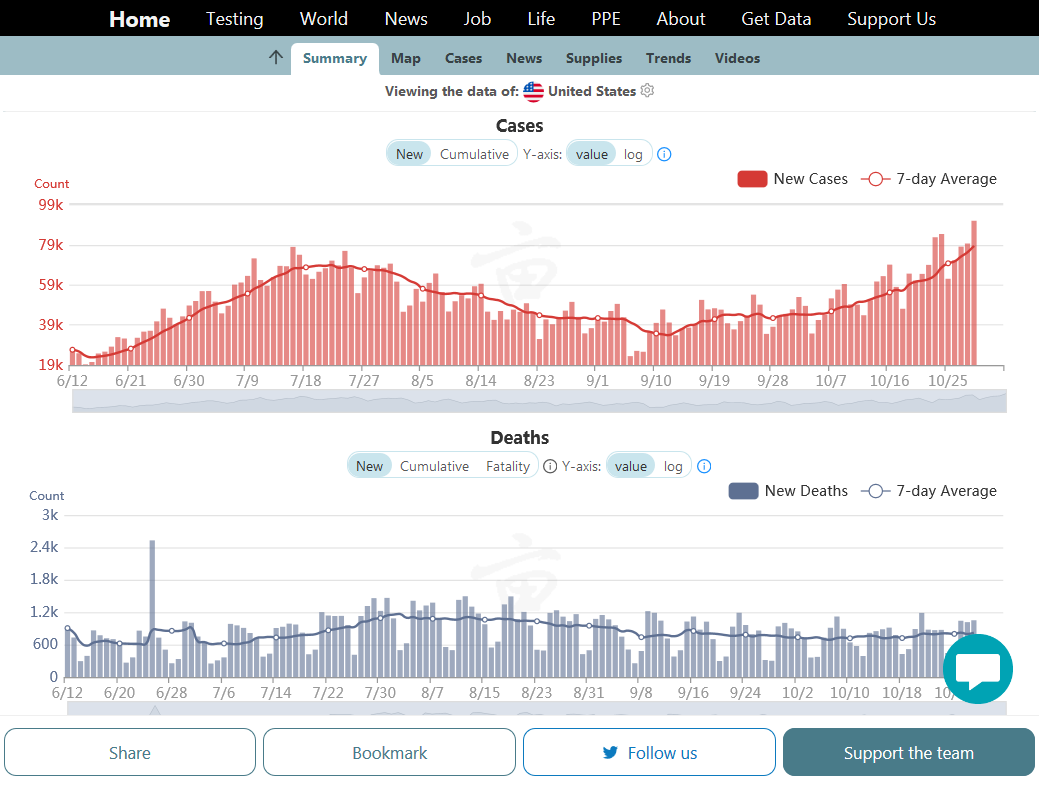
New positive cases peaked almost 3 months ago (however, they've increased slowly the past 5 weeks)...deaths also peaked(at much less than 50% of the April peak and are still dropping very slowly but being a lagging indicator, could go up a tad.
Find this data here: https://coronavirus.1point3acres.com/en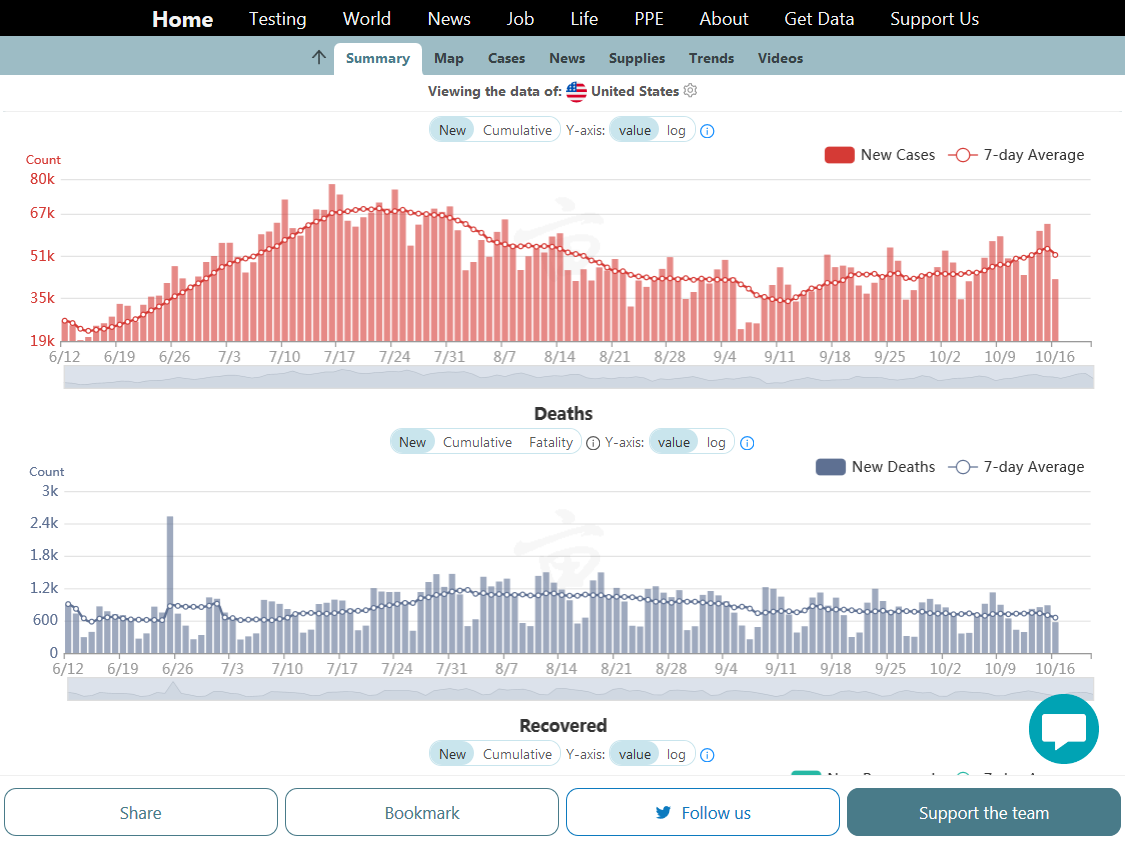
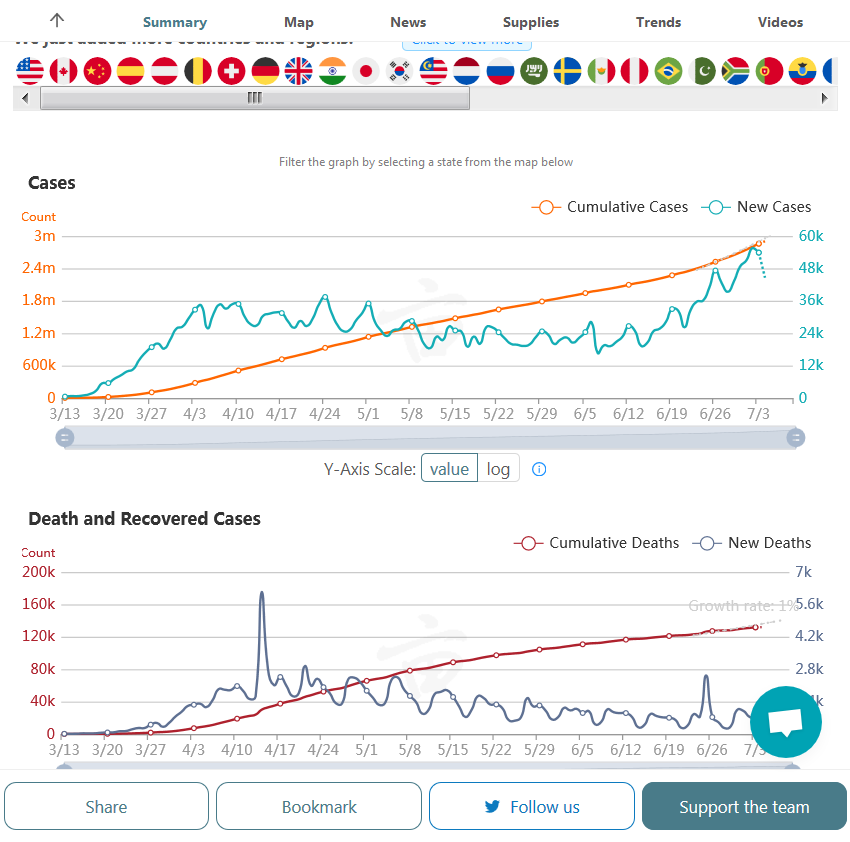
This is the world graph of COVID cases. New positive cases have been increasing all year. They leveled off during August but have been going up again since then, currently at the highest numbers of the pandemic. New cases this week, topped 400,000/day for the first time, 7 day average almost 350,000.
Deaths peaked in mid-April at 7,000/day, then fell sharply for 6 weeks, then increased for 8 weeks into July but still below the previous peak and have been steady since then at just under 6,000/day.
So across the globe, new cases right now are occurring at a 4+ times higher rate than they were in April but deaths here in October are still below the April peak, meaning that the death rate is more than 4 times LESS than it was earlier this year for people with COVID.
This is partially from better treatments. Also better protection of the most vulnerable. The initial high death rate picked off the most vulnerable quickly.
Forgot to mention testing ramping way up is responsible for many of the new positives that were not detected under similar conditions earlier this year.
https://coronavirus.1point3acres.com/en
.png)
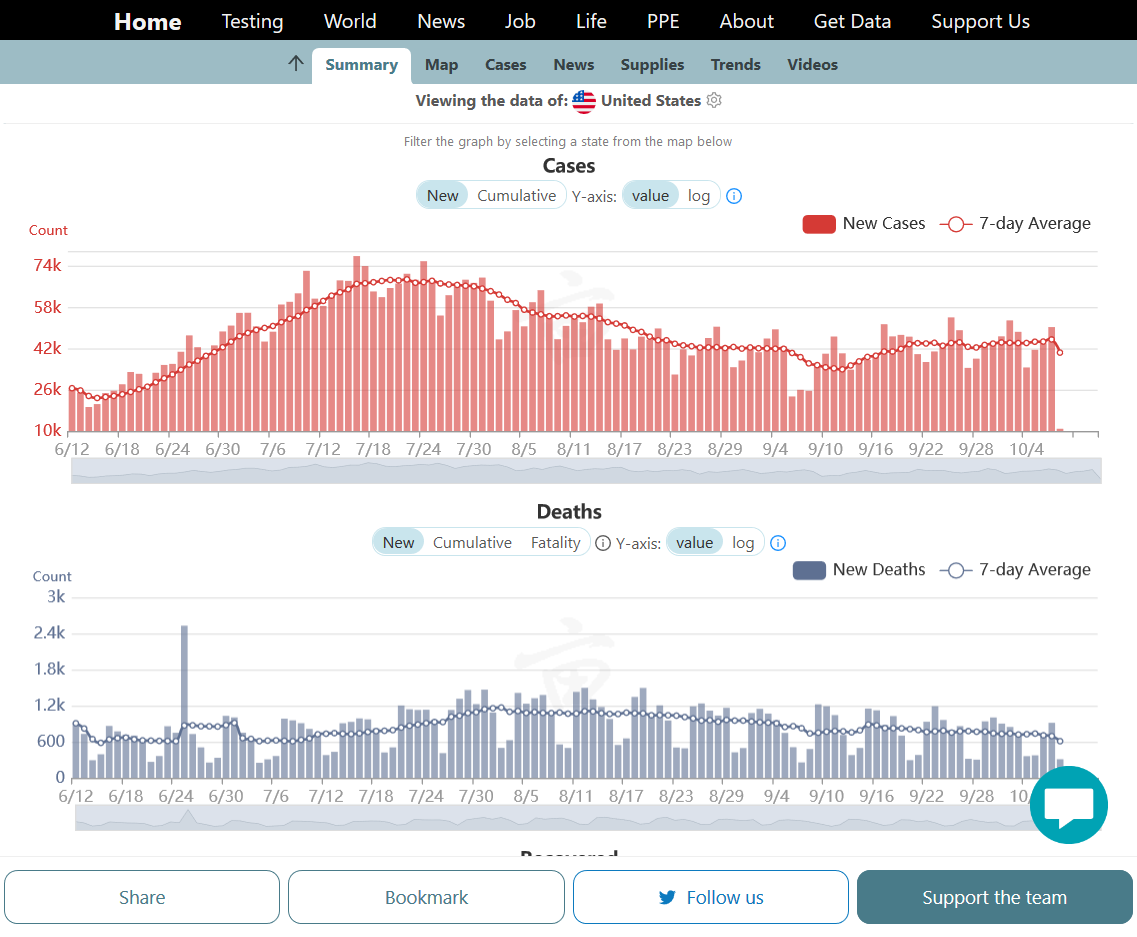
New positive cases peaked almost 3 months ago (however, they've increased slowly the past 6 weeks)...deaths also peaked(at much less than 50% of the April peak and are still not going higher) but being a lagging indicator, could go up a tad.
However, deaths per positive cases are clearly MUCH lower than there were earlier this year by something like 80% and the RATES of deaths/case are only going lower.
Find this data here: https://coronavirus.1point3acres.com/en

New positive cases have been climbing the past 6 weeks and topped the highs set back in July.
Deaths peaked in July(at much less than 50% of the April peak and are still not going higher) but being a lagging indicator, could go up a tad.
However, deaths per positive cases are clearly MUCH lower than there were earlier this year by something like 80% and the RATES of deaths/case are only going lower.
Find this data here: https://coronavirus.1point3acres.com/en
New positive cases have been climbing the past 6+ weeks and topped the highs set back in July.
Deaths peaked in July(at much less than 50% of the April peak and being a lagging indicator, have taken awhile but they are going up slightly too but still well below the previous highs.
However, deaths per positive cases are clearly MUCH lower than there were earlier this year by something like 80% lower and the RATES of deaths/case are only going lower......even as we enter the potential flu/COVID season that could feature even higher cases.
Find this data here: https://coronavirus.1point3acres.com/en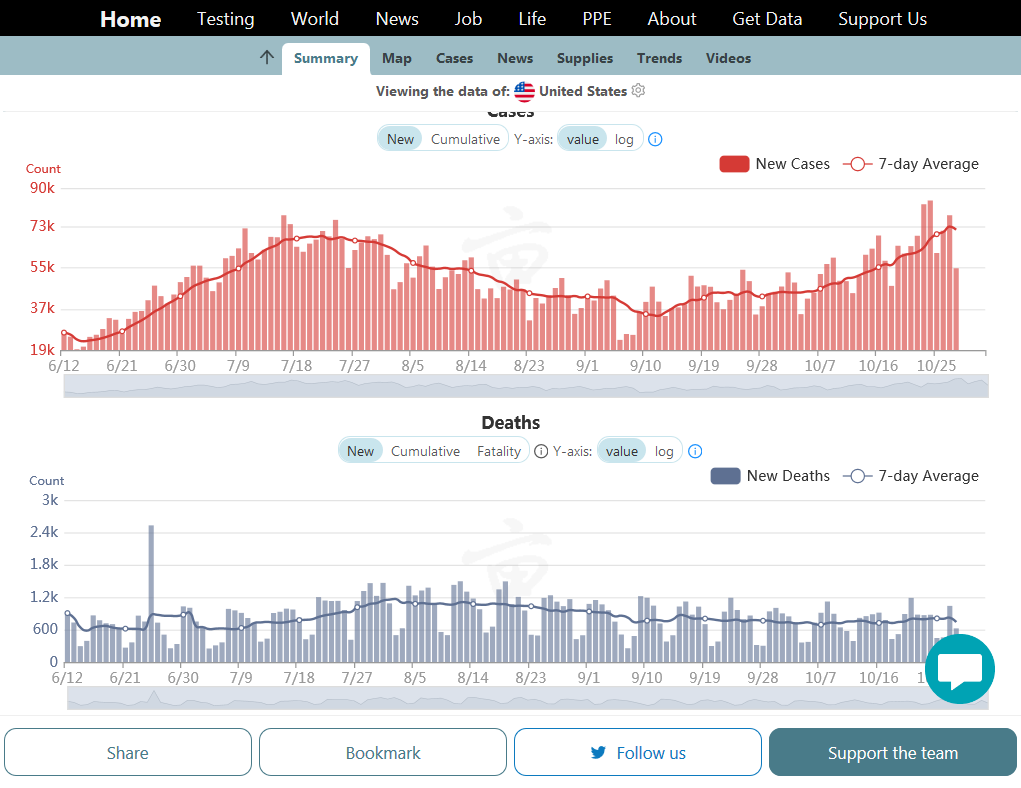
New positive cases have been climbing the past 7 weeks and topped the highs set back in July.
Deaths peaked in July(at much less than 50% of the April peak and are going up just a bit.
However, deaths per positive cases are clearly MUCH lower than there were earlier this year by something like 80% and the RATES of deaths/case are only going lower.
Find this data here: https://coronavirus.1point3acres.com/en
New positive cases have been climbing the past 7 weeks and topped the highs set back in July.
Deaths peaked in July(at much less than 50% of the April peak and being a lagging indicator, have taken awhile but they are going up slightly too but still well below the previous highs.
However, deaths per positive cases are clearly MUCH lower than there were earlier this year by something like 80% lower and the RATES of deaths/cases are only going lower......even as we enter the potential flu/COVID season that could feature even higher cases....but with slower increases in deaths.
Find this data here: https://coronavirus.1point3acres.com/en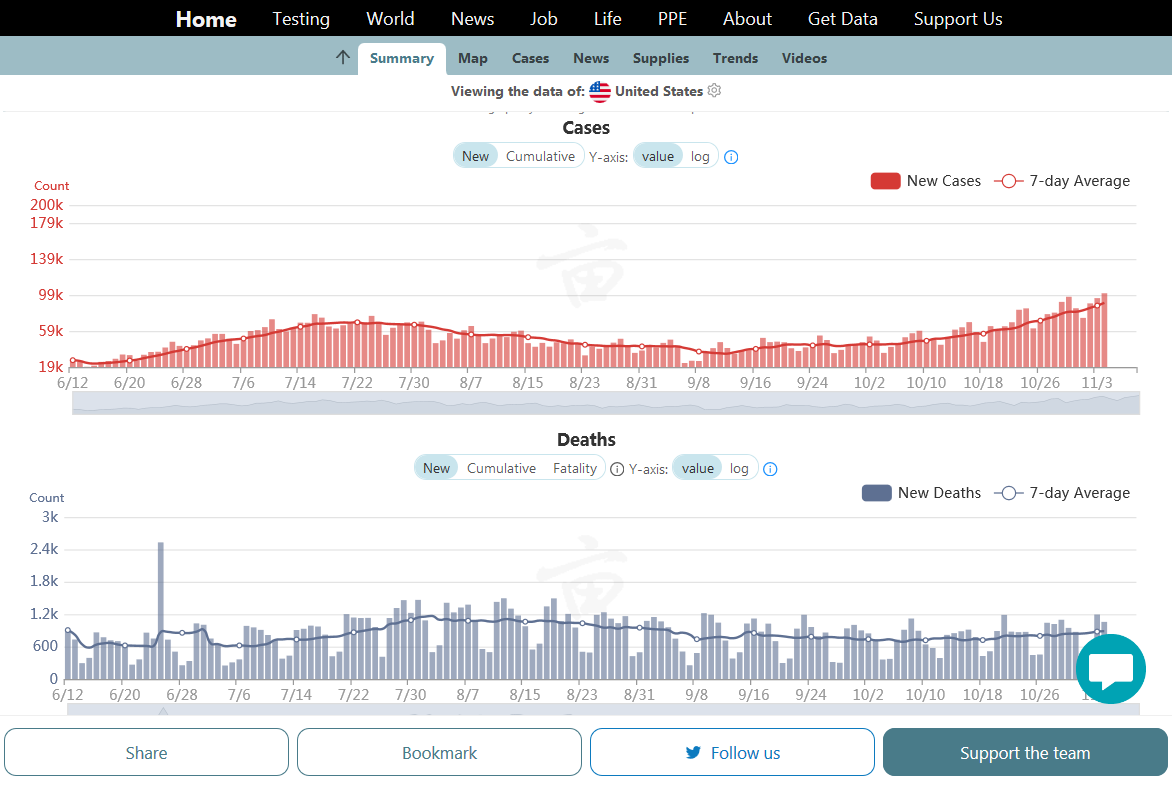
New positive cases have been climbing the past 8 weeks.
Deaths peaked in July(at much less than 50% of the April peak and being a lagging indicator, have taken awhile but they are going up slowly too but still well below the previous highs.
However, deaths per positive cases are clearly MUCH lower than there were earlier this year by something like 80% lower and the RATES of deaths/cases are only going lower......even as we enter the potential flu/COVID season that could feature even higher cases....but with slower increases in deaths.
Find this data here: https://coronavirus.1point3acres.com/en
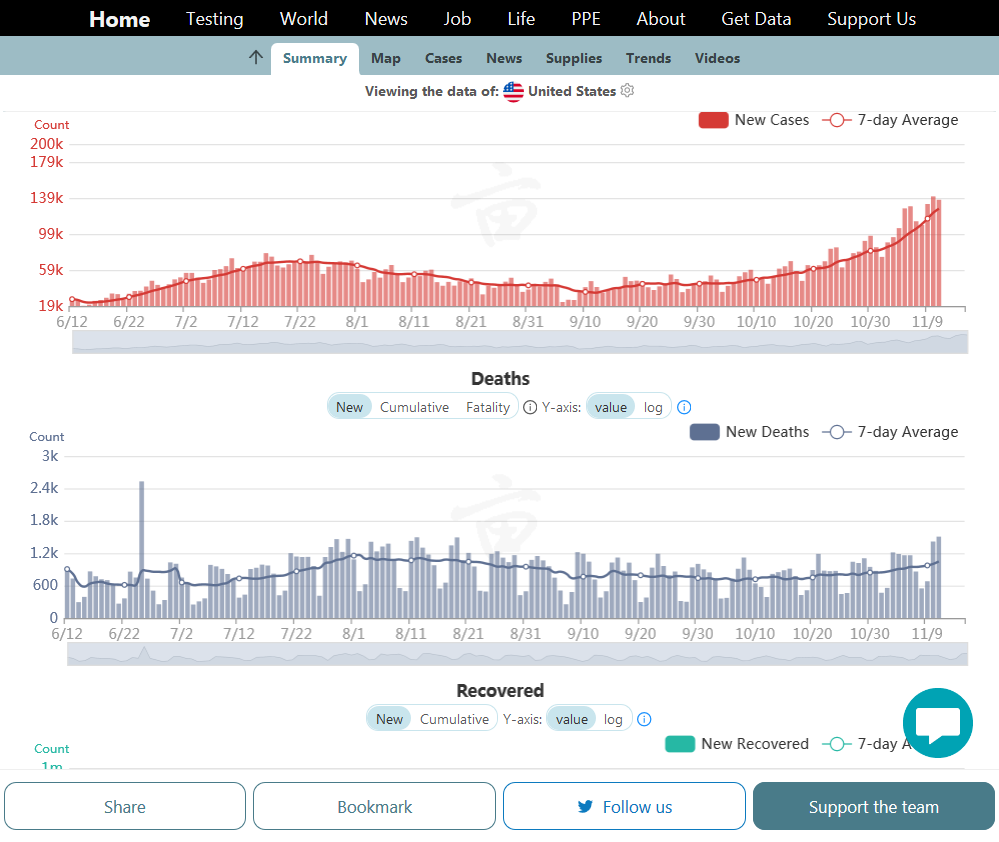
New positive cases have been climbing the past 8 weeks........now averaging over 120,000 new cases/day.
Deaths peaked in July(at much less than 50% of the April peak and being a lagging indicator, have taken awhile but they are going up slowly too but still well below the previous highs in the Spring and below the 2nd peak in the Summer but approaching the 2nd peak. Now just below 1,000/day.
Deaths per positive cases are clearly MUCH lower than there were in the Spring by something like 80% lower and the RATES of deaths/cases are only going lower......even as we enter the potential flu/COVID season that could feature even higher cases....but with a slower increase in deaths.
Find this data here: https://coronavirus.1point3acres.com/en

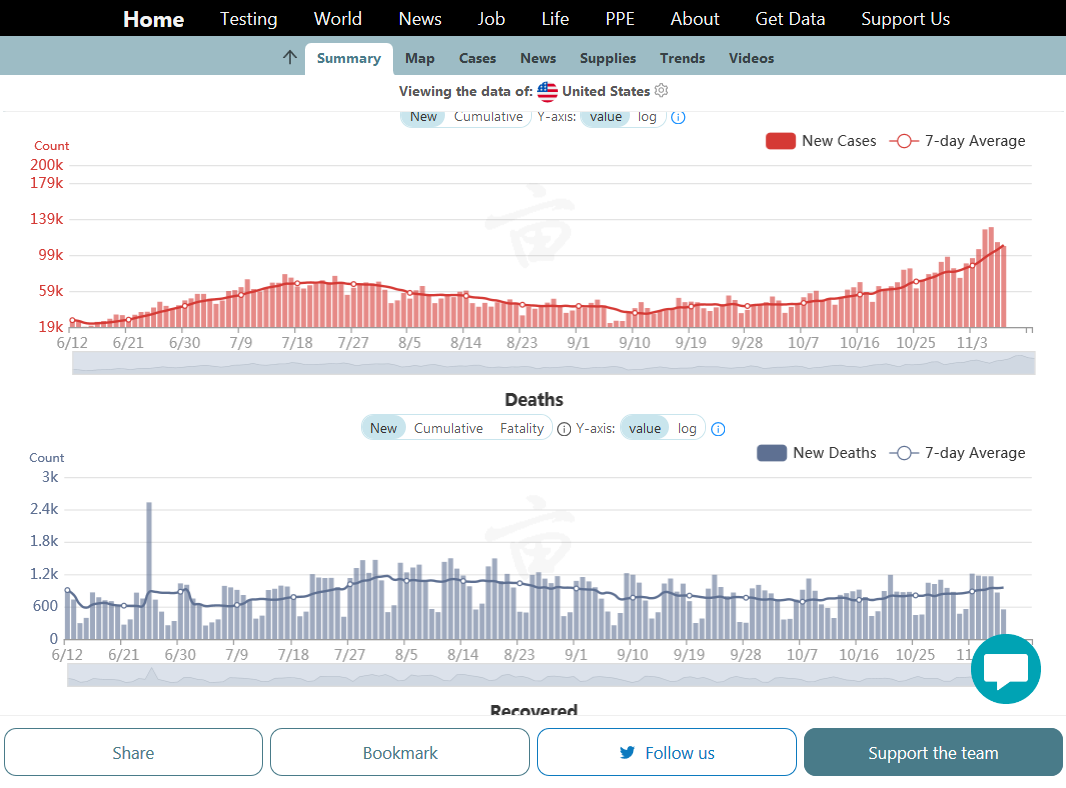
New positive cases have been climbing the past 9 weeks........now averaging over 125,000 new cases/day.
Deaths peaked in July(at much less than 50% of the April peak and being a lagging indicator, have taken awhile but they are going up too but still well below the previous highs in the Spring and below the 2nd peak in the Summer but approaching the 2nd peak. Now at around 1,000/day.
Deaths per positive cases are clearly MUCH lower than there were in the Spring by something like 80% lower and the RATES of deaths/cases are only going lower......even as we ARE IN the flu/COVID season that IS featuring even higher cases....but with a slower increase in deaths.
Hospitalizations are going higher in some places at an alarming rate though and the next couple of months could be rough!
Find this data here: https://coronavirus.1point3acres.com/en