The midday radar shows moderate to heavy showers and thunderstorms covering70% of northern Iowa and the southern third of Wisconsin. There is a second cluster of activity covering 70% of Arkansasandextends into far southeast of Oklahoma and in southeastern Kansas and northwest Mississippi. There is also some scattered activity across Eastern Tennesseenorthwest Georgia central Kentucky and southwest Ohio.
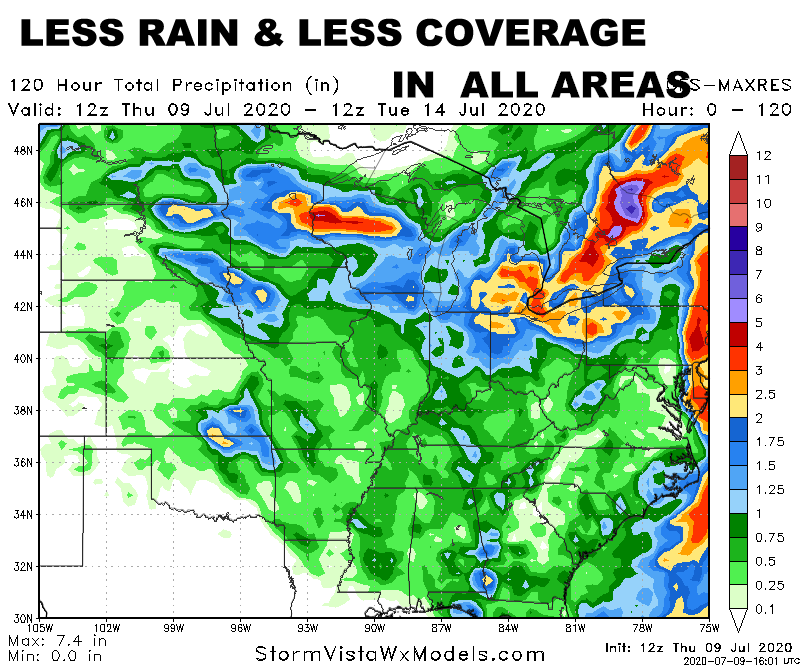
this first map is the 12z Thursday operational or regular GFS model RAINFALL forecast for the next 5 days. As you can see the rainfall amounts continue to decrease as the model goes further out in time. The GFS model does very well when it comes to producing rainfall from actual thunderstorms in a specific location. But what the GFS does not do well with is the rainfall outside of the thunderstorm. The model seems to think that if a particular location gets 2 inches / 50mm of rain ….that the rainfall gradually decreases as you go further away from the thunderstorm. That is not how thunderstorms work. You are either in the rain in the thunderstorm while you are not. This results in the GFSoften shows a lot of areas getting 0.25”/6mm..... 0.50”/ 12mm......0.75”/20mm. of rain with 50 or 60% coverage. So GFS operational model ends up producing a fairly wet looking forecast. That is exactly what the last few runs of theoperationalGFS models have been showing but todays GFSseems to have seems to have " seen the light "
This next image shows the jet stream map valid for Tuesday morning July 14th. There is a trough on the East Coast which is beginning to weaken and will move up into southeastern Canada. There was a Ridge across the southern States from Arizona to Alabama and there was a large trough that is moved into western Canada and the Pacific Northwest. Within this trough there was an upper Low in central Saskatchewan.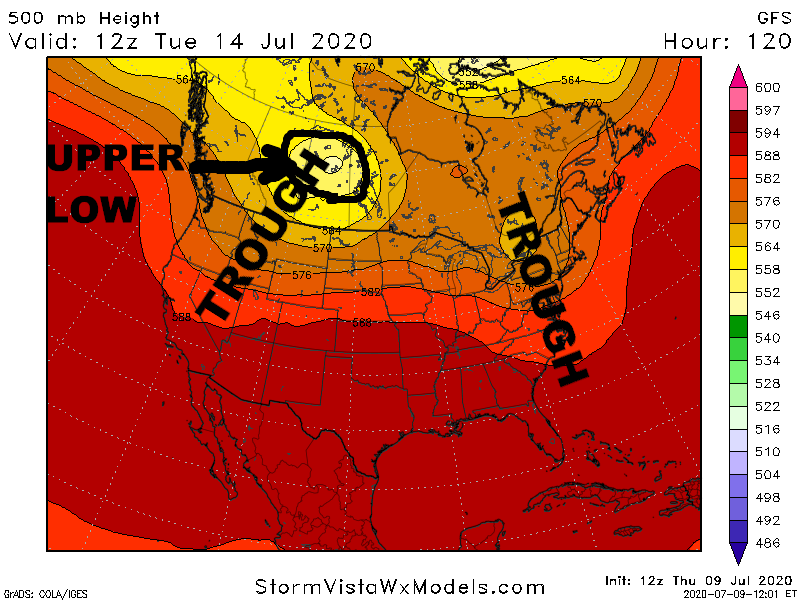
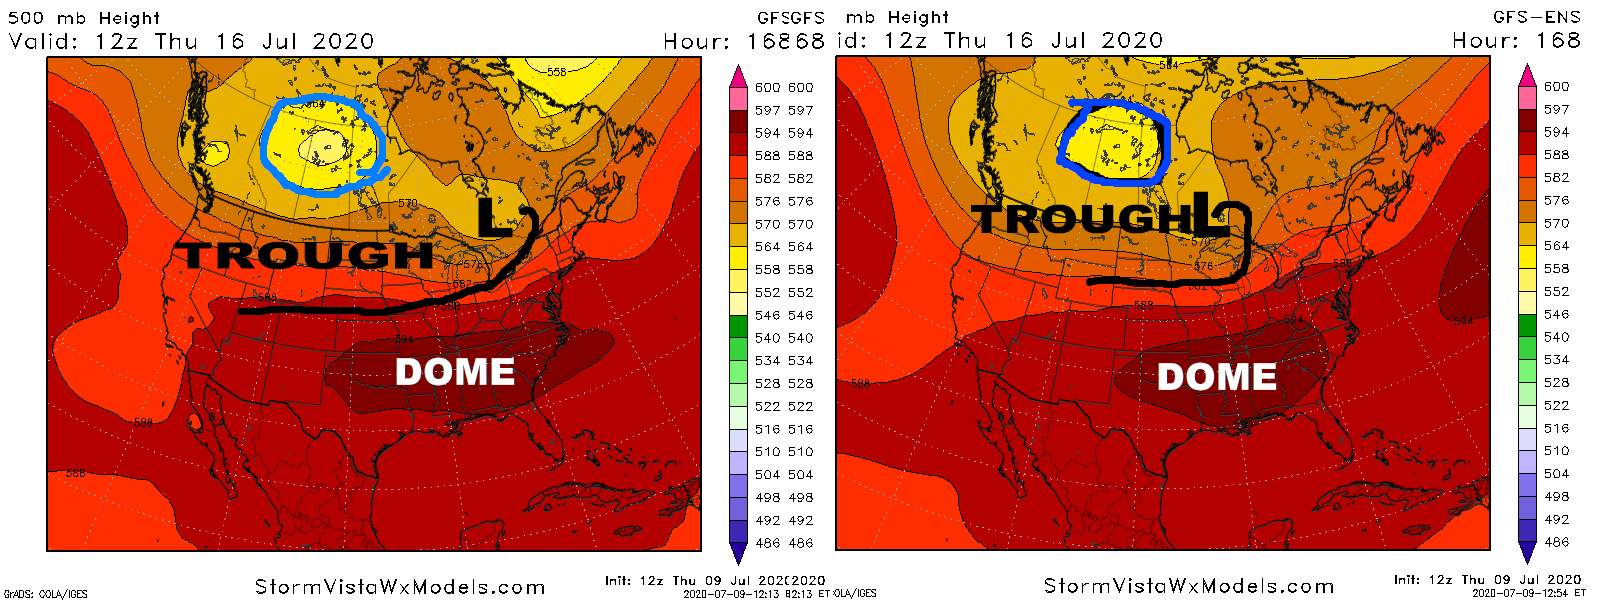
This is the problem that the GFS models are having- difficulty in handling this trough. The GFS model often over develops or intensify troughs. It is one of the flaws or biases within the model. In the weather business, this is known as the “GFSCOLD BIAS” .This image shows the jet stream maps from the operational GFS on the left side and the GFS ensemble on the right side.I have drawn in the surface LOW pressure area along the IS. Canada border and the trailing cold front. The operational GFS on the left side has a much stronger trough in Western and central Canada that pushes deeper into the upper Plains in the Great Lakes. This in turn forces the heat Dome to set up further to the South initially. It also allows cold front-- which is the thick black line I have drawn in --to push into the central Plains and the WCB … and hence more rain. The GFS Ensemble( right)has a much weaker trough with the cold front further to the north because the Dome has developed over the lower Midwest and the southern States. That means less rain in the 6-10 day in the WCB and the upper Plains
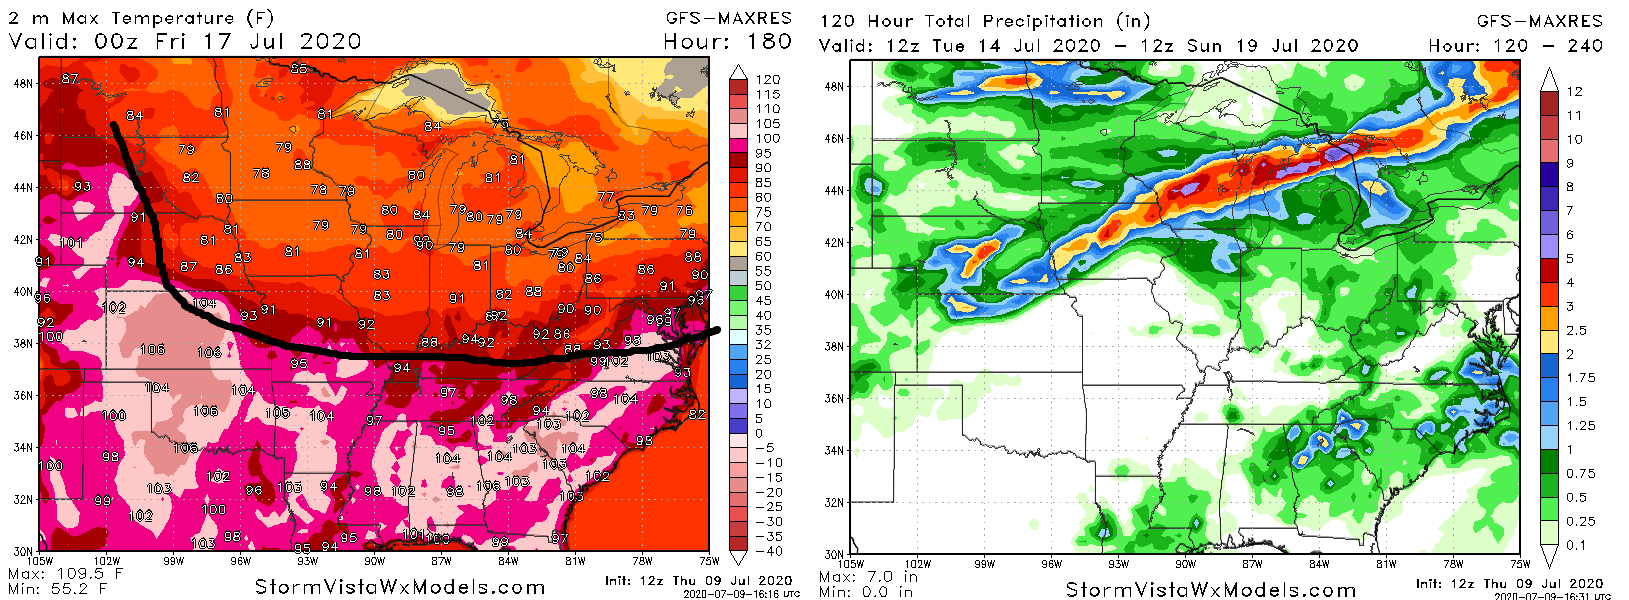
This image shows the operational GFS temperatures valid for July 16th on the left side and the rainfall for the 6 to 10Day from the operational GFS on the right side. The thick black line that I have drawn in on the temperature map is the 92 degree line. Noticed that because the cold fronts as of July 1`6 has pushed all the 92f/ 32C PLUS temperatures south of the Midwest. The central and lower Plains and Delta and the Gulf coast states are beastly hot with temperatures between 95 and 105 degrees but north of the black line the operational GFS has temperatures 92 degrees or cooler and even shows some 70s and portions of Northern Iowa Wisconsin and Minnesota. Because the cold front comes further south on the 12z Operational the GFS Model produces significant rains from eastern Nebraska to central Iowa into southern Wisconsin with amounts of 1-5”/ 25-125mm
This next image we compared the operational GFS rainfall for the 6 to 10Dwith the GFS Ensemble on the right side also for the 6 to 10D.Notice that the rain fall from the GFS Ensemble is dramatically less than it is on the operational model.
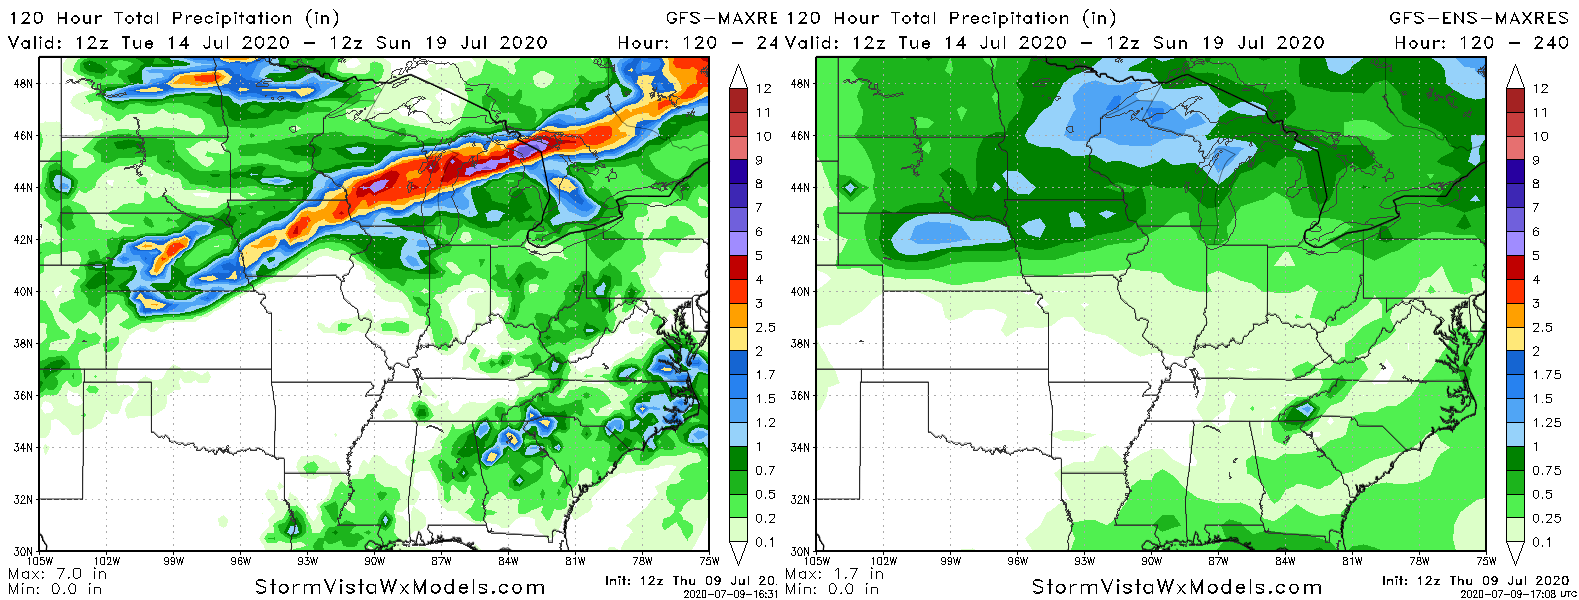
Because the 12z operational GPS solution is not supported by the GFS Ensemble or the European model I rejected it completely. It is clear in my opinion that the GFS model continues to have issues in figuring out how strong and deep the trough and upper Lowin south central Canada is going to be. This is going to cause the GFS model for flip flop back and forth for the next few days. The GFS Ensemble solution handles this aspect of the forecast much better…and I am following it with respect to temperatures and the rainfall.
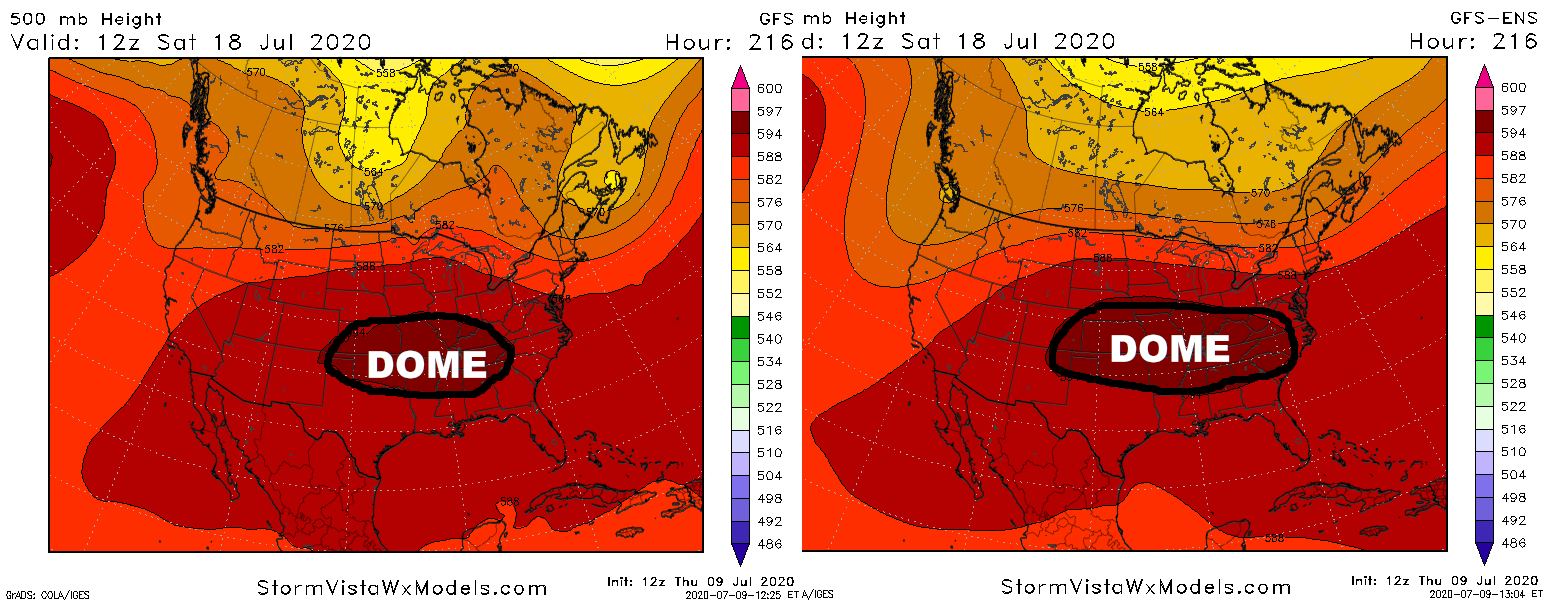
This next image compares Upper air pattern valid day 9 July 18 again with the regular GFS on the left and the GFS Ensemble on the right. Notice that the shape of the dome in the Midwest is bigger larger and a little further to the north.
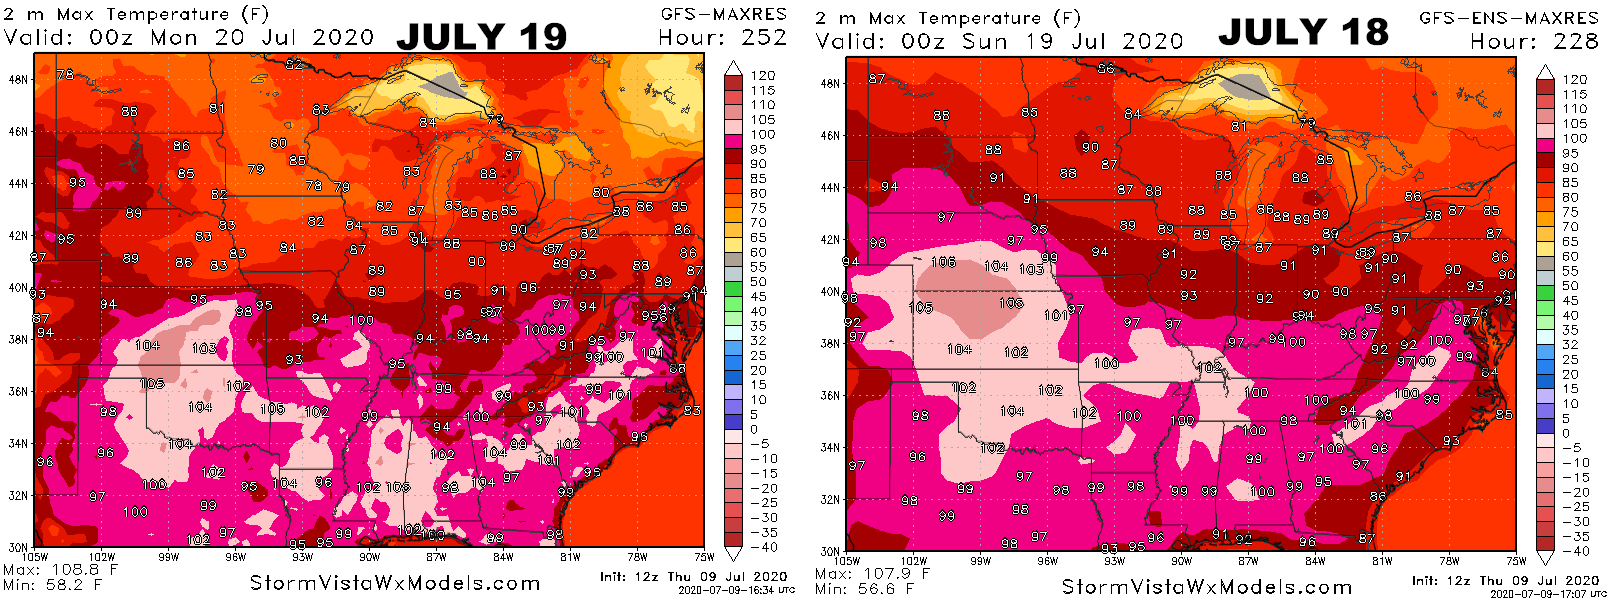
This has an impact on the temperatures. These two images show the forecast temperatures with the GFS model on the left side valid for July 19th. Notice there was a tremendous amount of heat from Interstate 70 South word but in Iowa East Nebraska the northern half of Illinois Indiana temperatures stay in the 80s.However the GFS Ensemble on the right hand side is significantly hotter with upper 90s getting into much of Missouri southwest Iowa all of Nebraska Central and Southern portions of Illinois. The GFS Ensemble continues to show this sort of impressive heat right through day 15 which takes us to July 24-25.
Update on the new European model which is just completed its cycle. The new European drives the cold front from Canada USborder intoMinnesotanorthern Iowa eastern South Dakota and Wisconsin.The Model produces a band of 1-5”/ 25-125mmn rains in east central Iowa into southern Wisconsinalong the Illinois Iowa State Line. Additional 1-2”/ 25-50mm rain how up in southern Minnesota and eastern South Dakota.
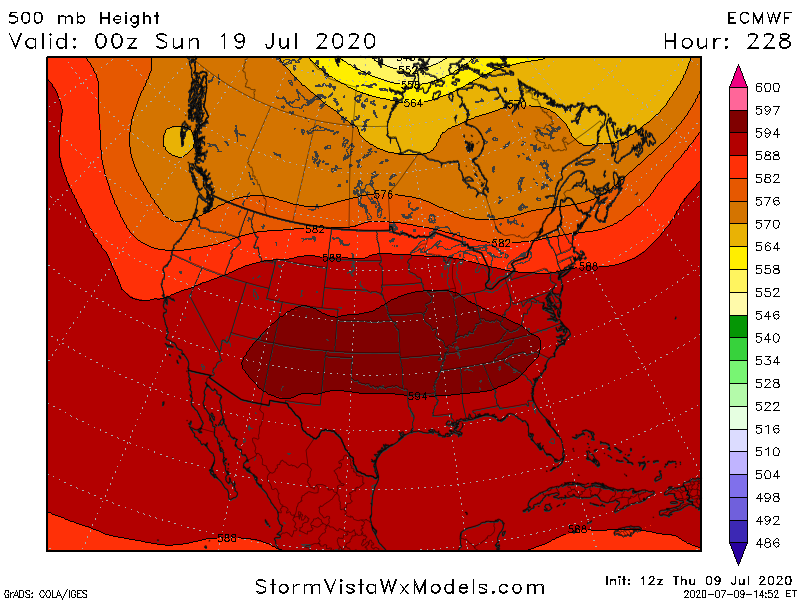
The operational European model is some pretty good agreement with the GFS ensemble. After the cold front passes southward into the Dakotas Minnesota and Wisconsin on July 14th ….TheHeat Domeexpands across the entire Deep South up to Interstate 70 then expands further north up to Interstate 80 during the 6-10 day. The result is that the European has a classic textbook heat Dome pattern covering the entire central PlainsandMidwest by day 10.
The model again produces max temperature is greater than 100 degrees and much of Iowa Kansas-Nebraska Illinois Indiana Ohio Kentucky Tennessee Arkansas Oklahoma Kansas Eastern Colorado. This is probably too warm by several degrees but if the upper Patton is cracked and the ground conditions continue to dry out it's possible that some areas underneath the heat Dome will break 100 degrees during this time frame.
lot's info there. But unfortunately most of it is just like the covid info we been forced to listen to for months........worthless. I have taken an accurate shortcut lately and been watching the bam-x guys. They have been right on this weather. They wetter in the drought stricken eastern corn belt the next few days but this heat is going nowhere fast. Latter 1/2 of July much like the first 1/2.
mcfarm,
Would you like to share some of that bamwx with us!?
Pretty please??
Thanks wxdavid
Agree cutworm!
https://www.marketforum.com/forum/topic/55499/
Re: ABOUT THE UPCOMING HEAT WAVE
By metmike - July 9, 2020, 5:20 p.m.
"Dave made a wonderful weather post on the trading forum just now"
https://www.marketforum.com/forum/topic/55500/
MY THOUGHTS ON THE UPCOMING HEAT WAVE
1 response |
Started by wxdavid - July 9, 2020, 5:07 p.m.
Now I know that mcfarm is a serious issues with reality. First there forecasts for the summer and mine have been identical.
2nd last year they went for a pretty big drought and it never stopped raining.
"First there forecasts for the summer and mine have been identical."
Dave,
Their forecast for the Summer has been for northwest flow and pretty good rains with no major problems with the heat ridge in the main Cornbelt......I think and mcfarm knows more about that.
That's not what I got from your forecasts........since you are bringing it up.
With regards to my forecast, this was about the only time in my life I gave a long range forecast but its definitely much closer to yours, especially with the heat which I have been confident in the form of a major dome..............somewhere.
At this point, the dome looks most likely to be centered in the S.Plains but unlike you and other paid services, I don't have to try to be more specific(which is what people pay for) when the guidance suggests a major potential margin of error.
The pattern coming up will be a very tricky one with an extreme contrast in rains possible.
There is a huge difference in the amount of rains in the belt. Northern half or so maybe good rains. Southern half of so, maybe no rains but some models take the rains much farther south......CMC model and GFS model.
The European model below is the most bullish.
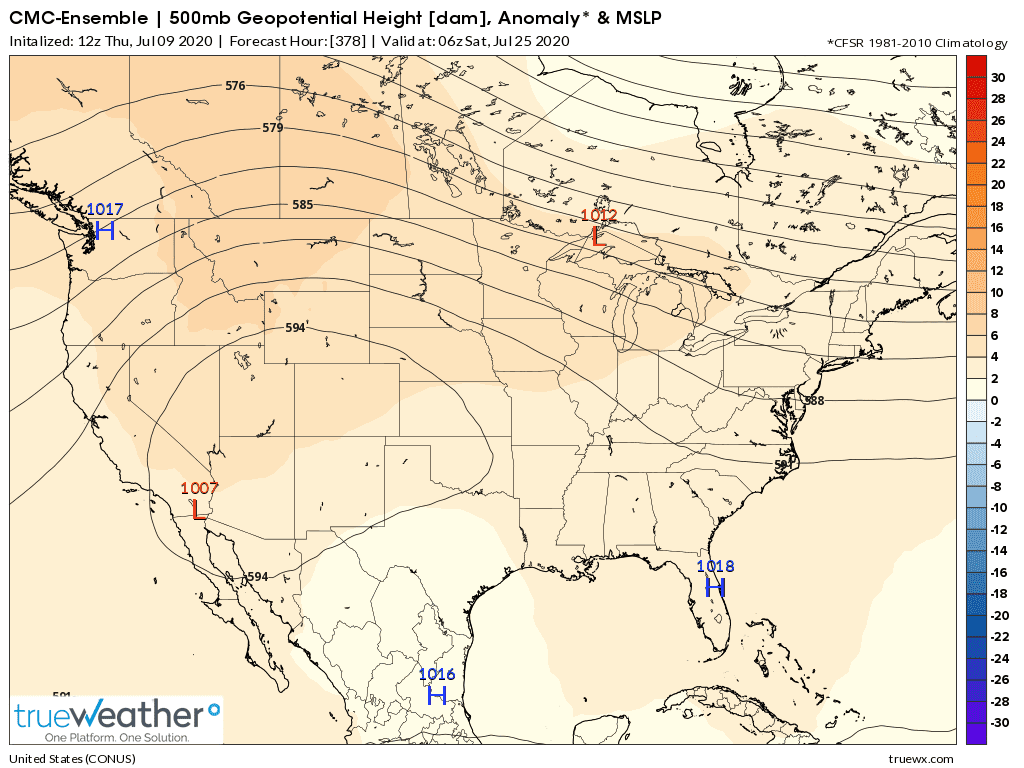
Below that is the last run of the CMC model....northwest flow and bearish for the rains farther south.
Regardless, there will be high heat and if it lasts into August, corn yields, even in IA will not set a record. Too much heat fill conditions.
In places farther south or that are dry they will drop by double digits.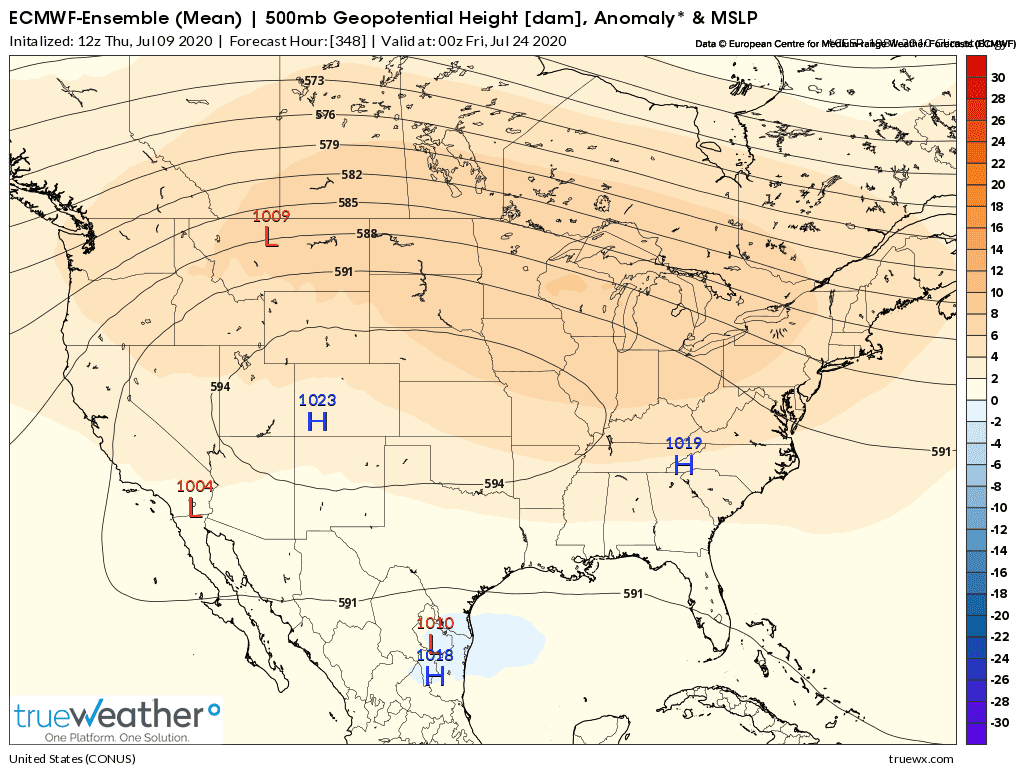
++++++++++++++++++++++++++++++++++++++++++++
Heat fill coming up for corn
Started by metmike - June 25, 2020, 7:52 p.m.
Good chance that tonight, the market will trade this developing rain event. The more of IL/IN/OH get hit, the more bearish............and more bullish if most places miss. Most of IN/OH is hurting BAD right now. We got lucky here in the far south and the entire are in the far sw corner of Indiana has EXCELLENT crops.
 | NOAA/NWS Storm Prediction Center Severe thunderstorms with wind damage, isolated large hail and a tornado or two will be possible this afternoon and evening in parts of the mid Missouri Valley. www.spc.noaa.gov |
https://radar.weather.gov/Conus/index_loop.php
| NWS - Enhanced Doppler Radar National Mosaic Loop Base Reflectivity: Full resolution version loop (3400x1700 pixels - 2.2mb): Time of images: 2208 UTC 07/07/2020 through 2328 UTC 07/07/2020 radar.weather.gov |
Full resolution version loop (3400x1700 pixels - 2.2mb) | Time of images: 2208 UTC 07/09/2020 through 2318 UTC 07/09/2020 |

Go to: Most Recent Image
https://radar.weather.gov/Conus/centgrtlakes_loop.php
Base Reflectivity | |
| Full resolution version loop (3400x1700 pixels - 2.2mb) | |

Go to: Most Recent Image
AS OF 1215 PM EDY 7/10/20
this first map shows 12 hours rain from this storms moving through northern IA southern MN and WI ending at 9pm 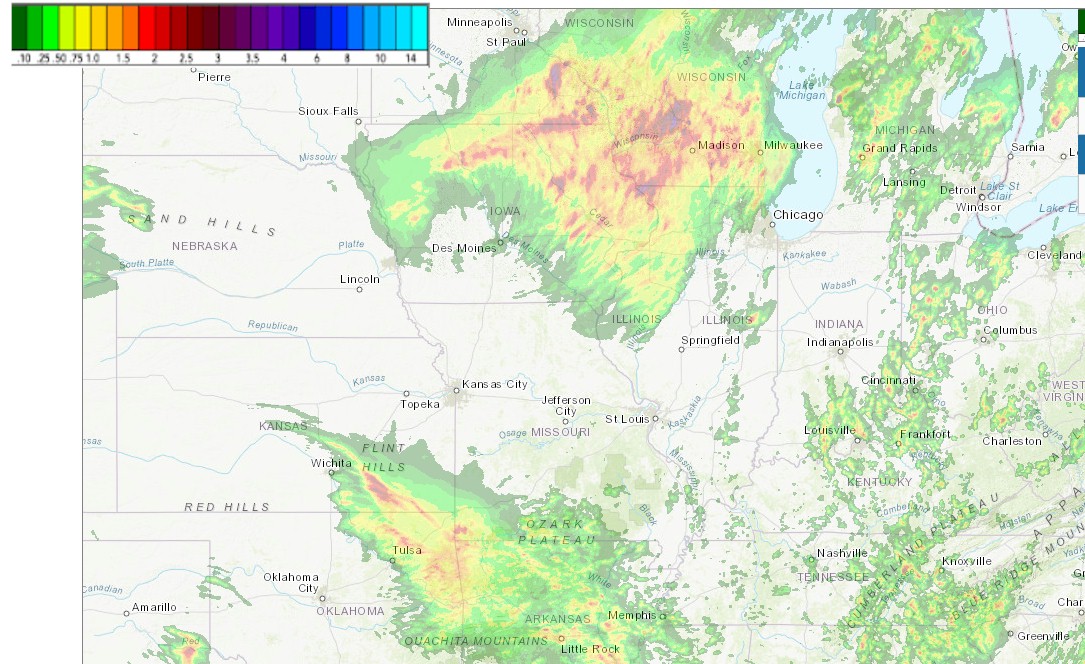
this 2nd map is the last 3 hours total rainfall ending as of 1201 edt 7/10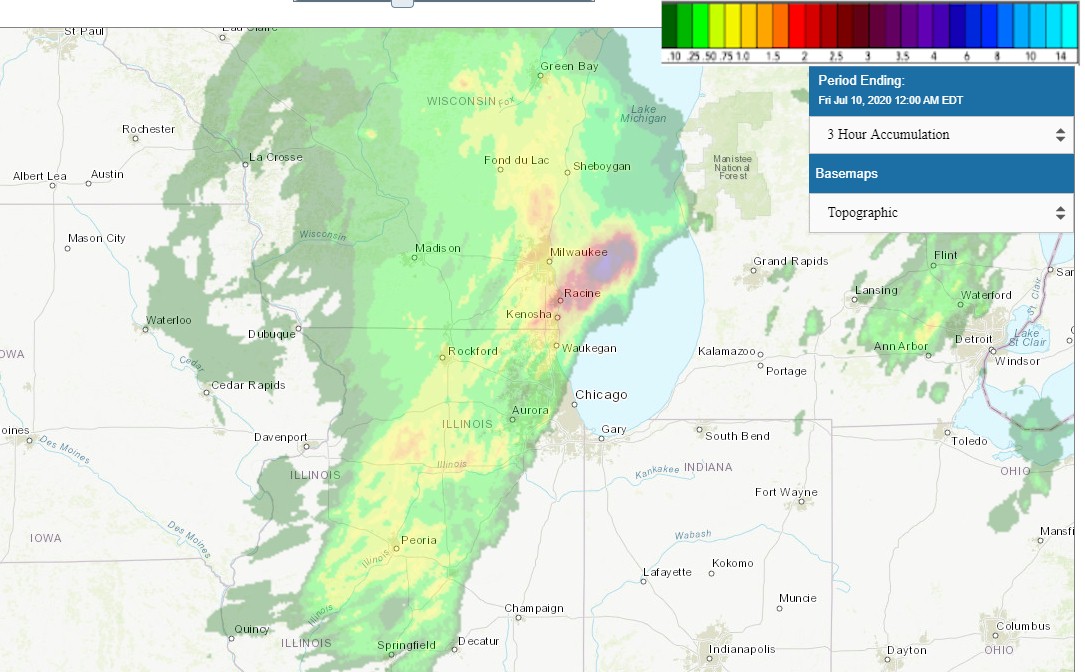
David
Truly an expert putting forth a well prepared report. Well done. Timely, factual, AND then personal guidance with proper 'guarded' opinion language. Much appreciated.
FWIW--3/4 inch at I80/RT 71, LaSalle County last night. Appreciated by most (not speculators!)
Will be interesting to see what impact the 11am report has on grains---then back to weather.
When is/are next major weather updates?