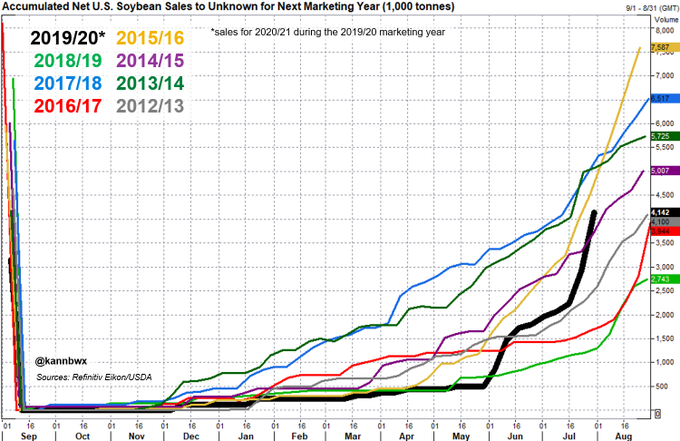
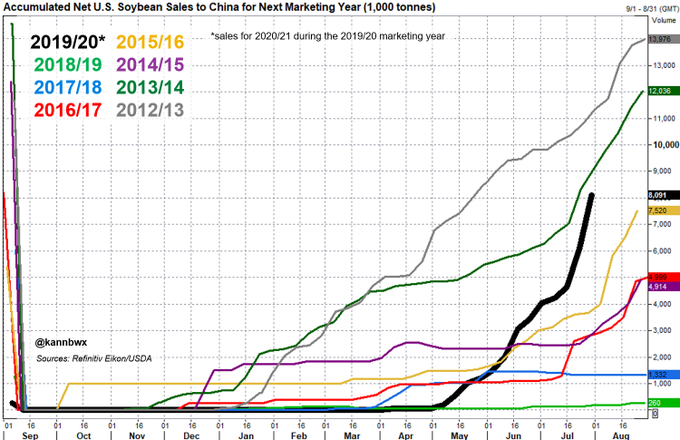
china back for more beans this am....guess they either need them bad or not that pissed about the embassy
chin a back for more beans this am....guess they either need them bad or not that pissed about the embassy
Thanks mcfarm!
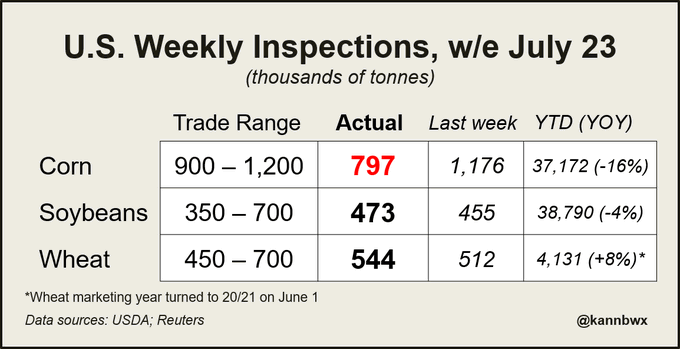
Here's the chart of the numbers. Corn was off a bit.
Export inspections fell below expectations for #corn last week, but -16% YOY is about the best it's been all year.
#Soybeans are now at -4% YOY (fewer recent shipments to #China). 136kt went to China last week.
#Wheat is up 8% YOY early on in the 20/21 year.
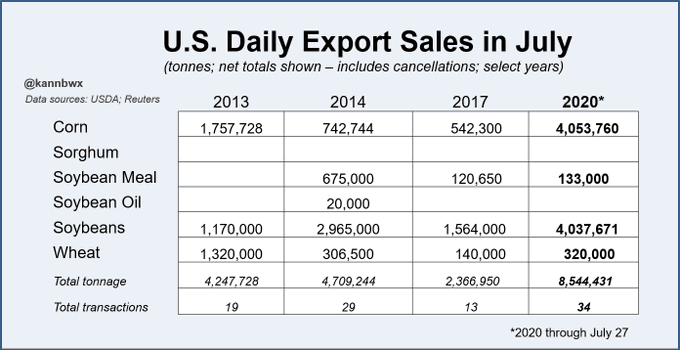
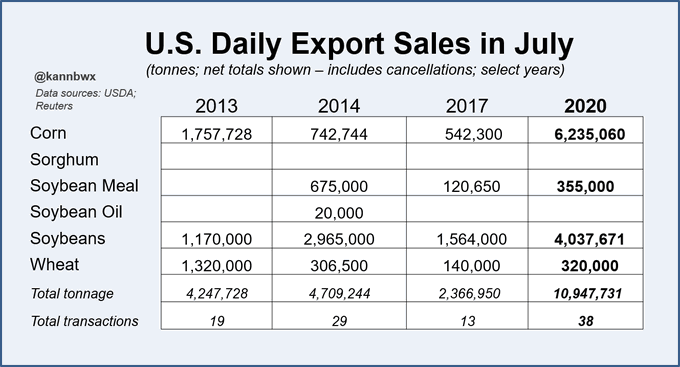
Through Monday, USDA has flashed 8.5 million tonnes of U.S. grain & oilseed sales in July. Added 2013 to this table & isolated years w/ daily July sales > 2 mmt. 2020 still a huge standout, esp. in #corn & #soybeans. But #wheat was big in 2013 (3 diff sales, all to #China).
·
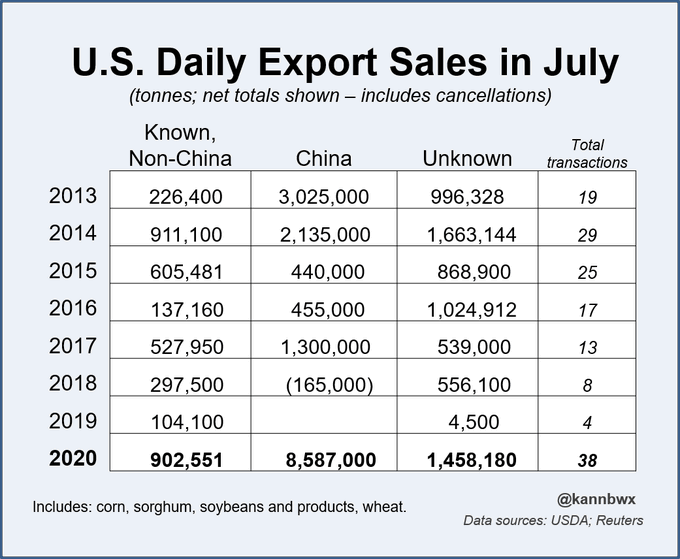
#China was 71% of the daily sales in July 2013, though they have been 78% of the July 2020 daily sales so far. July 2020 sales to non-China have caught up to normal levels over the last couple days.
I know this is redundant and I keep posting it, but very important to clarify. Actual commodity sales are LARGER than what is listed in the tables. These are just the DAILY announcements (single sales of larger amounts that must be reported separately).
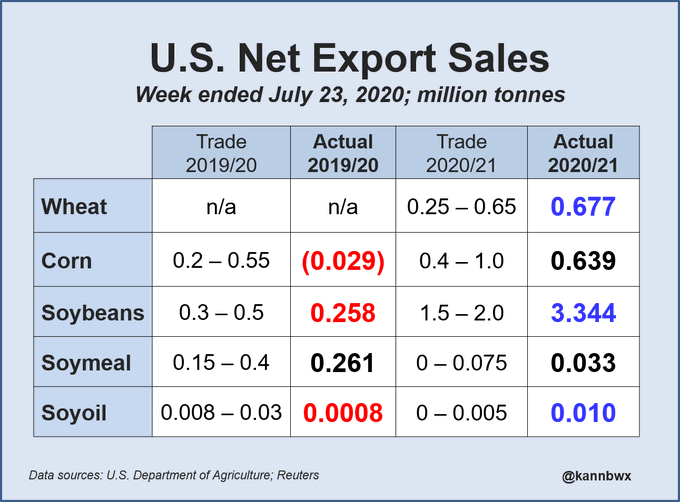
Export sales:
Here's the full table showing all recent years in case you want to compare.
In the previous table I was highlighting just the prior years with the larger sales (2017, 2014, and 2013-not shown in this table).
Tracking the daily sales in addition to the full weekly sales is helpful because it shows you the number and total tonnage of the larger single purchases. More daily sales generally means more sales overall. The United States had a record-breaking July in terms of corn/soy sales.
If you like bushels, here are the July 2020 daily sale totals: #Corn 245.5 mln bu#Soybeans 148.4 mln bu#Wheat 11.8 mln bu Total bulk commods (didn't include soymeal): 406 mln bu