From Natural Gas Intelligence
July Natural Gas Looks to Recover From Two-Day Losses Ahead of Open
9:00 AM
July natural gas prices were set to open Wednesday about 3 cents higher at $2.931 amid small increases in cooling demand in the near term and sustained strong demand expected to end June and bring in July. Read More
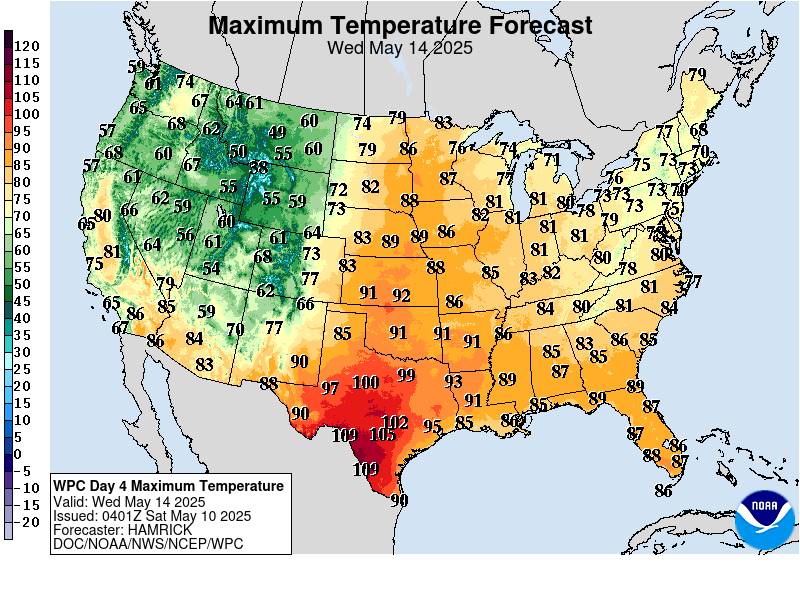
Temperatures cooled off now in the Upper Midwest and cooling spreads south:


Highs days 3-7 shows pleasant temps, then warming back up.


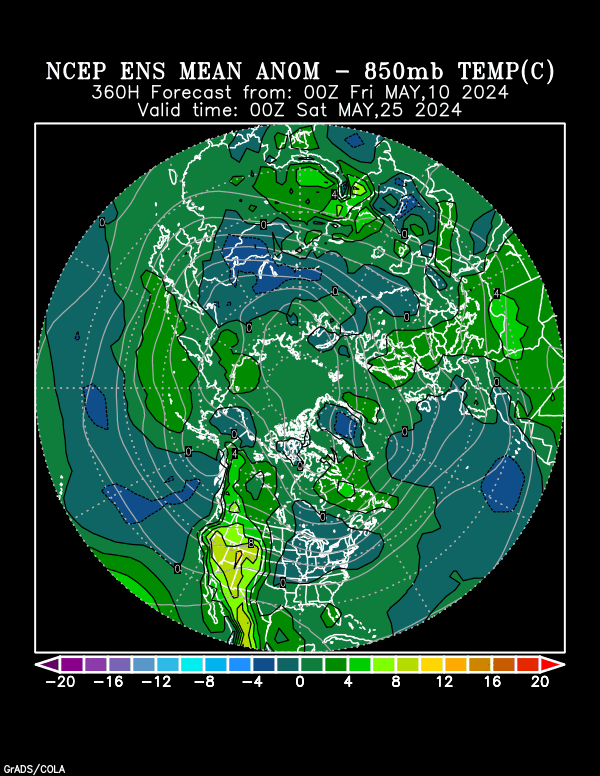
Late Week 2 heat anomolies:

CFS weeks 3 and 4 really heats things up.

Turns drier in some places

Here are the numbers from last Thursday's EIA storage report....+96 bcf(billion cubic feet). This was considered bearish, so we spiked down briefly but closed strong and made new highs Fri and Sunday evening........on heat.
| Working gas in underground storage, Lower 48 states Summary textCSVJSN | |||||||||||||||||||||||||
|---|---|---|---|---|---|---|---|---|---|---|---|---|---|---|---|---|---|---|---|---|---|---|---|---|---|
| Historical Comparisons | |||||||||||||||||||||||||
| Stocks billion cubic feet (Bcf) | Year ago (06/08/17) | 5-year average (2013-17) | |||||||||||||||||||||||
| Region | 06/08/18 | 06/01/18 | net change | implied flow | Bcf | % change | Bcf | % change | |||||||||||||||||
| East | 377 | 351 | 26 | 26 | 486 | -22.4 | 490 | -23.1 | |||||||||||||||||
| Midwest | 372 | 341 | 31 | 31 | 631 | -41.0 | 533 | -30.2 | |||||||||||||||||
| Mountain | 125 | 121 | 4 | 4 | 176 | -29.0 | 150 | -16.7 | |||||||||||||||||
| Pacific | 239 | 231 | 8 | 8 | 273 | -12.5 | 286 | -16.4 | |||||||||||||||||
| South Central | 800 | 773 | 27 | 27 | 1,131 | -29.3 | 961 | -16.8 | |||||||||||||||||
| Salt | 252 | 245 | 7 | 7 | 348 | -27.6 | 288 | -12.5 | |||||||||||||||||
| Nonsalt | 547 | 528 | 19 | 19 | 783 | -30.1 | 673 | -18.7 | |||||||||||||||||
| Total | 1,913 | 1,817 | 96 | 96 | 2,698 | -29.1 | 2,420 | -21.0 | |||||||||||||||||
Comparison of temps from previous weeks report to the following week to use to guess tomorrows injection number.
These were the temperatures that corresponded to that 7 day period on that EIA storage report of +96 bcf.

The next 7 day period, ended last Friday and corresponds to the period which will be used for tomorrow's EIA number. It will be based on the period below:
From DJ news today:
"The U.S. Energy Information Administration is expected to report that
storage levels rose by 84 billion cubic feet of gas during the week ended June
15, according to the average forecast of eight analysts, brokers and traders
surveyed by The Wall Street Journal."
A +84 would be 12 less than last week's +96 but on 8 more CDDs...so pretty comparable.
On a CDD equivalent basis at this time of year, a +84 would be:
- ~20-25 more bearish than 2017 and 2016, both of whih had far more storage
- pretty comparable to 2015 and 2013
- ~20-25 more bullish than 2014, which at the time was having a very long string of 100+ injections
Based on the above, I'd call a +84 ~4-5 bcf looser than the average supply/demand balance of the last 5 years near the same time of year (late spring/early summer). Assuming about the same # of CDDs/HDDs for the next 21 weeks as the average CDDs/HDDs of the last 5 years and considering the current 507 bcf deficit to the 5 year average, the next 21 weeks will need to average 24 bcf/week larger than the 5 year average to get 11/2/18 storage to the 5 year average. So, the current supply/demand balance is nowhere near that. If now through September were to be hotter (cooler) than that 5 year average, more (less) than that 24 bcf/week excess would be needed. Afterward, in October, HDDs normally become a bigger factor than CDDs. Of course, we have to see if the actual tomorrow will be near that +84 average guess.
My guess: I think that DJ News survey is a little low. So, I'm guessing +86 bcf.
Thanks much Larry!
If storage wasn't so low, I would be guessing lower than the average guess.
But it is low and they will likely be cranking it out to fill up storage between now and the end of the year. Last week was a bearish surprise but just one week.
I don't have a good reason to differ from your guess but will say +87 bcf just to have a different one than you and the markets.
From Natural Gas Intelligence:
July Natural Gas Rebounds Ahead of Thursday’s EIA Storage Report; Spot Gas Mixed
July natural gas futures snapped a two-day losing streak on Wednesday, jumping 6.4 cents to settle at $2.964