
Here is the latest radar image. You can see the upper level low circulation spinning in the Eastern Cornbelt.

Let take a closer look below:
Go to: Most Recent Image
Rains the past 24 hours......lots of it in the Eastern Cornbelt..........following the forecasts.![]()
You can go to this link to see rain totals from recent time periods:
https://water.weather.gov/precip/
Go to precipitation, then scroll down to pick a time frame. Hit states to get the borders to see locations better. Under products, you can hit %normal.
Most importantly........forecast rains.
Rains the next 7 days .........dumping on the Western Cornbelt but also much of the country............... rain makes grain still but when are the rains dialed in and we trade the week 2 dome? Soon?
Day 1:
http://www.wpc.ncep.noaa.gov/qpf/fill_94qwbg.gif?1526306199054
Day 2:
http://www.wpc.ncep.noaa.gov/qpf/fill_98qwbg.gif?1528293750112
Day 3:
http://www.wpc.ncep.noaa.gov/qpf/fill_99qwbg.gif?1528293842764
Days 4-5:
http://www.wpc.ncep.noaa.gov/qpf/95ep48iwbg_fill.gif?1526306162
Days 6-7:
http://www.wpc.ncep.noaa.gov/qpf/97ep48iwbg_fill.gif?1526306162
Total accumulation
http://www.wpc.ncep.noaa.gov/qpf/p168i.gif?1526397762
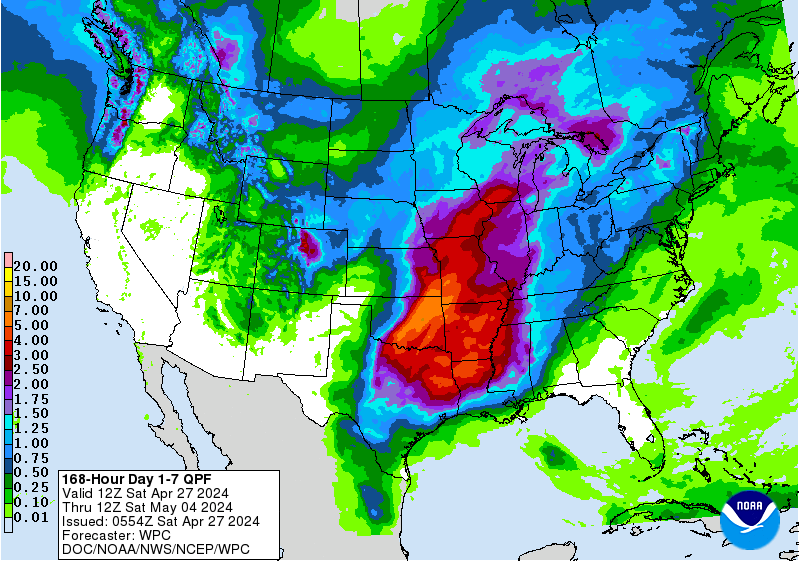
Some areas for excessive rains.......farther east and south than before.......then back in the Central Plains with the new system.
Excessive rain threat too
Current Day 1 Forecast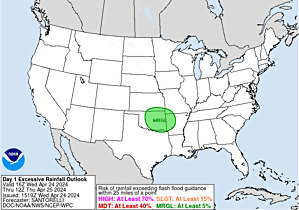 Valid 15Z 06/11/18 - 12Z 06/12/18 |
Day 1 Threat Area in Text Format
| Day 2 and Day 3 Forecasts |
Current Day 2 Forecast Valid 12Z 06/12/18 - 12Z 06/13/18 |
Day 2 Threat Area in Text Format
Current Day 3 Forecast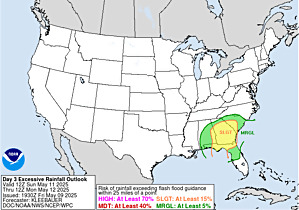 Valid 12Z 06/13/18 - 12Z 06/14/18 |
Severe Storm Risk. Use the link for full screen.
https://www.spc.noaa.gov/products/outlook/
Current Day 1 Outlook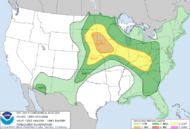 | Forecaster: Hart/Kerr Issued: 18/1240Z Valid: 18/1300Z - 19/1200Z Forecast Risk of Severe Storms: Slight Risk |
Current Day 2 Outlook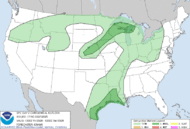 | Forecaster: Bunting Issued: 18/0600Z Valid: 19/1200Z - 20/1200Z Forecast Risk of Severe Storms: Marginal Risk |
Current Day 3 Outlook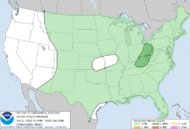 | Forecaster: Bunting Issued: 18/0731Z Valid: 20/1200Z - 21/1200Z Forecast Risk of Severe Storms: Marginal Risk |
Current Day 4-8 Outlook | Forecaster: Bunting Issued: 18/0856Z Valid: 21/1200Z - 25/1200Z Note: A severe weather area depicted in the Day 4-8 period indicates a 15%, 30% or higher probability for severe thunderstorms (e.g. a 15%, 30% chance that a severe thunderstorm will occur within 25 miles of any point). |
Temperatures cooled off now thru the Midwest and East:


Highs days 3-7 shows pleasant temps Upper Midwest, then warming back up.

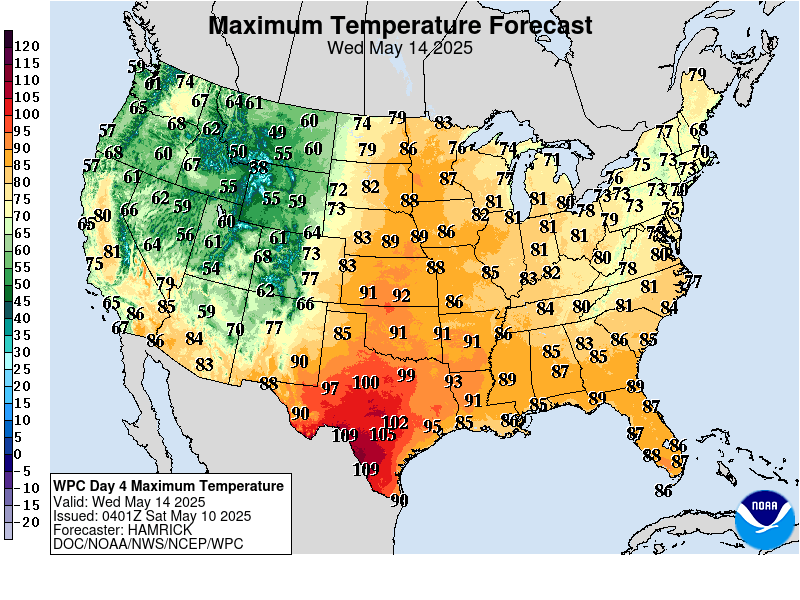


Heat ridge much farther west on latest guidance...........nw flow and upper level trough in Northeast US.
Last 6Z GFS:
gfs_namer_312_200_wnd_ht | gfs_namer_312_500_vort_ht |
gfs_namer_312_1000_500_thick | gfs_namer_312_850_temp_ht |
Late Week 2 heat anomalies.....farther west today.
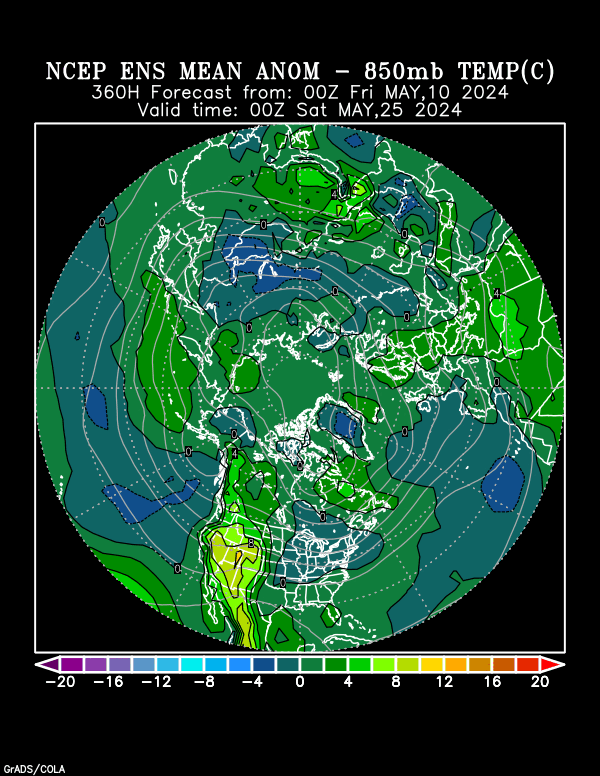
CFS week 3 and 4...........MUCH cooler than it has been in a long time......especially Northeast.
Still some heat SCentral and West.

Turns drier in some places

I would be in the .1 inch range so far for my part of NE Ohio.
Jim,
You got ripped off (-:
My rain gauge measured 1.35 on top of .25 the other day. Rains don't come better than this around here in June. Hopefully, you'll get a decent one later today.
What county do you live in Jim?