Hello September 6th
Iowa finally gets a huge rain early this week..........but its too late to help the crop much now. It will slow early corn harvesting down a bit in the central cornbelt but not excessive or damaging.
Cool period coming up but not quite cold enough for a freeze next week, outside of the High Plains on Tue/Wed.................see low temps below. Probably warming back up in week 2 but not anomalous heat.
Freeze Watch September 2, 2020-
https://www.marketforum.com/forum/topic/58606/
Latest COVID-19 numbers. ..........new positive cases peaked OVER a month ago....deaths also made a 2nd peak(at much less than 50% of the April peak).
https://www.marketforum.com/forum/topic/55092/
Scroll down and enjoy the latest comprehensive weather to the max...... occurring because of the natural physical laws in our atmosphere as life on this greening planet continues to enjoy the best weather/climate in at least 1,000 years(the last time that it was this warm) with the added bonus of extra beneficial CO2.
Reasons to keep being thankful here in 2020!
https://www.marketforum.com/forum/topic/45623/
Go to the link below, then hit the location/county on the map for details.
https://www.spc.noaa.gov/ Go to "hazards"
Here are the latest hazards across the country.
 |
Purple/Pink/blue on land is cold/Winter weather. Brown is wind, Green is flooding. Gray is fog. Reddish is a red flag advisory.
Go to the link below, then hit the location/county on the map for details.
https://www.spc.noaa.gov/ Go to "hazards"
https://www.mesonet.org/index.php/weather/map/us_air_temperature/air_temperature

https://www.mesonet.org/index.php/weather/map/wind_chill_heat_index1/air_temperature

Current Weather Map
| NCEP Days 0-7 Forecast Loop | NCEP Short-Range Model Discussion | NCEP Day 3-7 Discussion |


Current Jet Stream

| Low Temperatures Tomorrow Morning |

Highs today and tomorrow.


Highs for days 3-7:
Chilly start next week, to the middle of the week, then gradually warming back to normal.
Hot in the West, still very warm Southeast until late week.


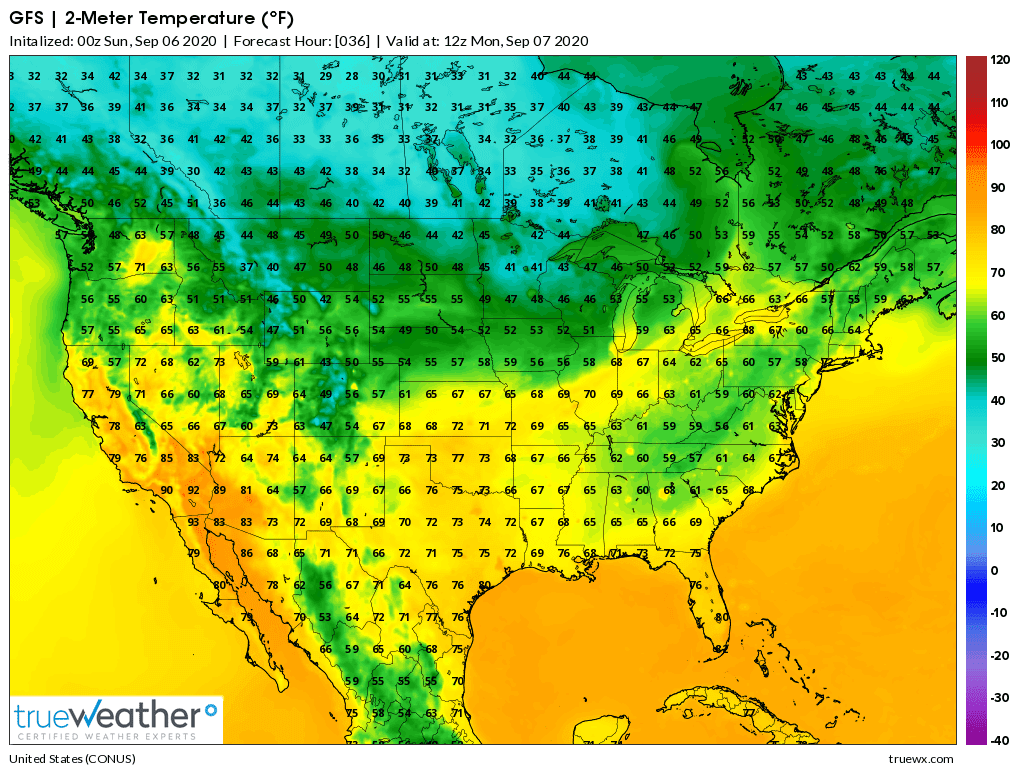
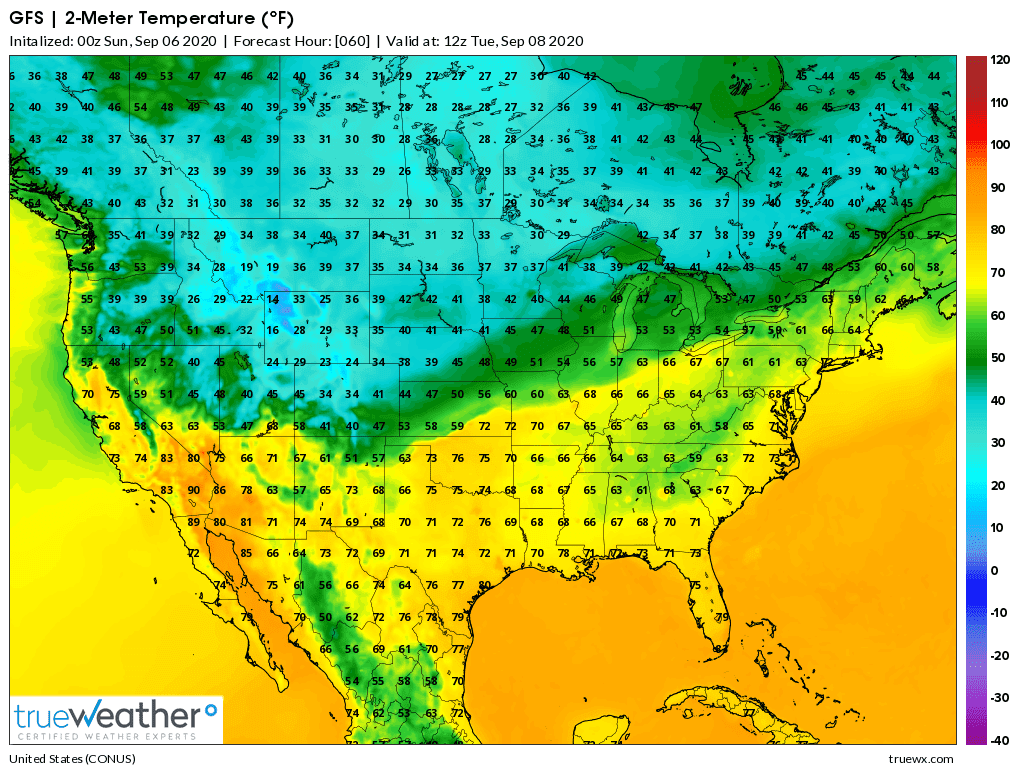
Daily low temperatures for days 1-7 below.
Around freezing in the High Plains on Tue/Wed.
GFS lows days 1-3 below:
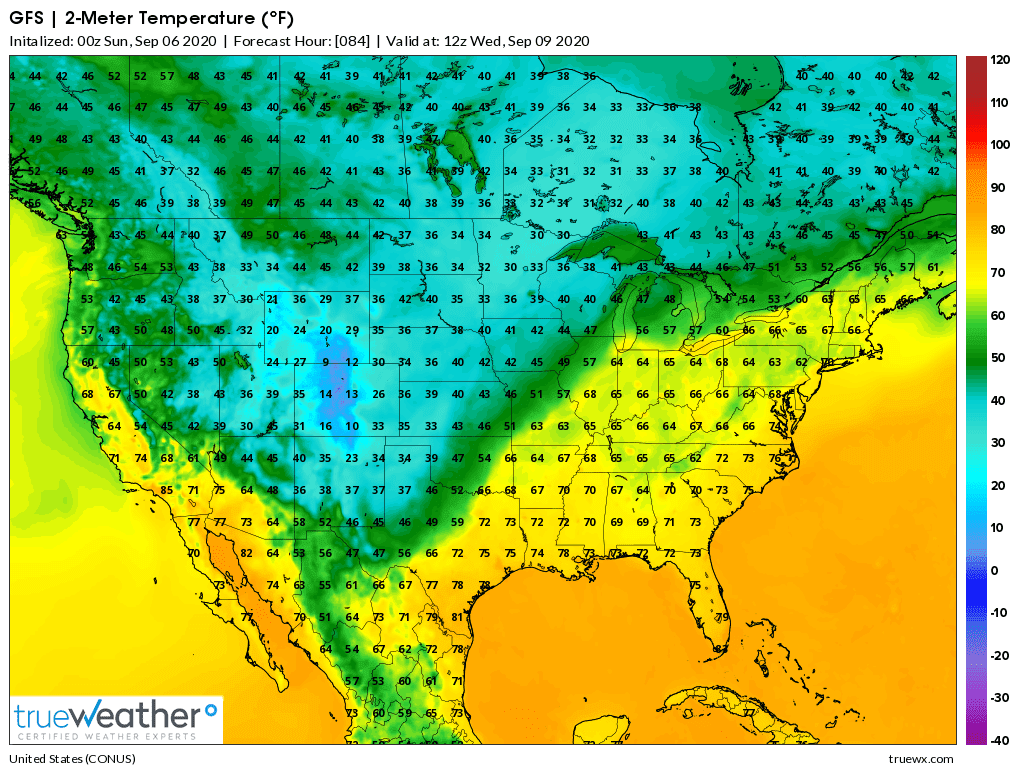
Lows days 3-7 below:
https://www.wpc.ncep.noaa.gov/medr/medr_min.shtml
Temperatures compared to Average for days 3-7
We have passed the hottest time of year climatologically by 6+ weeks.
The heat is out West.
Chilly period in the Plains to Midwest early/mid next week!!! Warming back to average after that.
https://www.wpc.ncep.noaa.gov/medr/medr_mean.shtml


Surface Weather features days 0-1-2 then days 3-7:
https://www.cpc.ncep.noaa.gov/products/forecasts/
Front with rains, followed by a massive Canadian High.
Days 0-1-2 below:
Days 3-7 below:
Liquid equivalent precip forecasts for the next 7 days are below.
IA will finally get some early next week.............too late to help much.
Day 1 below
http://www.wpc.ncep.noaa.gov/qpf/fill_94qwbg.gif?1526306199054

Day 2 below:
http://www.wpc.ncep.noaa.gov/qpf/fill_98qwbg.gif?1528293750112

Day 3 below
http://www.wpc.ncep.noaa.gov/qpf/fill_99qwbg.gif?1528293842764

Days 4-5 below:
http://www.wpc.ncep.noaa.gov/qpf/95ep48iwbg_fill.gif?1526306162

Days 6-7 below:
http://www.wpc.ncep.noaa.gov/qpf/97ep48iwbg_fill.gif?1526306162

7 Day Total precipitation below:
https://www.wpc.ncep.noaa.gov/qpf/p168i.gif?1566925971

Excessive rain potential.
Dry soils in the central belt can handle a lot of rain right now.
Mesoscale Precipitation Discussions
Current Day 1 Forecast |
Day 1 Threat Area in Text Format
| Day 2 and Day 3 Forecasts |
Current Day 2 Forecast |
Day 2 Threat Area in Text Format
Current Day 3 Forecast |
Severe Storm Risk the next 8 days:
Current Day 1 Outlook | |
Current Day 2 Outlook | |
Current Day 3 Outlook | F |
Current Day 4-8 Outlook |
Current Dew Points
Humid up to the Ohio River.

Latest radar loop
http://www.nws.noaa.gov/radar_tab.php


| (3400x1700 pixels - 2.2mb) Go to: Most Recent Image |

Go to: Most Recent Image
You can go to this link to see precipitation totals from recent time periods:
https://water.weather.gov/precip/
Go to precipitation, then scroll down to pick a time frame. Hit states to get the borders to see locations better. Under products, you can hit "observed" or "Percent of Normal"
Soilmoisture anomaly:
These maps sometimes take a day to catch up to incorporate the latest data(the bottom map is only updated once a week).
https://www.cpc.ncep.noaa.gov/products/Soilmst_Monitoring/US/Soilmst/Soilmst.shtml#
![]()


Drought Monitor maps:
Latest: The first map below is the latest. The 2nd one is from last week.
April 23: LOOKY_LOOKY! For the first time this year, its gotten dry enough for a few (small)areas in the Upper Midwest/Western Cornbelt to report slight drought.
April 30: Drought increased a bit......Plains and U.Midwest.
May: 7: Drought increased a bit from KS westward.
May 14: Drought increased a bit again, now, parts of Iowa have slight drought(this dry weather is why planting is ahead of schedule). Rains are coming to the dry spots in the forecast though.......bearish.
May 21: A bit more drought in ND.
May 28: Not much change
June 4: Drought increases a tad in the N.Plains and Upper Midwest.
June 10: Drought worsening in the S.Plains could be part of the La Nina signal!!
June 17: Drought got worse again in the S.Plains and yellows/slight drought emerged in new locations............all of Indiana.
June 24: Drought help in some places(KS) but increased a bit in others(ND).
July 1: Drought shrunk in Ohio Valley(I got 5.5 inches of rain in sw INdiana!) but not much change elsewhere. Surprised it didn't shrink more in IN/IL where some places(Bowyer) got great rains recently.
July 8: The main change was an increase over w.IA and e.NE. At the end of July with the hot/dry weather coming up, the S.Plains drought should expand into the S.Midwest to the Eastern Cornbelt.
July 15: Drought increased again over IA/MO/IN/OH. In july, evaporation usually exceeds rainfall, so some of this is seasonal. Hot temps coming up will accelerate evaporation.
July 22: Some Recent rains in IN did not make the cutoff.
July 29: Main dry spots are W.Iowa and IN/OH. Upcoming rains prospects good for ECB.
August 6: Drought got much worse in Iowa.
August 13: Looks like rains on Monday made no difference to W.IA drought(only around 1 inch).
August 20: IA is very dry.........into N.IL now.
August 27: Drought got worse in IA!!
September 3: Drought worse in IA and IL, N.IN!
https://droughtmonitor.unl.edu/


The top map is the Canadian ensemble average, the maps below are the individual members that make up the average at the end of week 2.
+++++++++++++++++++++++++++++++++++++++++
Each member is like the parent, Canadian model operational model.......with a slight tweek/variation in parameters. Since we know the equations to represent the physics of the atmosphere in the models are not perfect, its useful to vary some of the equations that are uncertain(can make a difference) to see if it effects the outcome and how.
The average of all these variations(ensembles) often yields a better tool for forecasting. It's always more consistent. The individual operational model, like each individual ensemble member can vary greatly from run to run.........and represent an extreme end of the spectrum at times. The ensemble average of all the members, because it averages the extremes.............from opposite ends of the spectrum.........changes much less from run to run.
End of week 2....................0z Canadian ensembles:
Sunday: Wide spread on where to put the heat ridge. Most have it in the Southwest but how far east does it extend? Fast/strong jet stream coming over the top of the heat ridge. Trough in the Midwest/Northeast? or does heat out west spill across the country into the Plains/Midwest? Dry pattern for early harvesting.
360h GZ 500 forecast valid on Sep 21, 2020 12 UTC


Forecasts for the control (GEM 0) and the 20 ensemble members (global model not available)
Individual GFS ensemble solutions for the latest 0z run at 360 hours. These are the 500mb upper level maps:
Sunday: Heat ridge west-hot, troughing possible downstream. Strong jet stream. Likely dry unless northwest flow becomes more active in the Midwest. A few solutions have the heat ridge farther east.

GFS Ensemble mean(average of all the individual solutions above). The first map is a mid/upper level map. The 2nd one is a temperatures map at around 1 mile above the surface. These are anomalies(difference compared to average).
NCEP Ensemble t = 360 hour forecast
Sunday: At 7 days, Solid Positive anomaly West, negative anomaly Midwest. Positive anomaly grows during week 2 and shifts slightly farther east(heat spreading east a bit?) Weak Negative anomaly fills in/shifts east.
2 weeks out below

++++++++++
Latest, updated graph/forecast for AO and NAO and PNA here, including an explanation of how to interpret them...............mainly where they stand at the end of 2 weeks
https://www.marketforum.com/forum/t
Previous analysis, with the latest day at the bottom for late week 2 period.
Discussions, starting with the oldest below.
Sunday: AO is bouncing around thru 2 weeks. NAO is mostly positive, which makes it tough for cool air in the Midwest this week to push very far east. PNA, like the others has a wide spread in solutions but is close to zero. The wide spread suggests uncertainty/low confidence.
National Weather Service 6-10 day, 8-14 day outlooks.
Updated daily just after 2pm Central.
Temperature Probability
 Precipitation Probability

| the 8-14 day outlooks ArchivesAnalogsLines-Only FormatGIS Data | |
Temperature Probability | |
 | |
Good riddance August! Not only were you dry, the only time there was widespread rainfall, you had to include historically destructive storms. On to September... Image is rainfall departure from Aug 1st - Aug 30th via the Iowa Environmental Mesonet #iawx
https://www.youtube.com/watch?v=DOk_fPUdxVs&feature=youtu.be
Sunday PM:
Added analysis and added several new maps.


