Overall, 26% of the bee visits came from wild bees but the percentages varied between different crops. For instance, 33% of the visits to apple trees came from wild bees. The researchers estimated that the wild bees contributed $1.06 billion in economic value to crop yields through pollination.
Winfree said farmers have to pay for beekeepers to bring honeybees to their farms while wild bees pollinate fields for free. She said she didn’t expect them to make such a big contribution on large farms.
“My expectation was that we wouldn’t see a lot of wild bees,” she said. “To me, the biggest surprise was that wild bees were still there.”
Farmers who want to take advantage of the natural benefits of wild bees can help them by being careful with insecticides, said Winfree. She said some insecticides, like neonicotinoids, are especially toxic to bees. In order to protect bees farmers should apply insecticides that are targeted at specific pests and should not use them more than is necessary, said Winfree.
Allowing natural flowers to grow on the boarders of fields or in tractor lanes can also give wild bees a place to live, she said.
https://blog.pqsystems.com/2019/05/14/data-in-everyday-life-are-honey-bees-on-the-decline/
"Honey bees, both wild and domestic, perform about 80 percent of all pollination worldwide. A single bee colony can pollinate up to 300 million flowers each day. While grains are primarily pollinated by the wind; fruits, nuts, and vegetables are pollinated by bees. Seventy out of the top 100 human food crops — which supply about 90 percent of the world’s nutrition — are pollinated by bees.
We’ve heard much over the last several years about the decline of the honey bee. There are a hive of factors being blamed for bees dying off: habitat loss, climate change, disease, parasites, and a new class of pesticides, neonicotinoids that began use in the early 1990s. But how bad is the problem, really?"

The chart shows a rapid decline in honey bee population beginning in the early 1990s. The decline continues at a slower pace until it bottoms out in 2008. Colony Collapse Disorder was first reported in 2006 and alarms began buzzing shortly after that. In 2009 the situation starts to look sweeter, as the bee population begins to slowly increase, a possible result of concentrated efforts to save the bees.
https://adventuresinbeeland.com/2019/01/14/how-many-honey-bees-are-there-a-2019-update/
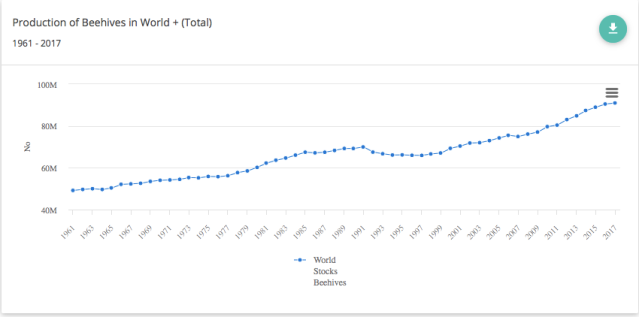
© FAO, Production of Beehives world total 1961-2017, Web address: http://www.fao.org/faostat/en/#data/QA/visualize, Accessed: 14/01/19
So the long-term global trend since 1961 is that the number of honey bee colonies has gone up. There have been long-term decreases in the US and some European countries, but these have been made up for by increases elsewhere in the world. More on this later.
++++++++++++++++++++++++++++++++++++++++++++++
So we could estimate a total number of honey bees of 90,564,654 x 20,000, which my calculator says = 1.8199946e+12 ! Let’s round that up to two trillion.
However, this number is only for bee hives that have been counted and the data supplied to the United Nations – so it’s likely to refer to colonies being managed by beekeepers. The spreadsheet says the data is ‘Aggregate, may include official, semi-official, estimated or calculated data’. Unless someone out there was clambering up every tree or chimney counting every colony in the land, there will be many more wild colonies that have not been included. And the number of live honey bee colonies will be fluctuating all the time.
Despite the gloomy media reports about declining honey bee numbers, I hope these estimates persuade you that honey bees are not facing the same predicament as the poor Javan rhino (58-68 left). Indeed the long-term trend over the past half-century seems to indicate that the number of hives globally is increasing.
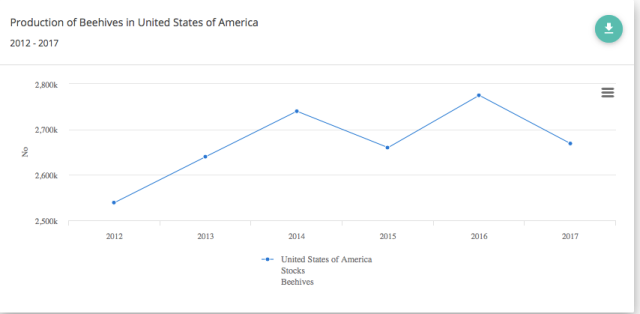
If we look at the long-term trend since 1961, the number of beehives in the US has fallen significantly. This bucks the trend in the world totals for beehives having increased since then.

Why are honey bee numbers falling in the US? This is a complex question to answer, but there are some clues in the annual Bee Informed Partnership National Management Survey, which surveys nearly 4,700 US beekeepers. The top ten reasons given for winter colony losses are (in no particular order): don’t know (!), colony collapse disorder, queen failure, weak colony, nosema, varroa, pesticides, small hive beetle, starvation and poor wintering.
FAOSTAT says there were 2,669,000 hives in the USA in 2017 (the latest year they have available as of June 2019).
https://towardsdatascience.com/whats-buzzing-with-the-bees-99f9be0bc4c6

Bee survivability & thrive-ability really depends on a variety of factors including geography and varies state to state.
Just from eyeing the maps, it’s apparent that 2011 and 2013 winters weren’t too bad, but 2012 and 2014–2016 were much more fatal for bees.

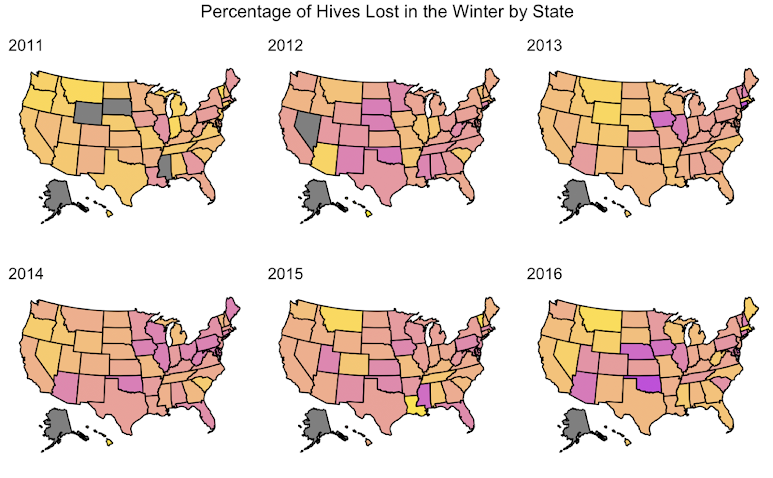

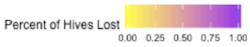
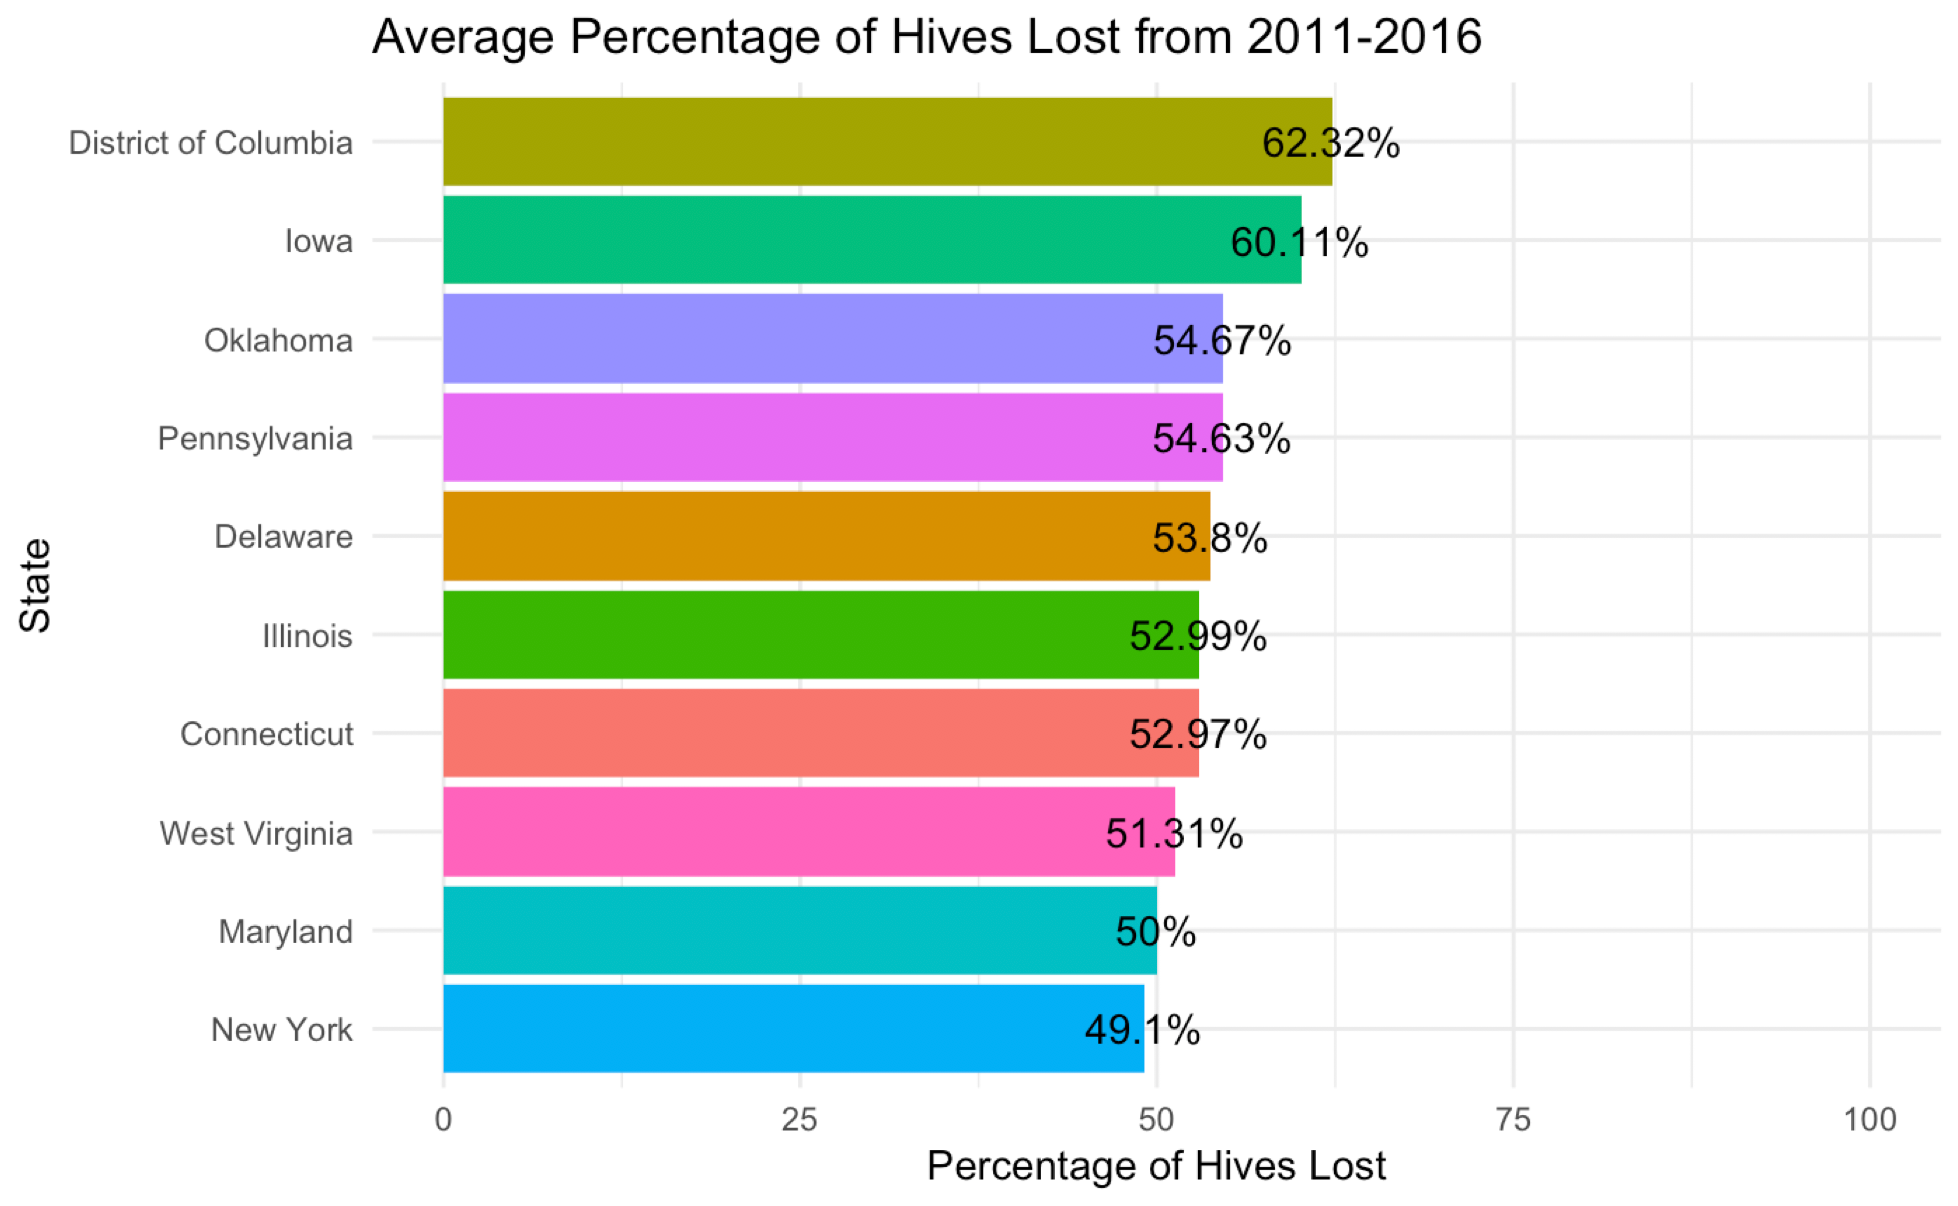
Geographically, states in the Midwest and Mid-Atlantic experience the worse bee die-offs.
States with the highest hive loss % over the winter tend to be located in the Mid-Atlantic and Midwest while states with lowest hive loss % tend to be located in the Western US.


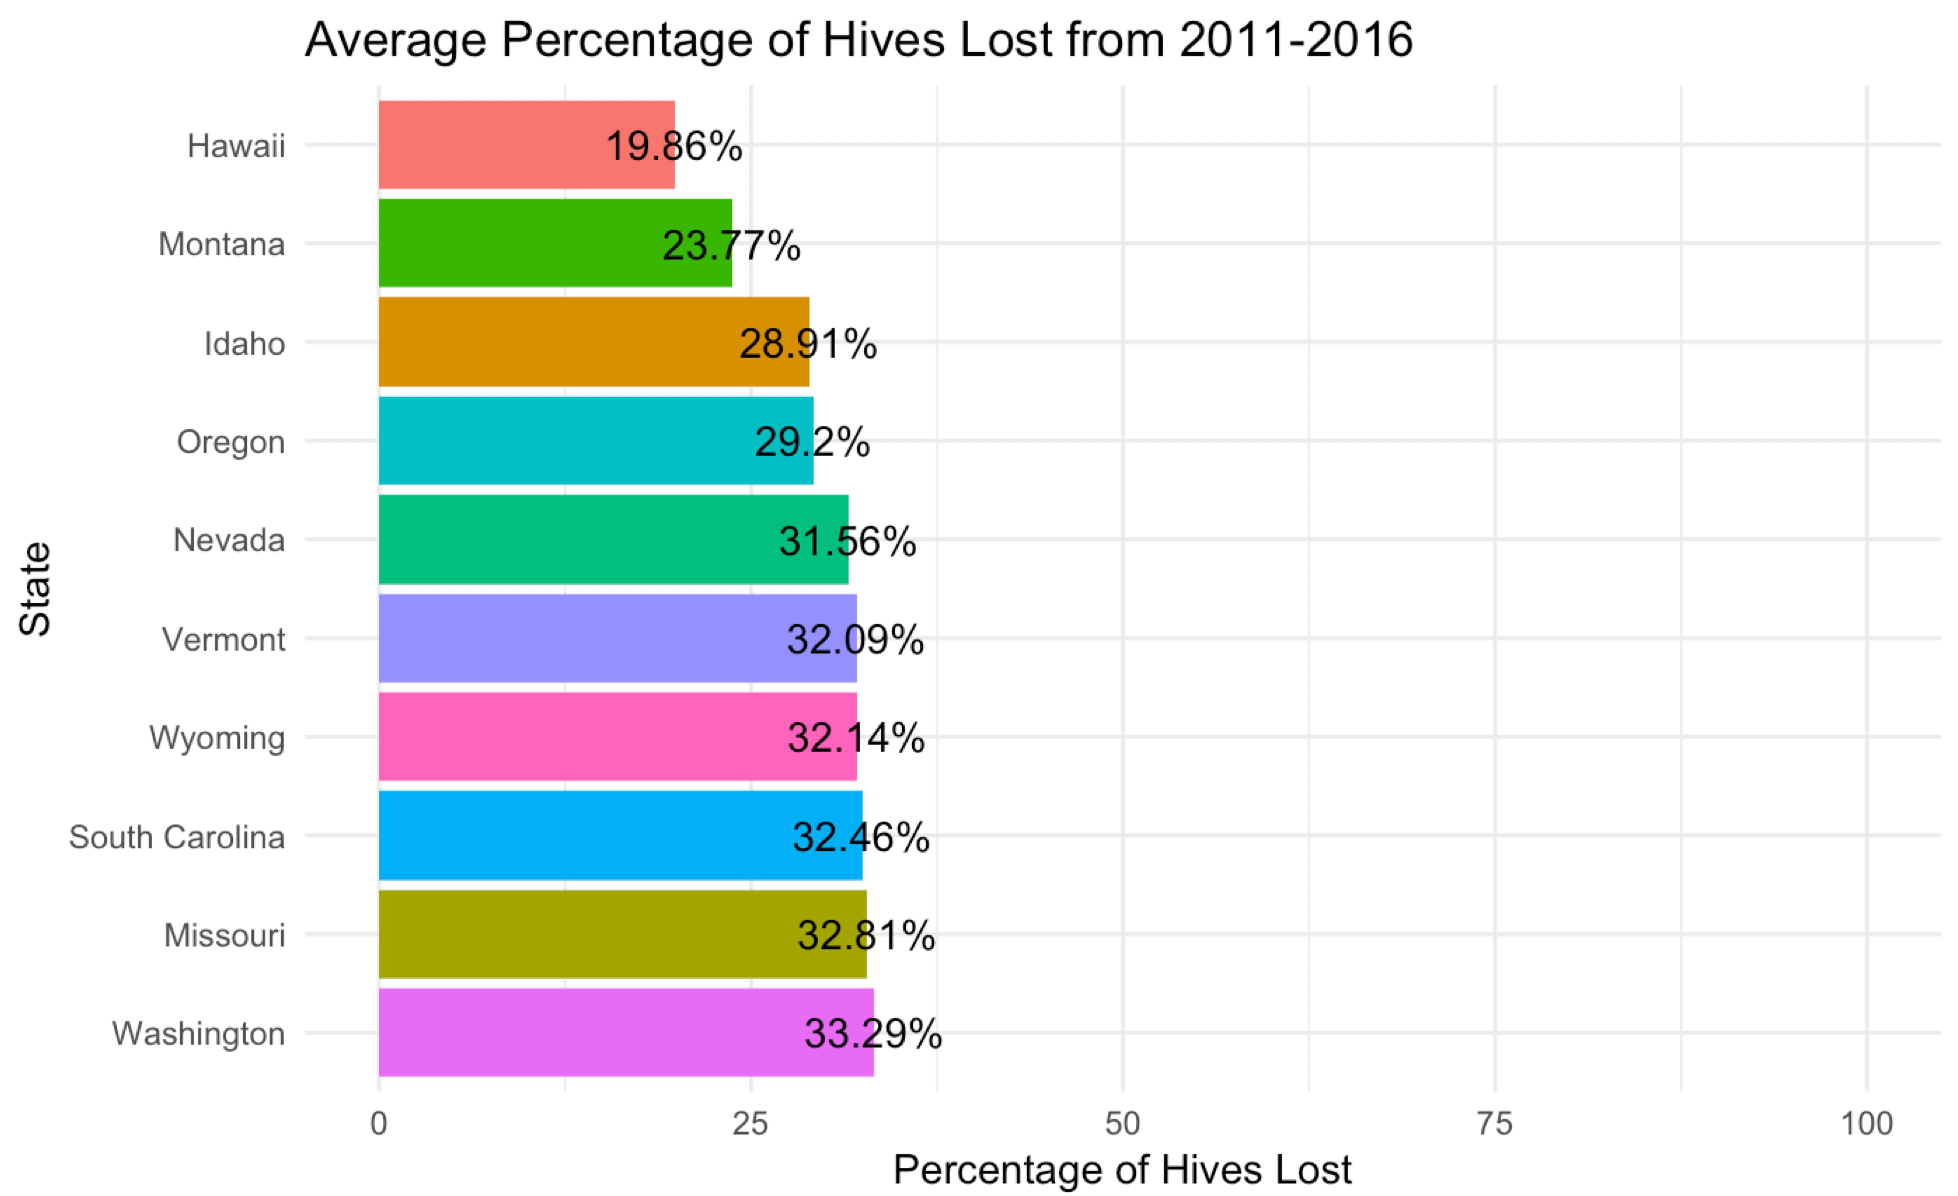
The two main reasons for colony loss are deadouts and colony collapse disorder.
Deadouts are when all the bees in a colonies die. Bees’ immune systems weaken in the winter and they are more susceptible to infections and parasites (like varroa mites).
Colony Collapse Disorder, or CCD, is when the majority of bees in a colony permanently fly away from the hive leaving just the queen and a few worker bees. CCD is still being studied to determine what factors contribute to it.
Unfortunately the USDA has only mandated data collection of CCD and Deadout losses starting in 2015, so there isn’t much data. Based on the graph, we can see deadouts are far more common; in addition, there are seasonal trends among both types of colony loss.

Hives that perish over the winter are almost 4 times as likely to experience deadouts than colony collapse disorder.
In order to answer the question, I used a dataset of temperature anomalies by year (dating back to the late 1800s). I then took the minimum temperature anomaly by year and wanted to see if this value had any correlation by the percentage change in bee hives year-to-year.

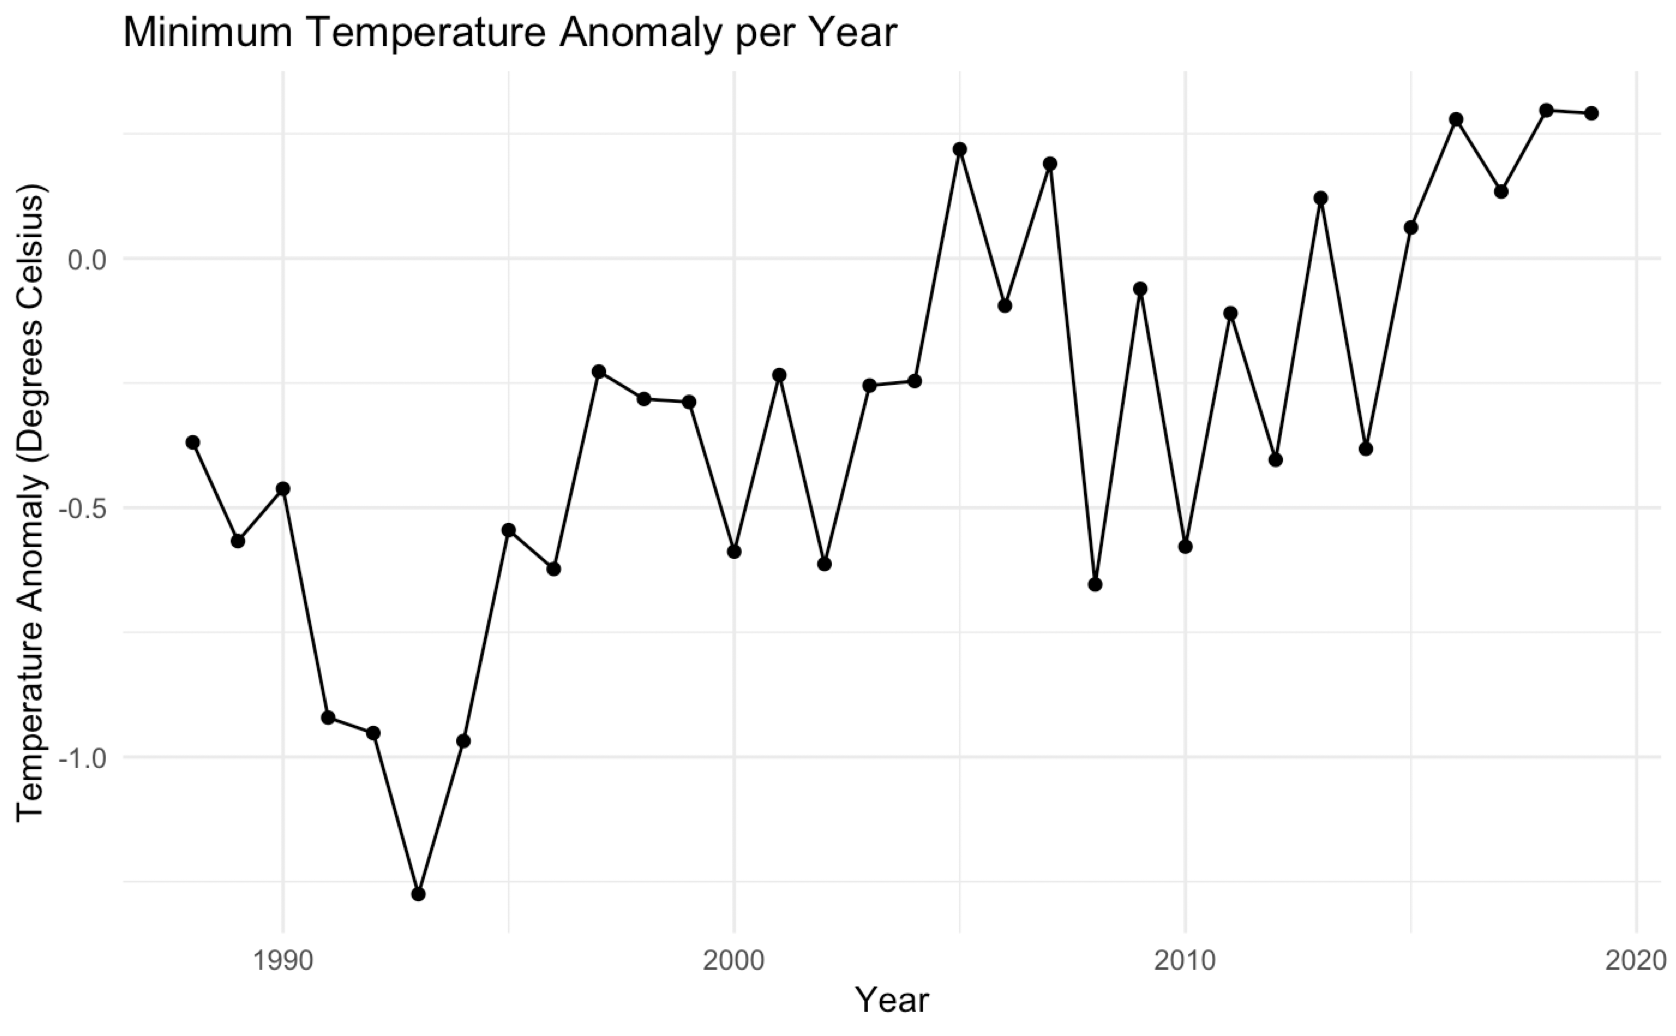

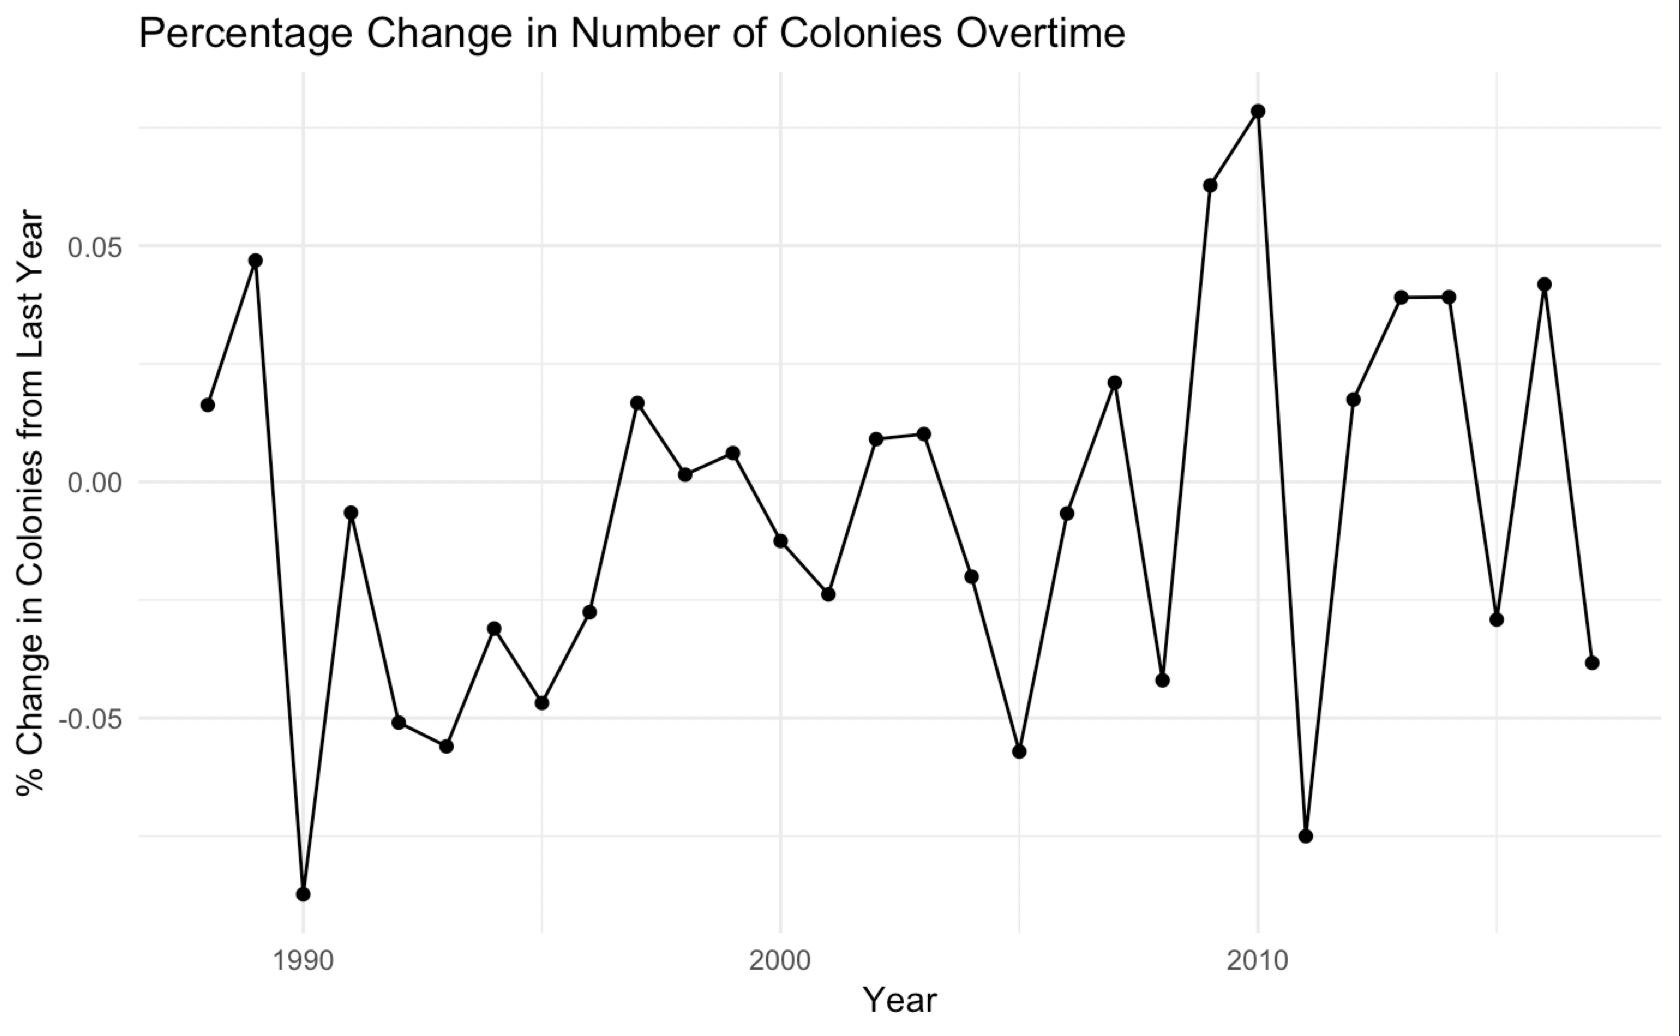
First I wanted to look at the data to see if there was a general trend. On the left is the minimum temperature anomaly for the year by year and below that is the percentage change in colonies from year-to-year. There doesn’t appear to be any shared pattern in the data.
To quantify the relation, I found the correlation between the % change in colonies and temperature anomaly. I was expecting to find a high positive correlation — my intuition being that more negative temperatures = harsher winter = more negative percentage change in colonies.
I found that the correlation was 0.23

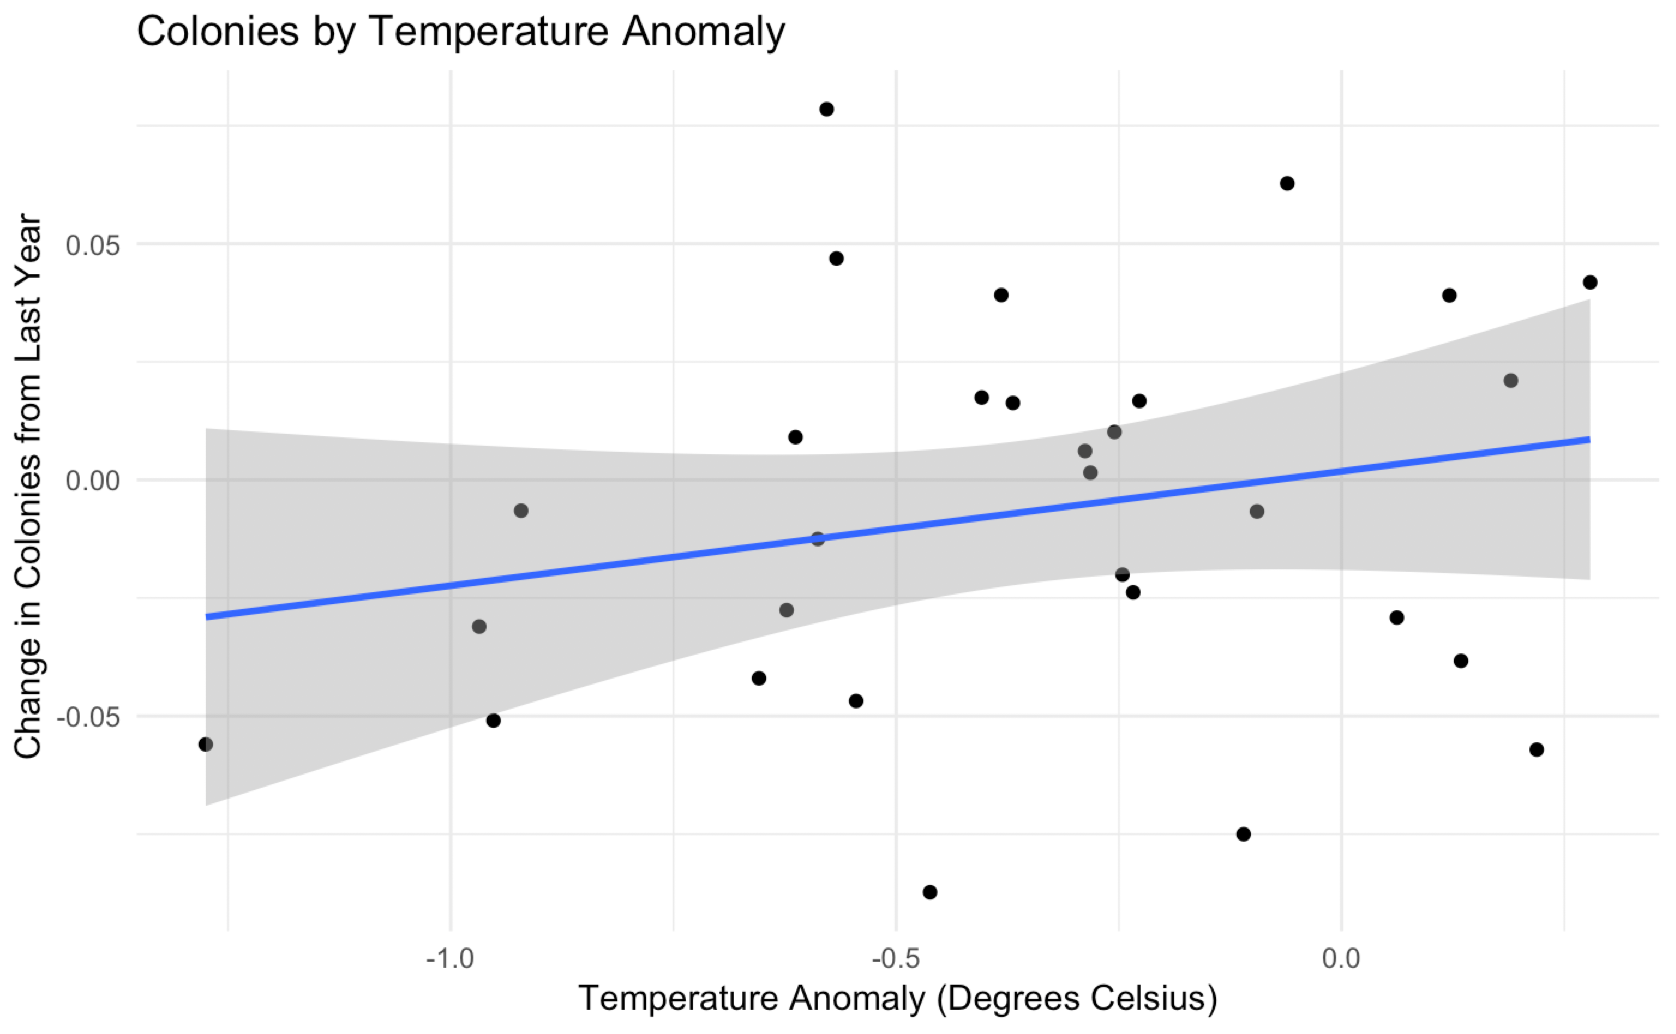
There is slight positive correlation between minimum temperature anomaly and percentage change in colonies from the previous year
https://www.beepods.com/101-fun-bee-facts-about-bees-and-beekeeping/
Bes have 2 stomachs – one for eating, and one for storing nectar.

https://thehoneybeeconservancy.org/2017/06/22/honey-bees-heroes-planet/
https://www.pestworld.org/pest-guide/stinging-insects/africanized-killer-bees/

https://www.pestworld.org/news-hub/pest-articles/faq-asian-giant-hornets/

Sightings of the Asian giant hornet have prompted fears that the vicious insect could establish itself in the United States and devastate bee populations.
In Japan, the hornets kill up to 50 people a year. Now, for the first time, they have arrived in the United States.


With queens that can grow to two inches long, Asian giant hornets can use mandibles shaped like spiked shark fins to wipe out a honeybee hive in a matter of hours, decapitating the bees and flying away with the thoraxes to feed their young. For larger targets, the hornet’s potent venom and stinger — long enough to puncture a beekeeping suit — make for an excruciating combination that victims have likened to hot metal driving into their skin.

