Wear an N95 Mask!
Scroll down to the bottom for the latest update!
From November 13
The graphs and my explanations below tell us how bad it really is or isn't.
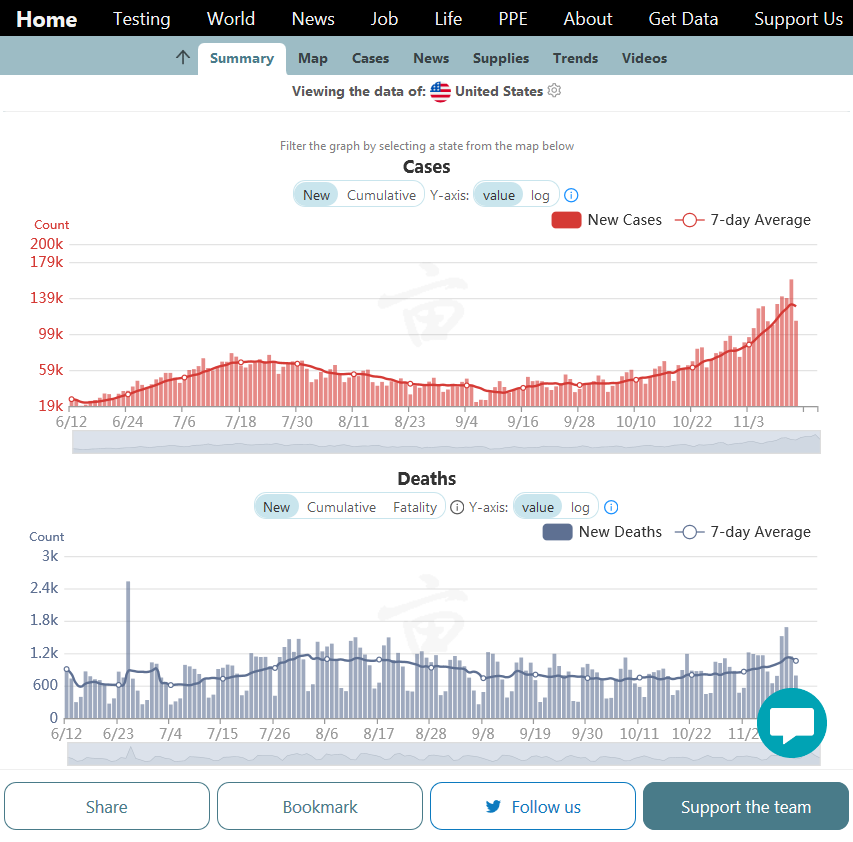
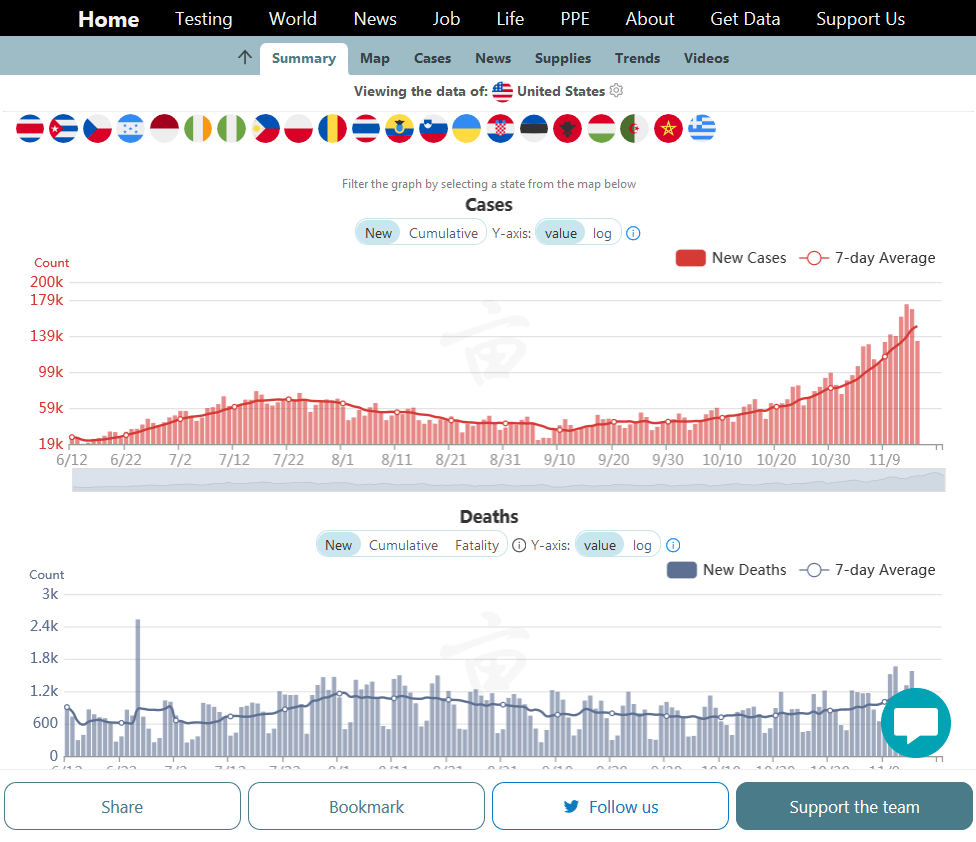
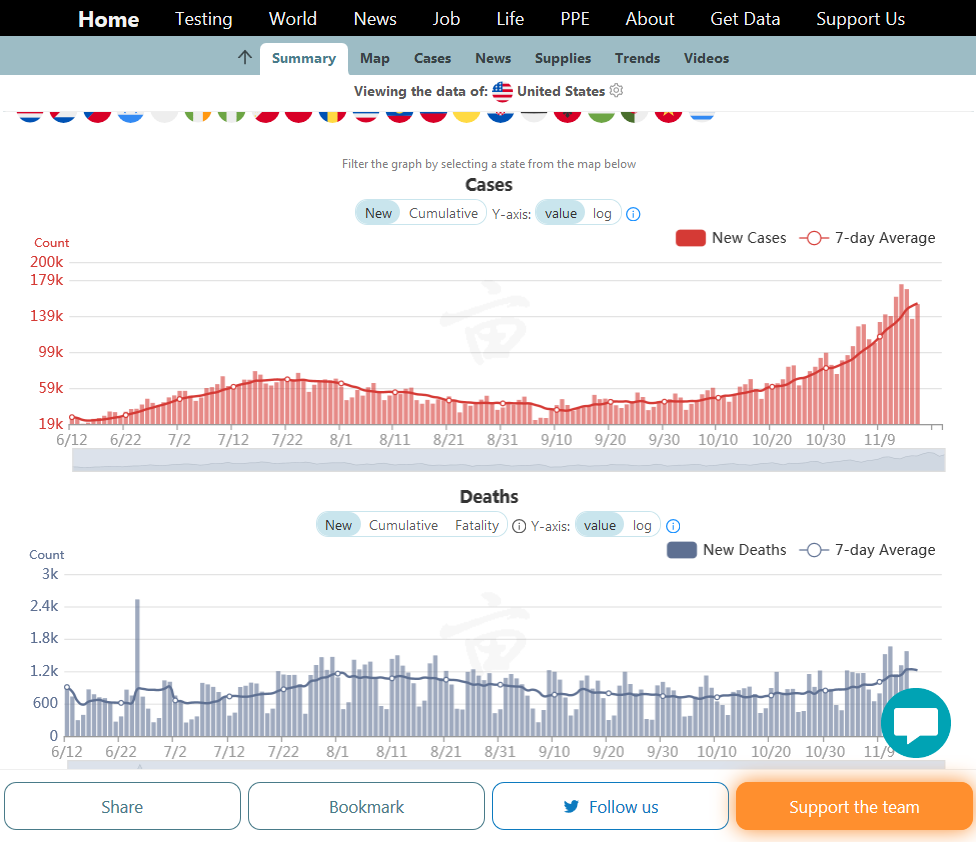
1. Note graph #1, new daily cases: New cases are soaring higher, but most people testing positive are not getting real sick which is not a bad thing. This is the group that has been soaring higher and inflating the new positive rate the most. Many like this existed in the Spring but didn't show up because they were not tested. See graph 1 below.
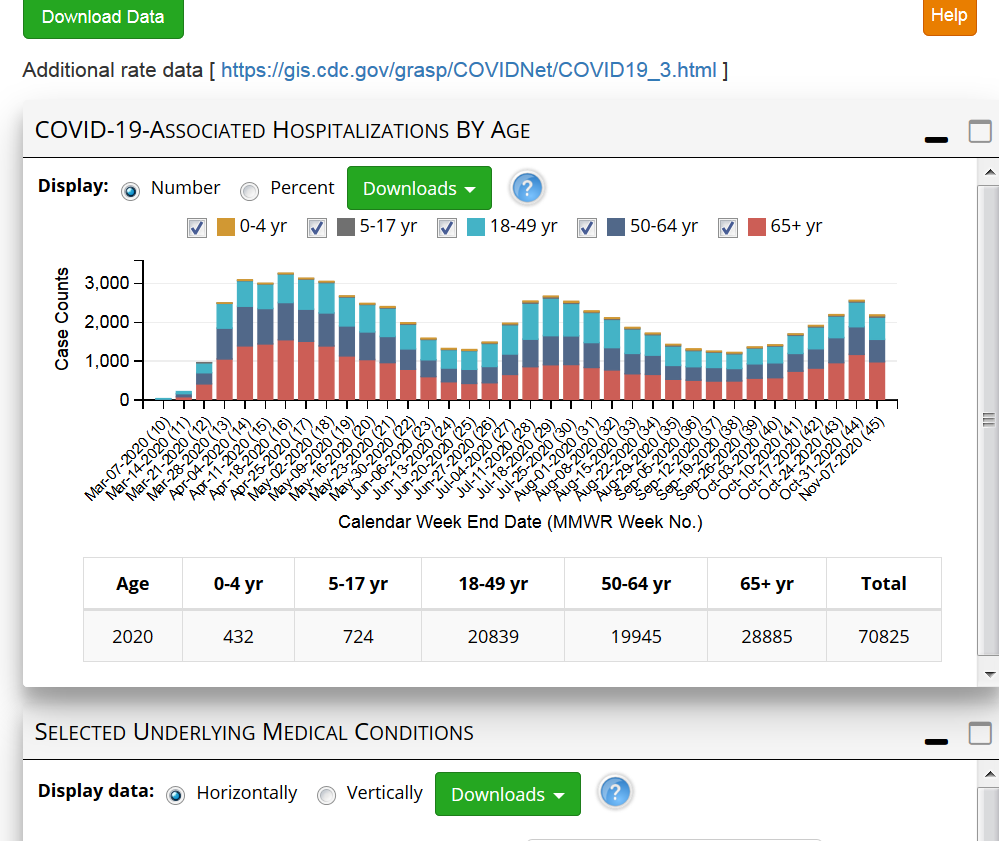
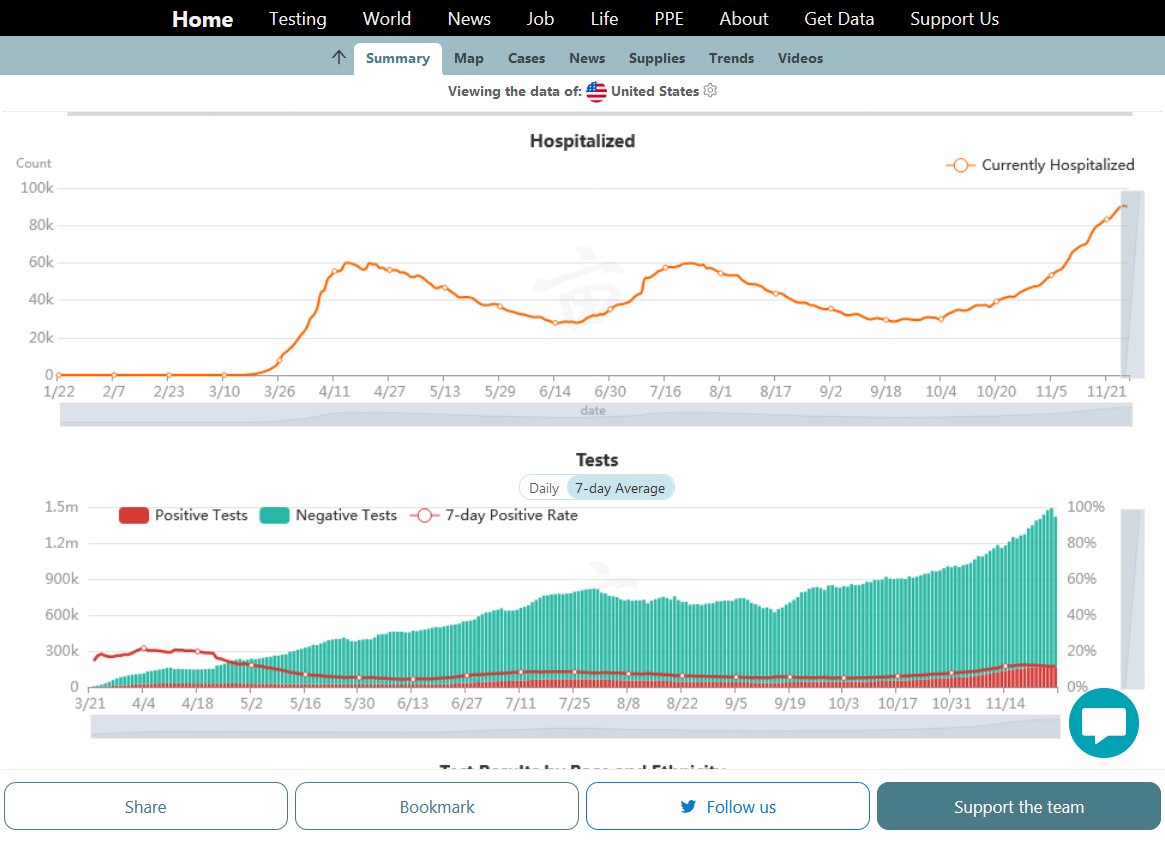
2. Note bar graph number 2 below: It shows people getting sick enough to be hospitalized. In the Spring, ALL these people showed up because all the really sick ones are always in the positives.
3. We peaked in the Spring. Then things improved greatly in May and thru the first half of June and were headed in the right direction.
4. Cases suddenly spiked higher in June. Despite much higher positive cases with the 2nd peak in July(after the protesting spread COVID that was covered up and we opened things up greatly, which was the main factor in many states) hospitalizations did NOT peak higher. The exception was protest aged people that did peak higher in all categories. They also were the majority of new cases. This is one reason why deaths were less than half of the 1st peak. This age does not get as sick as old people.........many that have lost their good health.
5. After this subsided with assistance of warm/humid weather(that had started to help alot in May) things got better for a couple of months.
6. Cooler/drier weather and the Flu/COVID season hit in September. Positive cases have been increasing for 9 straight weeks. The new record for positive cases is more than 4 times higher than the record in the Spring....160,000 yesterday. But look at hospitalizations! They are still just below the July peak and well below the April peak...not for long.
7. With the flu/COVID season just starting, it's likely that new cases will continue higher and things will get worse than they are right now. But we are being told that they are 4 times worse using new cases as the metric/standard. This is not true.
8. The truth is that things ARE getting worse....just not 4 times worse and in fact, are not as bad as before YET, here in early November. They likely will continue worse for several months because of the season(virus's love dry air-when you take the dry air outside, inside and heat it up-it gets even drier and it doubles the amount of virus that can survive in the air with time air compared with the same air that has double the humidity-this is the science and its coming).
9. It's almost as bad as it was in July for hospitalizations and we have a ways to go for it to be as bad as it was in late April. I think that we could get there by late November(maybe worse) because of the weather and the vaccine is months away from widespread distribution.
10. If/when we do peak, the positive cases might be close to 10 times what they were in April.......or more than double where they are right now. This is possible based on a worst case scenario wild guess and using previous flu seasons as analogs. In that worse case scenario, the actual hospitalizations would also set new records and could be double the old record in April.
11. Note chart #3: Deaths are occurring at an even lower rate compared to new positives and hospitalizations because we have numerous treatments that we did not have in the Spring. Deaths right now are only half the peak rate in the Spring, even though daily positives are 4 times higher.
12. However, if we doubled the positives rate from here, up to 300,000+ for instance, even deaths/day could get higher than they were in the Spring this Winter.
#1 New daily cases graph-4 times the April rate!
.png)
++++++++++++++++++++++++++++++++++++++++++++++++++++++++++++++++++++++++++++
#2 Hospitalizations graph-still less than April-but increasing. Likely to make new highs.
https://gis.cdc.gov/grasp/covidnet/COVID19_5.html
+++++++++++++++++++++++++++++++++++++
Graph #3 Deaths from COVID-only half of the peak in April but increasing.
.png)
13. So daily COVID positives based on test results are 4 times higher than April..........but daily deaths are only half the April number nationally(right now). However, many states are setting record highs for hospitalizations and deaths are increasing. Almost the entire country is seeing increases.......that will likely continue thru, at least the rest of the year.
Stay healthy. Avoids crowds, wear an N95 mask if possible.
See the previous COVID tracking posts below:
COVID data/graphs #5 November 12
73 responses |
Started by metmike - July 3, 2020, 11:42 p.m.
https://www.marketforum.com/forum/topic/55092/
Tracking COVID-19 #4 Jul 3, 2020
64 responses |
Started by metmike - May 16, 2020, 12:12 p.m.
https://www.marketforum.com/forum/topic/52243/
++++++++++++++++++++++++++++++++++++++++
Tracking COVID-19 #3 THU
52 responses |
Started by metmike - April 20, 2020, 12:48 p.m.
https://www.marketforum.com/forum/topic/50858/
++++++++++++++++++++++++++++++++++++++++++++
Tracking the Coronavirus#2-SUN
45 responses |
Started by metmike - April 1, 2020, 1:26 p.m.
https://www.marketforum.com/forum/topic/49863/
++++++++++++++++++++++++++++++++++++++++++++++++++++++
*Tracking the Coronavirus-TUE#'s at the bottom-rate slowing down a bit?
41 responses |
Started by metmike - March 14, 2020, 11:49 a.m.
https://www.marketforum.com/forum/topic/48892/
+++++++++++++++++++++++++++++++++++++++++++++++++++++++++++++++++++++++++++++++++
Covering up massive COVID being spread from protests-8/8 update below
23 responses |
Started by metmike - July 30, 2020, 7:28 p.m.
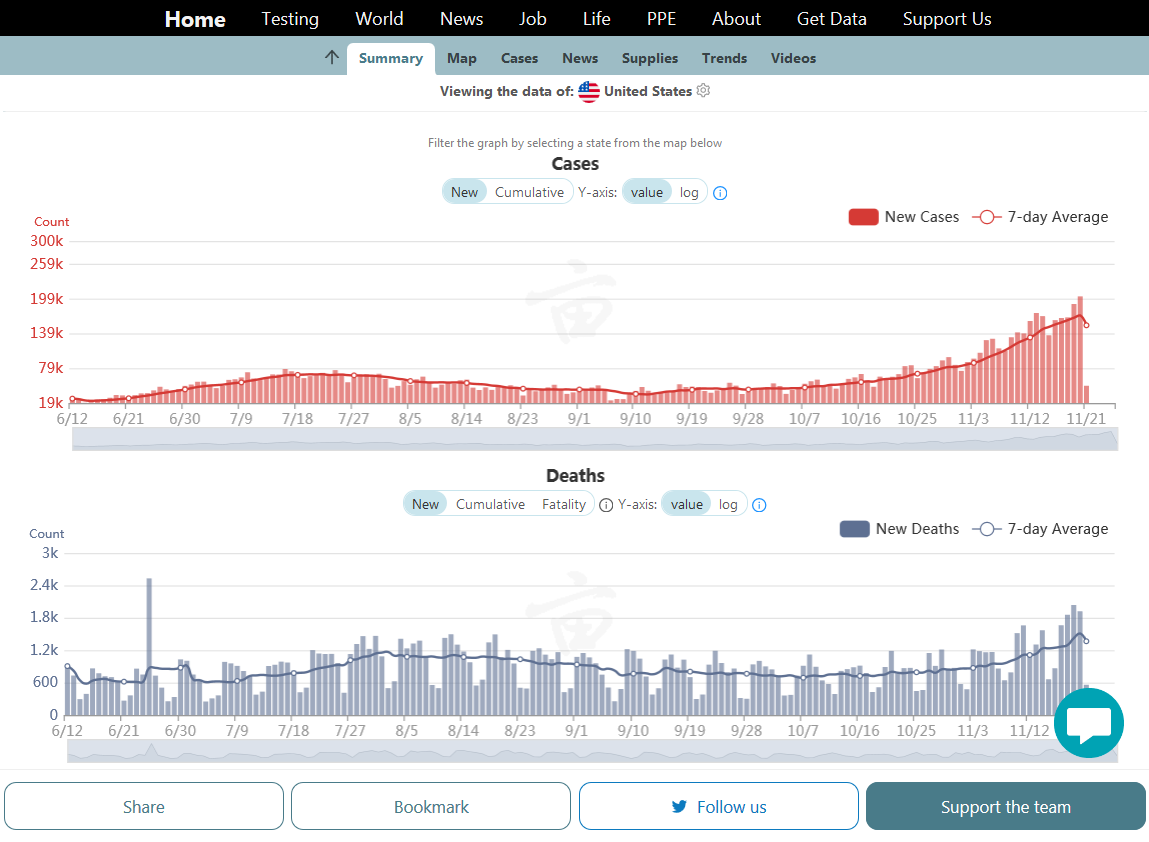
New positive cases have been climbing the past 9 weeks........now averaging over 130,000 new cases/day.
Deaths peaked in July(at much less than 50% of the April peak and being a lagging indicator, have taken awhile but they are going up too but still well below the previous highs in the Spring and below the 2nd peak in the Summer but approaching the 2nd peak. Now at just over 1,000/day.
Deaths per positive cases are clearly MUCH lower than there were in the Spring by something like 80% lower and the RATES of deaths/cases are only going lower......even as we ARE IN the flu/COVID season that IS featuring even higher cases....but with a slower increase in deaths.
Hospitalizations are going higher in many places, some at an alarming rate though and the next couple of months could be rough!
Find this data here: https://coronavirus.1point3acres.com/en
New positive cases have been climbing the past 9 weeks........now averaging over 140,000 new cases/day.
Deaths peaked in July(at much less than 50% of the April peak and being a lagging indicator, have taken awhile but they are going up too but still well below the previous highs in the Spring and below the 2nd peak in the Summer but approaching the 2nd peak. Now at just over 1,200/day.
Deaths per positive cases are MUCH lower than there were in the Spring by something like 80% ......even as we ARE NOW IN the flu/COVID season that IS featuring even higher cases....but with a slower increase in deaths.
Hospitalizations are going higher in many places, some at an alarming rate though and the next couple of months could be rough!
Find this data here: https://coronavirus.1point3acres.com/en
New positive cases have been climbing the past 9+ weeks........now averaging over 140,000 new cases/day.
Deaths have taken awhile but they are going up too but still below the previous highs in the Spring and close to the 2nd peak in the Summer. Now at just over 1,200/day.
Deaths per positive cases are MUCH lower than there were in the Spring by something like 80% ......even as we ARE NOW IN the flu/COVID season that IS featuring even higher cases....but with a slower increase in deaths.
Hospitalizations are going higher in many places, some at an alarming rate though and the next couple of months could be rough!
Find this data here: https://coronavirus.1point3acres.com/en
New positive cases have been climbing the past 9+ weeks........now averaging around 150,000 new cases/day.
Deaths have taken awhile but they are going up too but still below the previous highs in the Spring and close to the 2nd peak in the Summer. Now at just over 1,200/day.
Deaths per positive cases are MUCH lower than there were in the Spring by something like 80% ......even as we ARE NOW IN the flu/COVID season that IS featuring even higher cases....but with a slower increase in deaths.
Hospitalizations are going higher in many places, some at an alarming rate though and the next couple of months will be rough!
Find this data here: https://coronavirus.1point3acres.com/en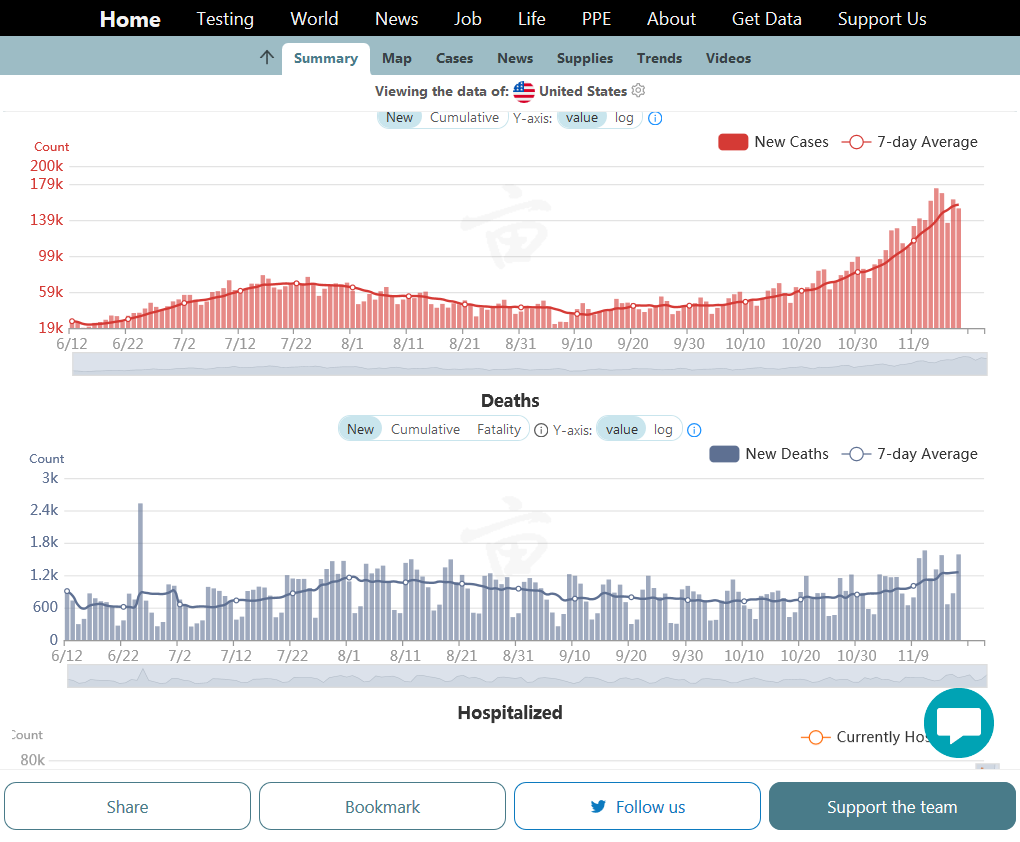
New positive cases have been climbing the past 9+ weeks........now averaging around 150,000 new cases/day.
Deaths have taken awhile but they are going up too but still below the previous highs in the Spring but now above the 2nd peak in the Summer. Now at just over 1,200/day.
Deaths per positive cases are MUCH lower than there were in the Spring by something like 80% ......even as we ARE NOW IN the flu/COVID season that IS featuring even higher cases....but with a slower increase in deaths.
Hospitalizations are going higher in most places, some at an alarming rate and the next couple of months will be rough!
Find this data here: https://coronavirus.1point3acres.com/en
New positive cases have been climbing the past 10 weeks........they hit 200,000 on Thursday of this past week!! 6 times higher than the April peak.
Deaths have taken awhile but they are going up faster now. They hit 2,000 in 1 day late this week, getting close to the April peak.
Deaths per positive cases are MUCH lower than there were in the Spring by something like 80% ......even as we ARE NOW IN the flu/COVID season that IS featuring even higher cases....but with a slower increase in deaths.
Hospitalizations are going higher in most places, some at an alarming rate and the next couple of months will be rough!
Find this data here: https://coronavirus.1point3acres.com/en
New positive cases have been climbing the past 10 weeks........they hit 200,000 on Thursday of last week!! 6 times higher than the April peak.
Deaths have taken awhile but they are going up faster now. They hit 2,000 in 1 day late last week, getting close to the April peak.
Deaths per positive cases are MUCH lower than there were in the Spring by something like 80% ......even as we ARE NOW IN the flu/COVID season that IS featuring even higher cases....but with a slower increase in deaths.
Hospitalizations are going higher in most places, some at an alarming rate and the next couple of months will be rough!
Find this data here: https://coronavirus.1point3acres.com/en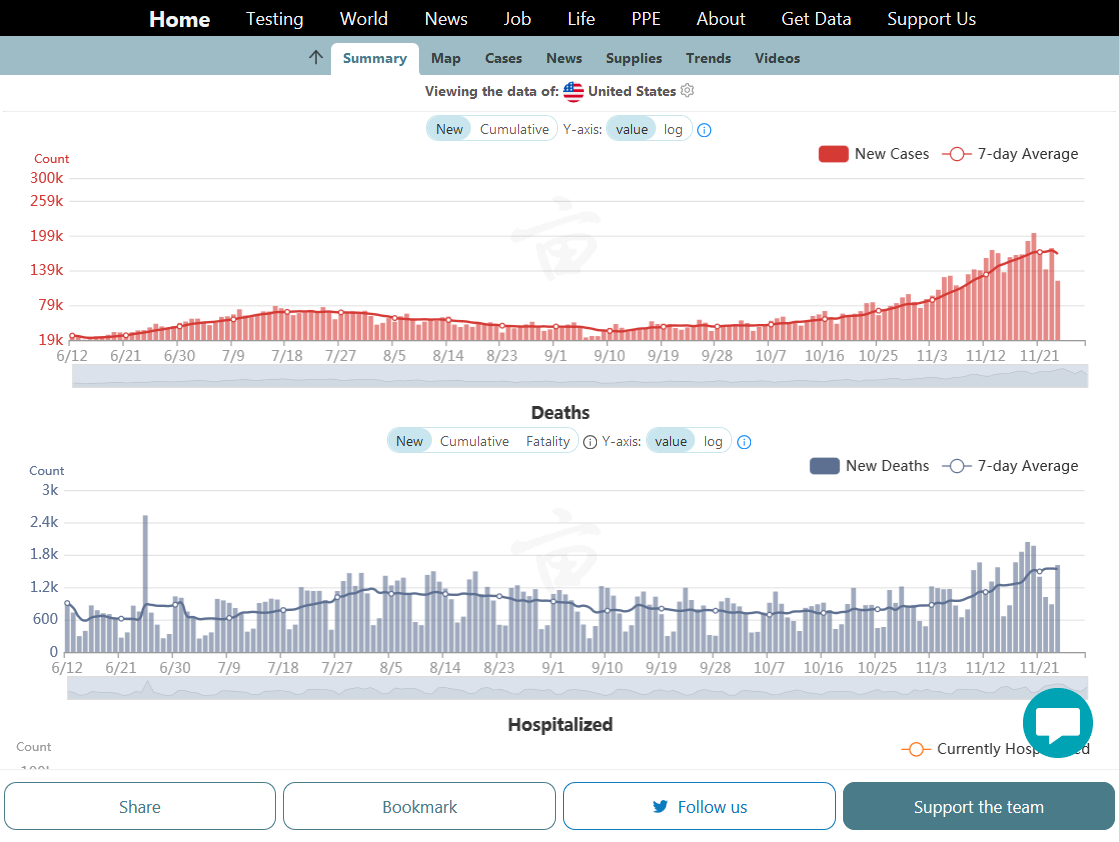
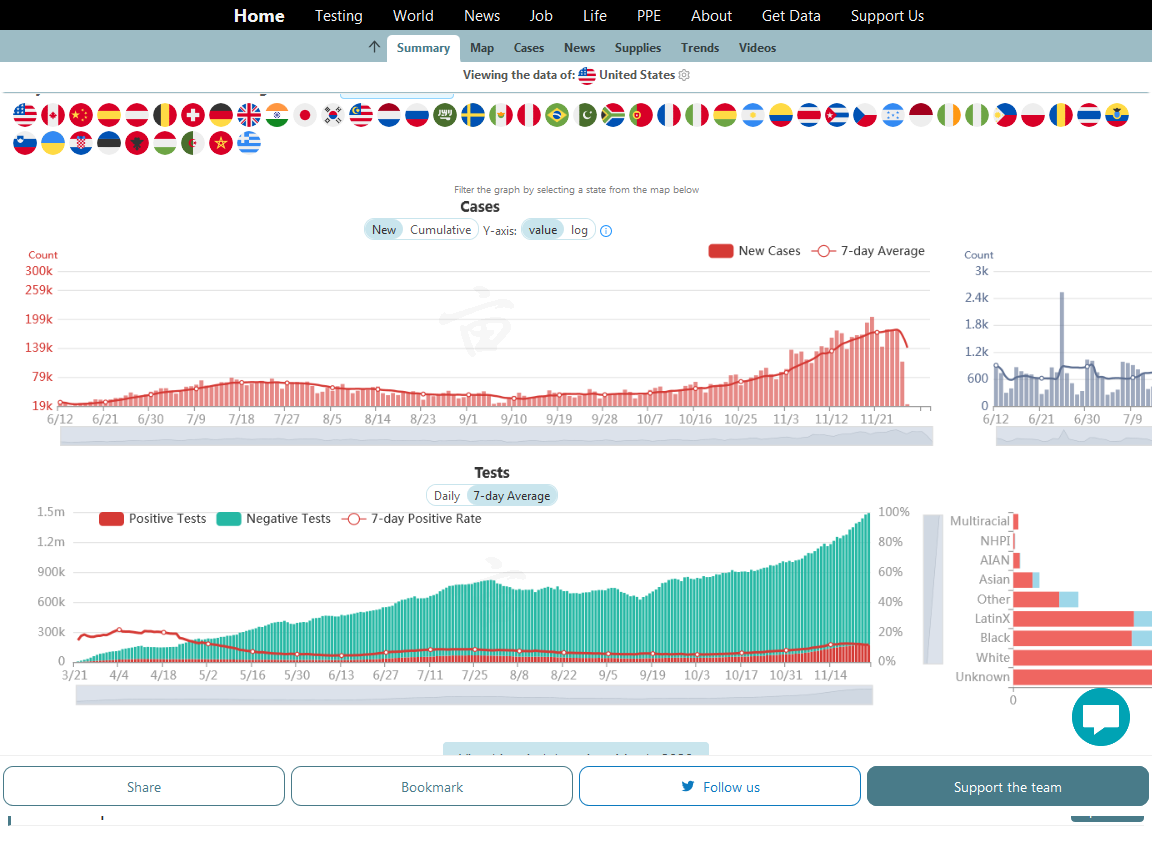
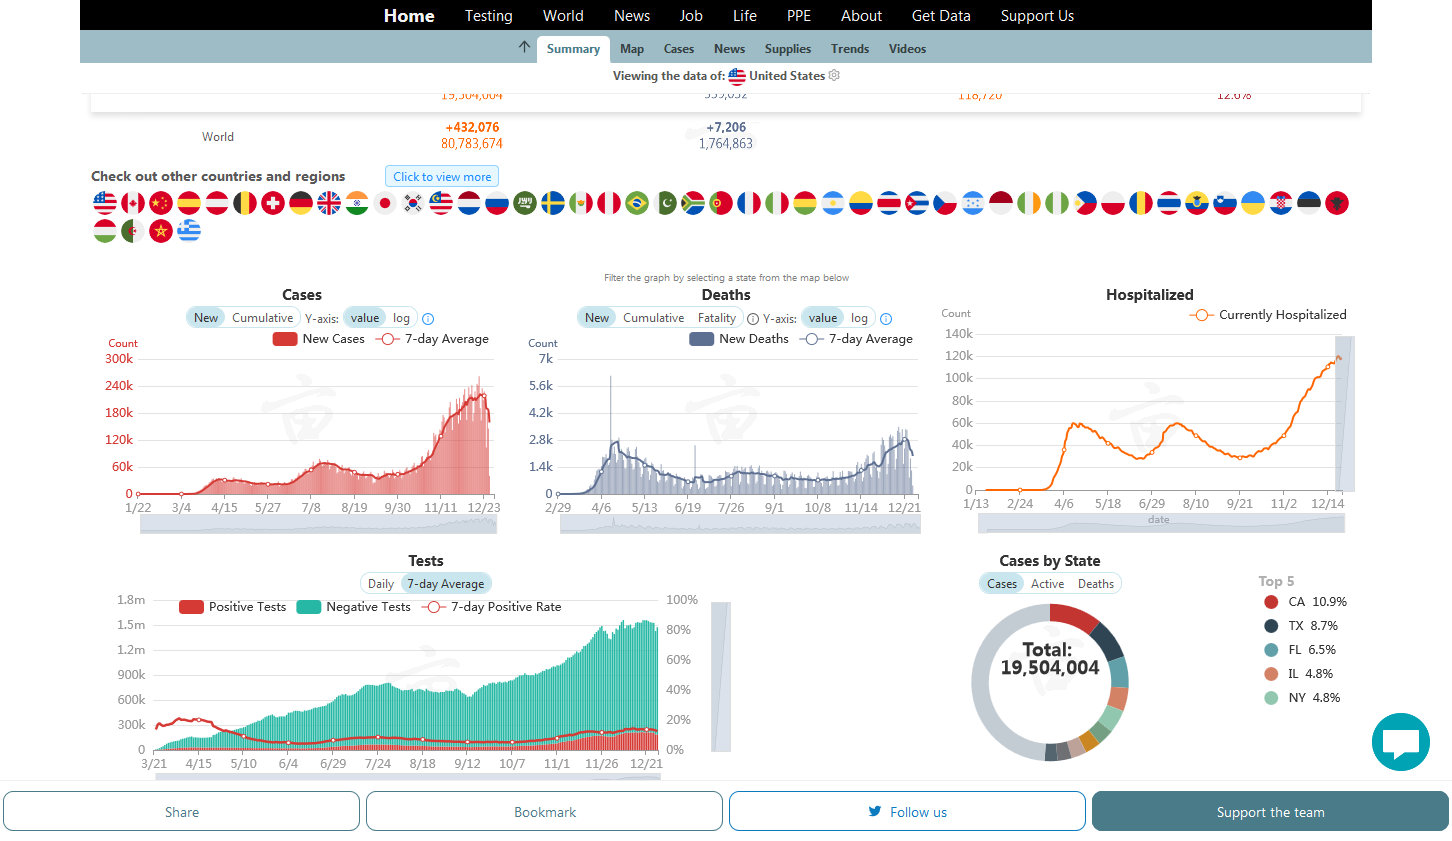
We have a new metric to show today..............tests. As you can see, the number of tests administered since April(2nd graph-green is negative tests) has gone up astronomically. This is responsible for much of the new case increases(mild cases). However, people in hospitals and dying would not be affected because they have showed up in the stats all along.
Find this data here: https://coronavirus.1point3acres.com/en
We have some new graphs below that will provide a more comprehensive/overall picture.
1. The top graph is still the new daily cases, starting from 6-12. They have been skyrocketing higher to 2 times the new positives that were detected during the July peak and more than 4 times higher than the April peak, which is data prior to this graph. There is an outside chance that this rate peaked a week ago. If so, then the rates for deaths and hospitalizations that lag will peak by early December. With this being early in the flu season still, that would be unexpected.
2. Deaths have also been climbing but at a slower rate. They are above the July peak but still just below the Spring peak, which is data before this graph started. People are dying at an 80% less rate/positive cases compared to the Spring because we are detecting more mild cases and have effective treatments.
3. Hospitalizations. This graph goes back to the start of the year. They have now exceeded both the July and the April peaks and are still increasing. Hospitals have been filling up!
4. We are testing at an incredible rate. 10+ times the daily testing that we did in April and more than double the daily administered tests compared to July. Most of the new positives are coming from this but there are also more new positives that end up getting very sick and are now in hospitals than at any time.....as we see from the graph #3.
Find this data here: https://coronavirus.1point3acres.com/en.png)
Updating with Thanksgiving weekend stats will be misleading because of the holiday. We will provide another update early this week.
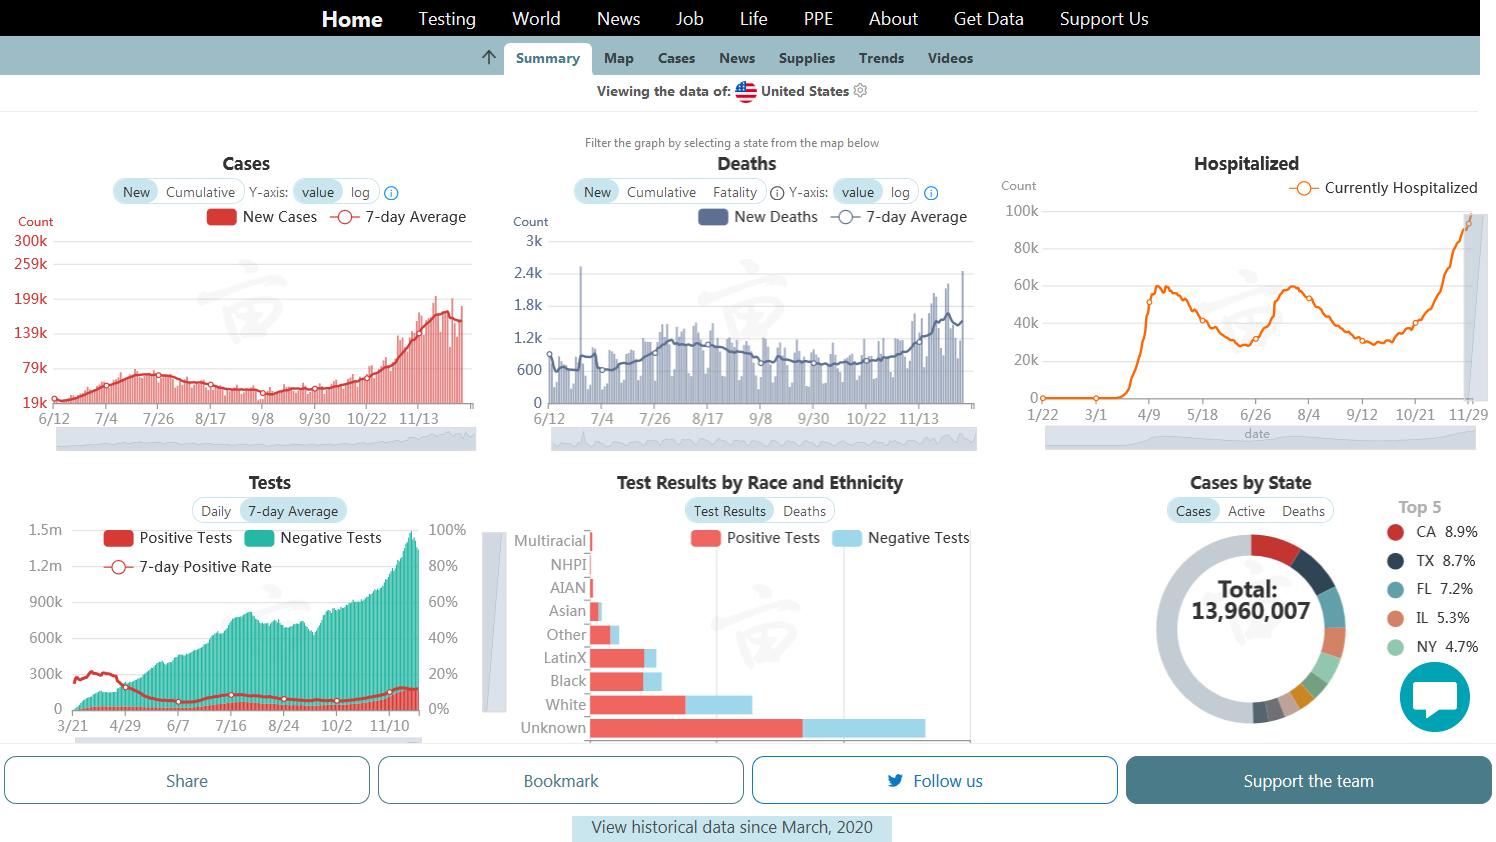
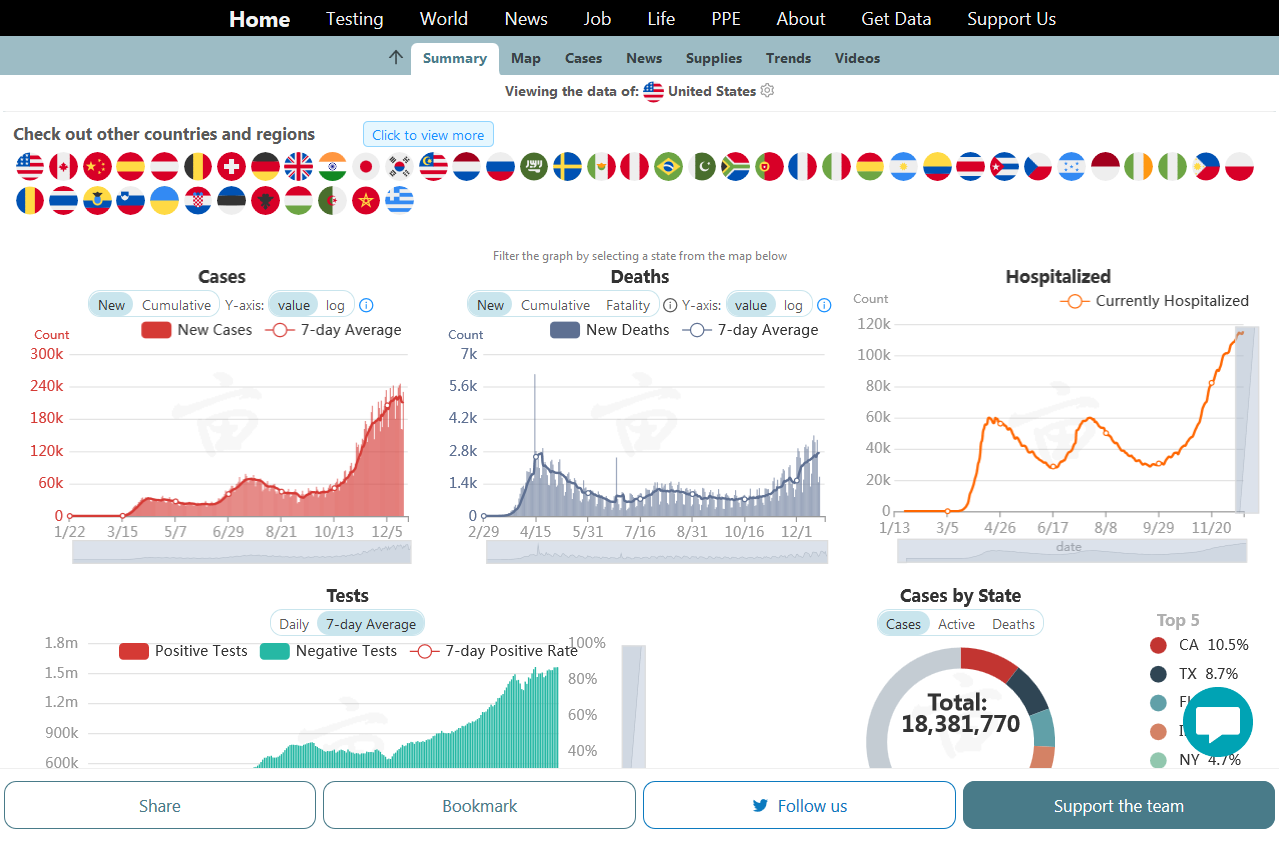
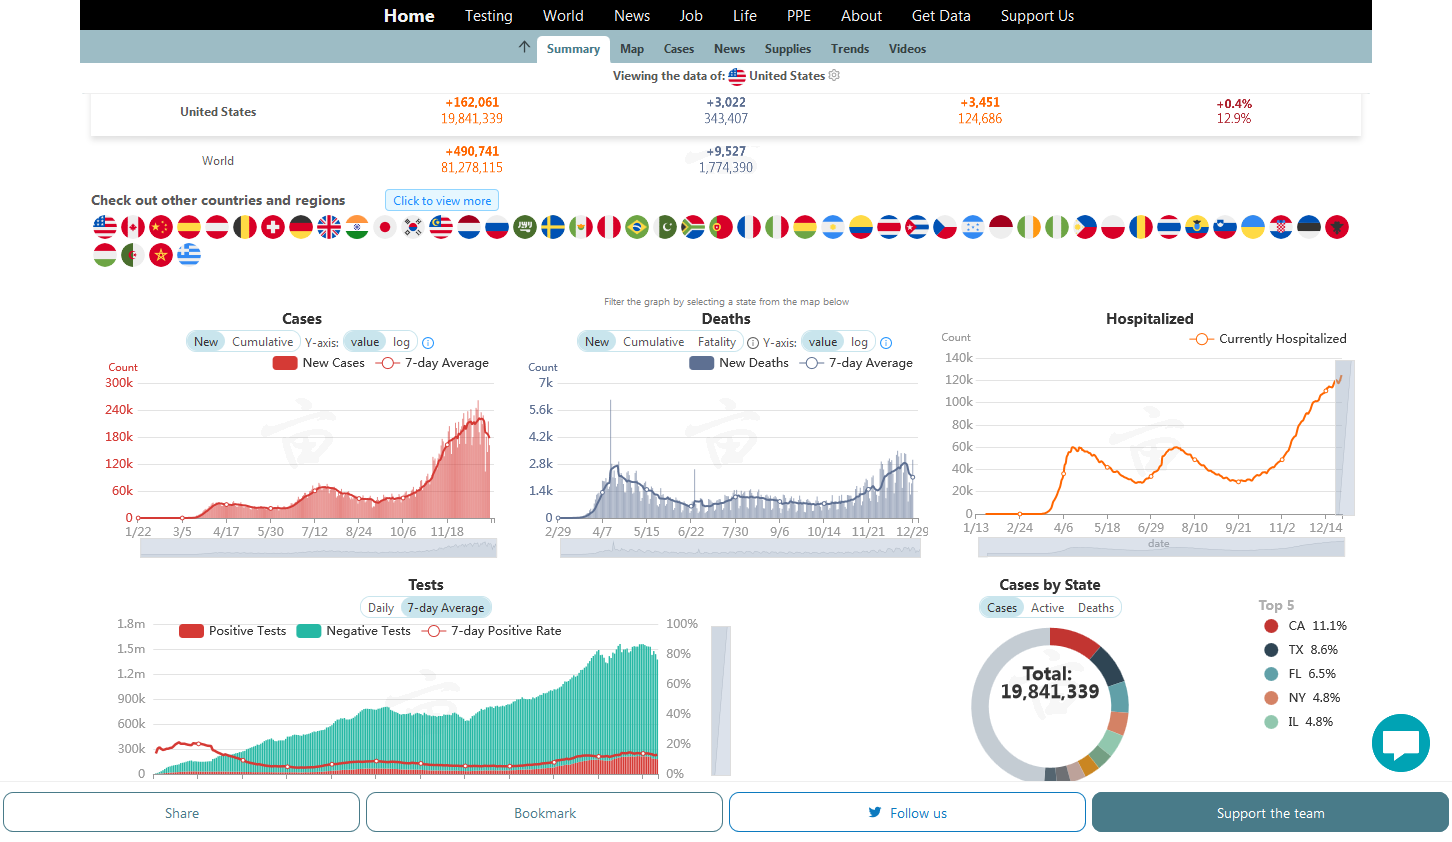
We have some new graphs below that will provide a more comprehensive/overall picture.
1. Cases: The top graph is still the new daily cases, starting from 6-12. They have been skyrocketing higher to 2 times the new positives that were detected during the July peak and more than 4 times higher than the April peak, which is data prior to this graph. There is an outside chance that this rate peaked a week ago. If so, then the rates for deaths and hospitalizations that lag will peak by early December. With this being early in the flu season still, that would be unexpected.
2. Deaths have also been climbing but at a slower rate. They are above the July peak and around the Spring peak, which is data before this graph started. People are dying at an 80% less rate/positive cases compared to the Spring because we are detecting more mild cases and have effective treatments.
3. Hospitalizations: This graph goes back to the start of the year. They have now exceeded both the July and the April peaks and are still increasing. Hospitals have been filling up!
4. Tests: We are testing at an incredible rate. 10+ times the daily testing that we did in April and more than double the daily administered tests compared to July. Most of the new positives are coming from this but there are also more new positives that end up getting very sick and are now in hospitals than at any time.....as we see from the graph #3.
5. Tests by Race. COVID doesn't care what your skin color is but a higher % of blacks are affected for several reasons.
6. Top 5 states hit hardest. Also have the highest populations.
Find this data here: https://coronavirus.1point3acres.com/en
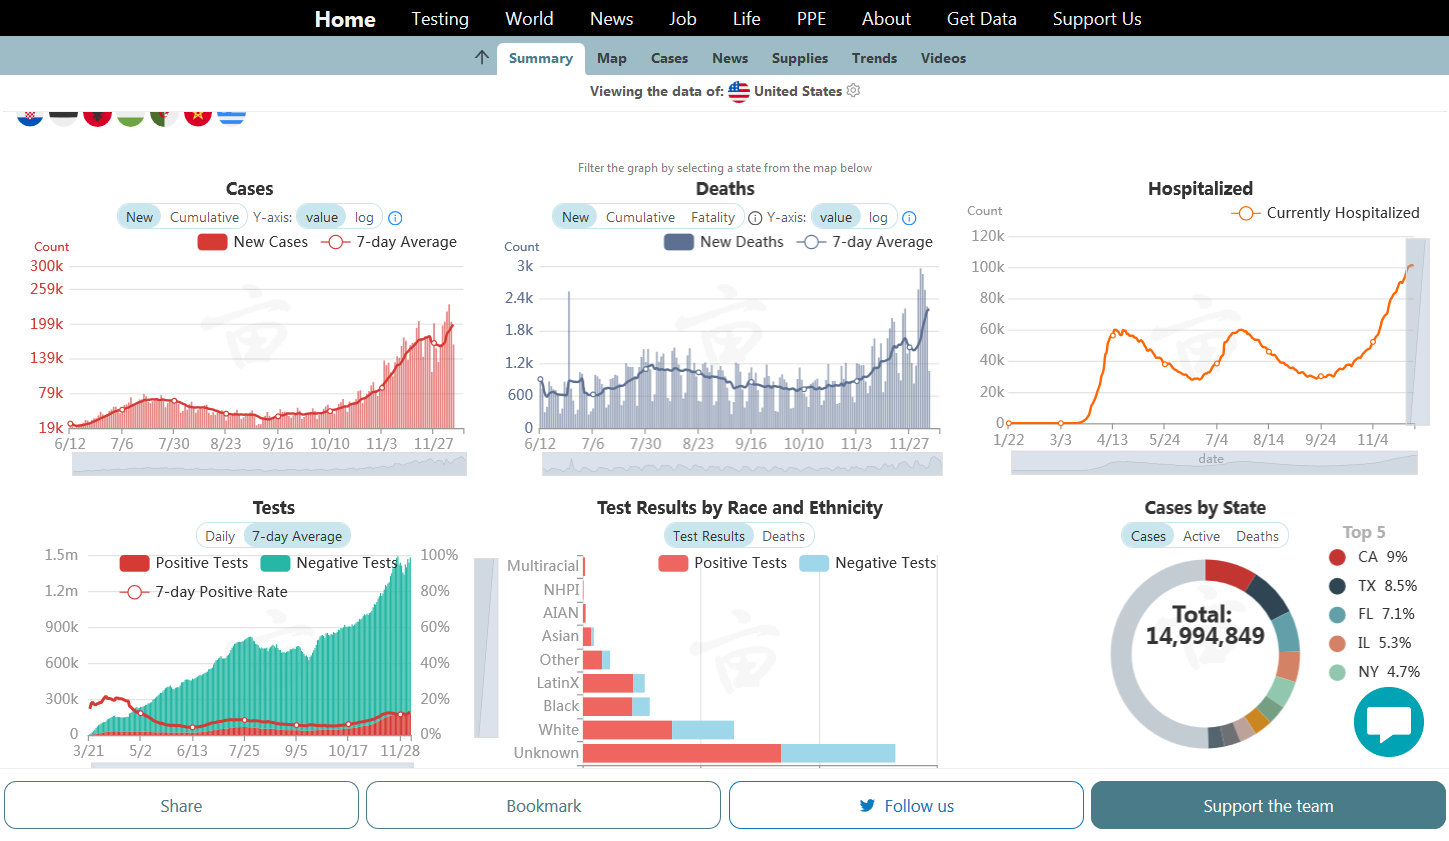
See previous explanation from above. Hospitalizations making a new high. Waiting to see if Thanksgiving is going to give us a spike higher in positives.
Find this data here: https://coronavirus.1point3acres.com/en

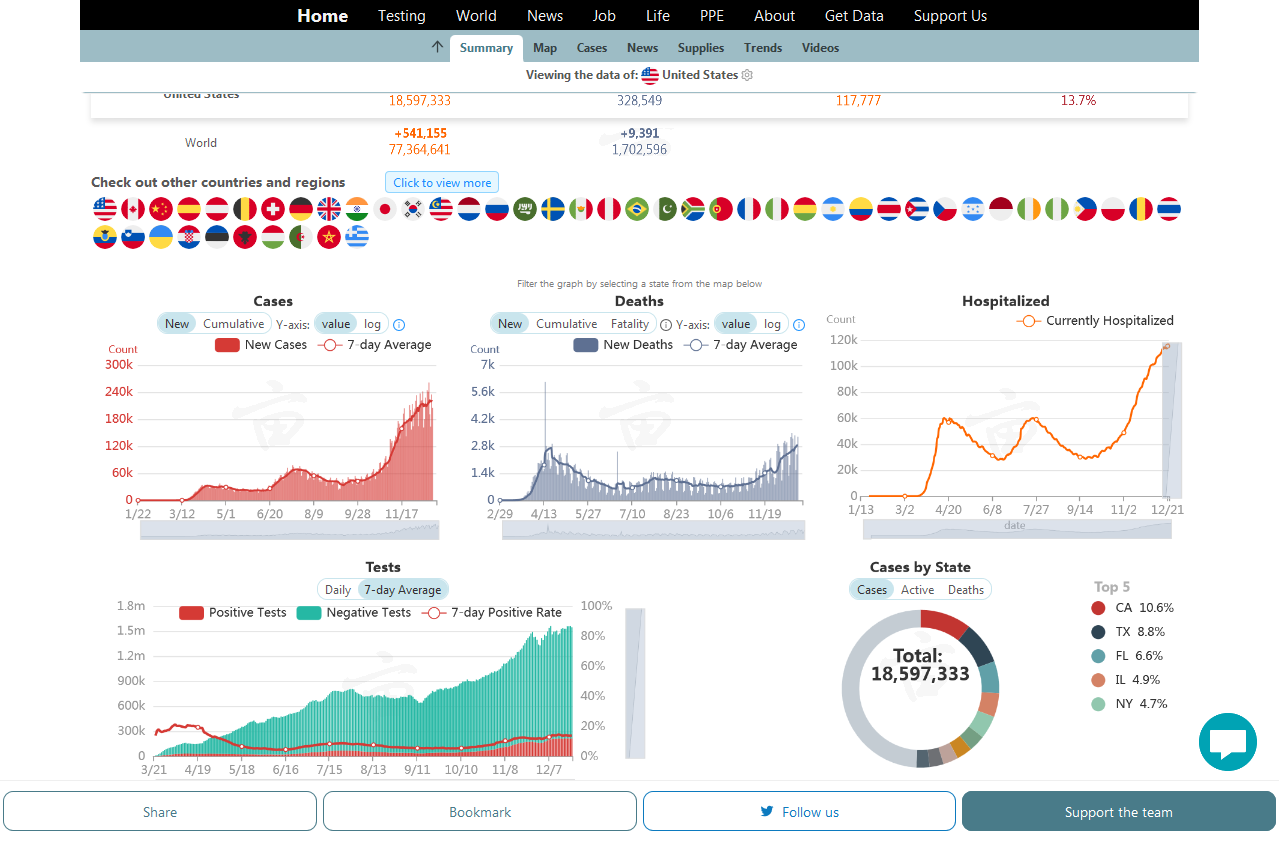
See previous explanation from above.
New positive cases, deaths and hospitalizations are all making new highs!
Find this data here: https://coronavirus.1point3acres.com/en
See previous explanation from above.
New positive cases, deaths and hospitalizations are all making new highs!
Find this data here: https://coronavirus.1point3acres.com/en

See previous explanation from above.
New positive cases, deaths and hospitalizations are all making new highs! It's pretty bad right now!
Find this data here: https://coronavirus.1point3acres.com/en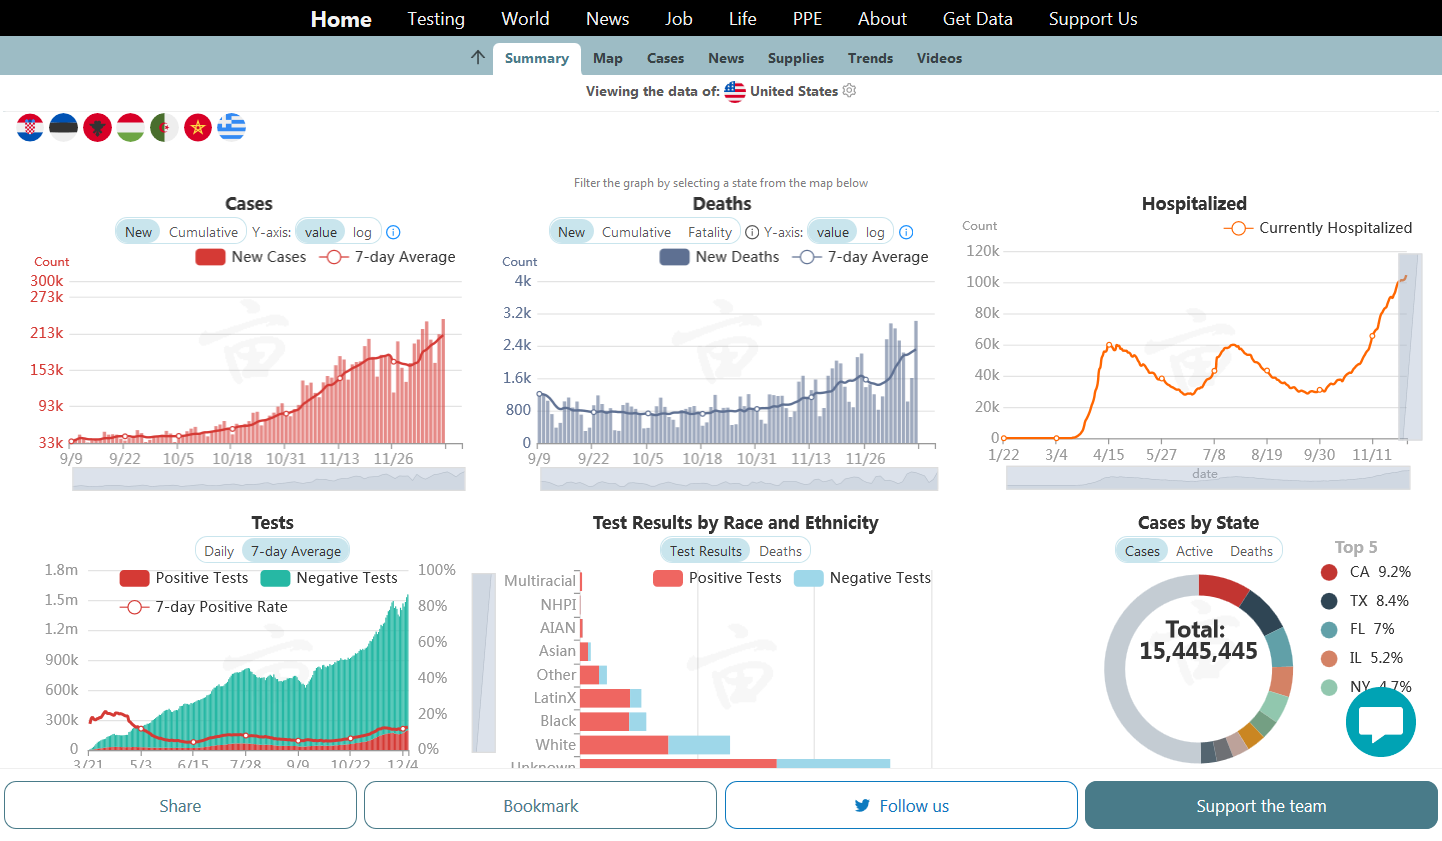
See previous explanation from above.
New positive cases, deaths and hospitalizations are all making new highs! It's pretty bad right now! Thank God the vaccine will start in less than 2 weeks. My geriatrics occupational therapy daughter will be one of the first to be inoculated. It will take a couple of months though to turn things around.
Find this data here: https://coronavirus.1point3acres.com/en
See previous explanation from above.
New positive cases, deaths and hospitalizations are all making new highs! It's pretty bad right now! Thank God the vaccine will start in a week. My geriatrics occupational therapist daughter will be one of the first to be inoculated. She gets the first COVID shot in a week, then a 2nd one, a booster in 90 days. It will take a couple of months to turn things around but things should start improving before Winter is over, then by the end of Spring, this will mostly be behind us!!! Next Summer, things can start getting back to normal!!!
Find this data here: https://coronavirus.1point3acres.com/en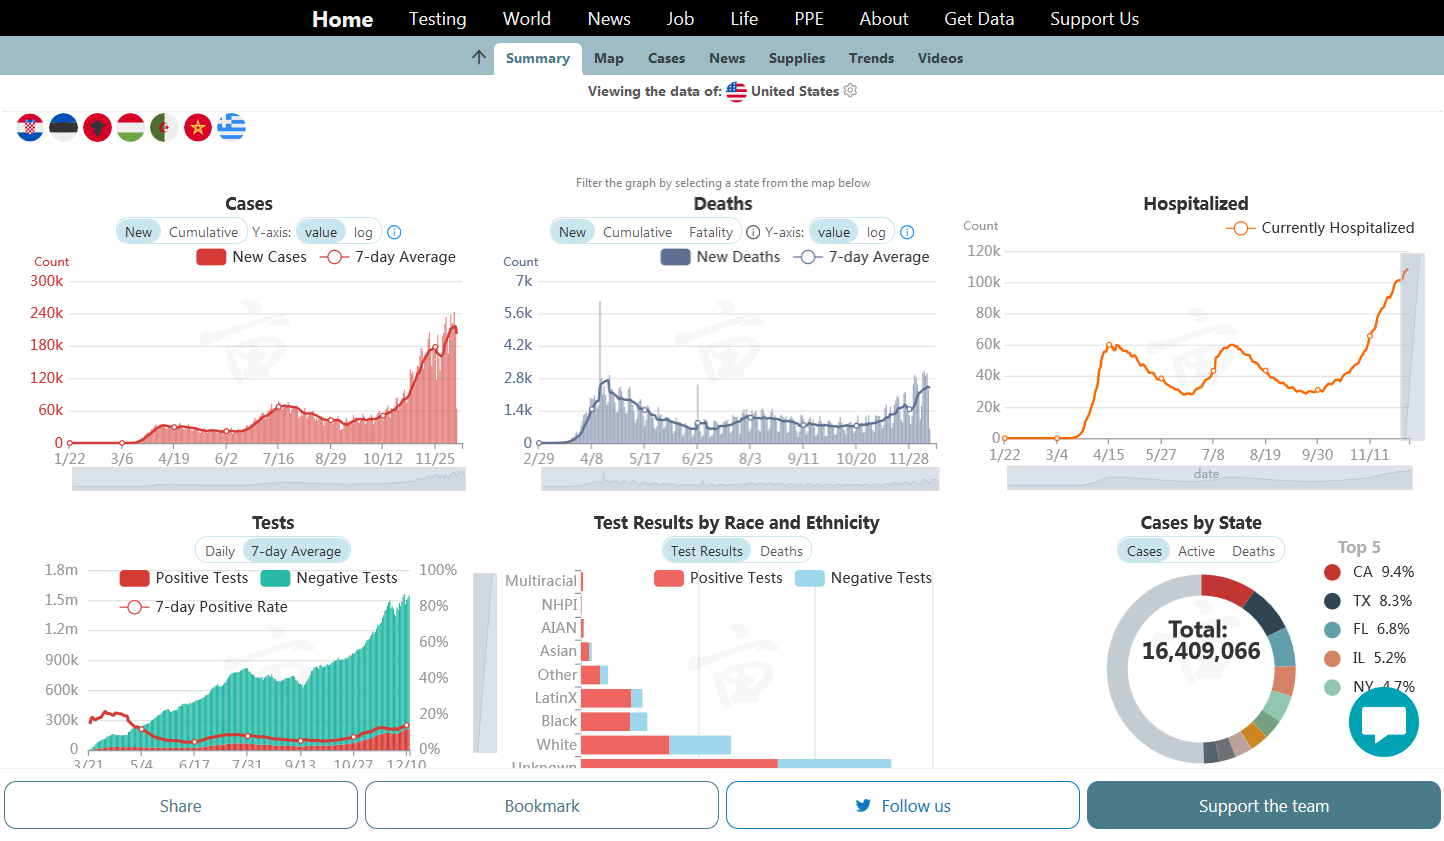
See previous explanations from above.
New positive cases, deaths and hospitalizations are all still making new highs! It's pretty bad right now! Thank God the vaccine is starting now. My geriatrics occupational therapist daughter will be one of the first to be inoculated in 6 days. She gets the first COVID shot in a week, then a 2nd one, a booster in 90 days. We all need to get it! It will take a couple of months to turn things around but things should start improving before Winter is over, then by the end of Spring, this will mostly be behind us!!! Next Summer, things can start getting back to normal!!!
Find this data here: https://coronavirus.1point3acres.com/en
See previous explanations from above.
New positive cases, deaths and hospitalizations are all still making new highs! It's pretty bad right now! Thank God the vaccine has startied. My geriatrics occupational therapist daughter will be one of the first to be inoculated in 2 days. She gets the first COVID shot in a week, then a 2nd one, a booster in 29 days. We all need to get it! It will take a couple of months to turn things around but things should start improving before Winter is over, then by the end of Spring, this will mostly be behind us!!! Next Summer, things can start getting back to normal!!!
Find this data here: https://coronavirus.1point3acres.com/en

See previous explanations from above.
New positive cases, deaths and hospitalizations are all still making new highs! It's pretty bad right now! Thank God the vaccine has started. My geriatrics occupational therapist daughter received her first shot today she will receive a 2nd one, a booster in 29 days. We all need to get it! It will take a couple of months to turn things around but things should start improving before Winter is over, then by the end of Spring, this will mostly be behind us!!! Next Summer, things can start getting back to normal!!!
Find this data here: https://coronavirus.1point3acres.com/en
See previous explanations from above.
New positive cases, deaths and hospitalizations are all still making new highs! It's pretty bad right now! Thank God the vaccine has started. My geriatrics occupational therapist daughter received her first shot yesterday. She will receive a 2nd one, a booster 29 days after this. We all need to get it! It will take a couple of months to turn things around but things should start improving before Winter is over, then by the end of Spring, this will mostly be behind us!!! Next Summer, things can start getting back to normal!!!
Find this data here: https://coronavirus.1point3acres.com/en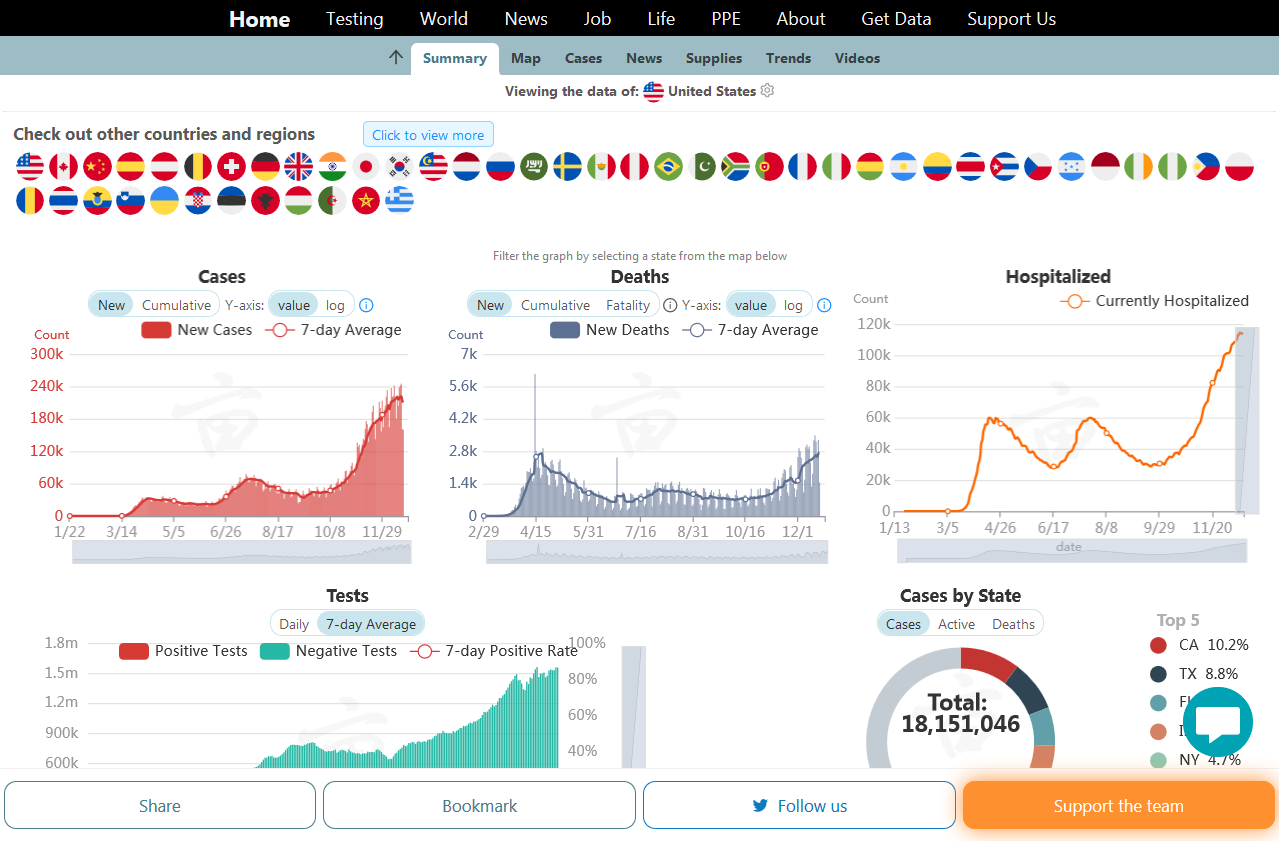
Wear an N95 Mask!
New positive cases, deaths and hospitalizations are all still making new highs! It's pretty bad right now! Thank God the vaccine has started. My geriatrics occupational therapist daughter received her first shot last Saturday. She will receive a 2nd one, a booster 29 days after this. We all need to get it! It will take a couple of months to turn things around but things should start improving before Winter is over, then by the end of Spring, this will mostly be behind us!!! Next Summer, things can start getting back to normal!!!
Find this data here: https://coronavirus.1point3acres.com/en

Wear an N95 Mask!
Stats not reliable the last several days because of the holidays.
Find this data here: https://coronavirus.1point3acres.com/en
Wear an N95 Mask!
Stats not reliable the last several days because of the holidays but they show lower numbers.
Find this data here: https://coronavirus.1point3acres.com/en
Wear an N95 Mask!
Stats may be less reliable because of the holidays but they show lower numbers and a possible peak.
Find this data here: https://coronavirus.1point3acres.com/en