Weather November 18, 2020
19 responses | 0 likes
Started by metmike - Nov. 17, 2020, 10:24 p.m.

Long time no see(read)!

Most maps below will automatically update each day.


Very mild into early December! Bearish natural gas prices!

Very Early morning European model is colder(not as mild but no pattern change to colder)!!


NEW: Detailed analysis. Latest COVID-19 numbers. .............COVID is killing people at a 5 times lower rate per positive cases,  compared to the Spring peak. That's the good news. The bad news is that daily positives are 4 times higher than the Spring peak and increasing everywhere with hospitals near capacity in many places.

https://www.marketforum.com/forum/topic/61206/


 Scroll down and  enjoy the latest comprehensive weather to the max...... occurring because of the natural physical laws in our atmosphere as life on this greening planet continues to enjoy the best weather/climate in at least 1,000 years(the last time that it was this warm) with the added bonus of extra beneficial CO2.


Reasons to keep being thankful here in 2020!

https://www.marketforum.com/forum/topic/45623/


Go to the link below, then hit the location/county on the map for details.

                 https://www.spc.noaa.gov/                 Go to "hazards"      


Here are the latest hazards across the country.

                                                            Southern Florida NE Gulf N of 25N E of 87WGulf from 22N to 25N E of 87W including Straits of Florida NW Gulf including Stetson BankN Central Gulf including Flower Garden Banks Marine SanctuaryW Central Gulf from 22N to 26N W of 94WCentral Gulf from 22N to 26N between 87W and 94W Atlantic from 27N to 31N W of 77WAtlantic from 27N to 31N between 70W and 77WAtlantic from 27N to 31N between 65W and 70WBahamas N of 22N including the Cay Sal BankAtlantic from 22N to 27N E of Bahamas to 70W Tropical N Atlantic from 15N to 19N between 55W and 60WCaribbean N of 18N between 76W and 85W including the Cayman BasinCaribbean N of 18N between 76W and 85W including the Cayman BasinCaribbean approaches to the Windward PassageAtlantic S of 22N W of 70W including approaches to the Windward PassageNewport/Morehead City, NCBrownsville, TXCorpus Christi, TXHouston/Galveston, TXNew Orleans, LALake Charles, LAMobile, ALTallahassee, FLTampa, FLMiami, FLKey West, FLFlorida KeysMiami, FLMelbourne, FLJacksonville, FLCharleston, SCWilmington, NCBaltimore/Washington, DCWakefield, VAPhiladelphia/Mt. Holly, PA/NJNew York, NYBoston, MAGray/Portland, ME Intra Coastal Waters from Schoodic Point ME to Stonington MECoastal Waters from Schoodic Point ME to Stonington ME out 25 NMWaters from Eastport ME to Stonington ME from 25 to 40 NMNortheast Minnesota and Northern WisconsinNorthern MichiganNorthern MichiganNorthern MichiganEast Central Wisconsin - Green BayEast Central Wisconsin - Green BaySouthern and Southeastern WisconsinNortheastern Illinois and Northwestern Indiana - ChicagoNorthern Indiana and Northwestern OhioSouthwestern MichiganNortheast Michigan - GaylordNortheast Michigan - GaylordNortheast Michigan - GaylordSoutheastern Michigan - DetroitSoutheastern Michigan - DetroitSoutheastern Michigan - DetroitNorthern OhioWestern New York - BuffaloWestern New York - Buffalo Northern MichiganLos Angeles, CASan Diego, CASan Francisco Bay Area/Monterey, CAEureka, CAMedford, ORPortland, ORSeattle, WALos Angeles AreaLos Angeles AreaLos Angeles AreaLos Angeles AreaLos Angeles AreaLos Angeles AreaSouth Central CaliforniaSan Francisco AreaWestern NevadaNorth Central CaliforniaNorthwest California CoastSouthwest Oregon and Northern CaliforniaNortheast Oregon and Southeast WashingtonNorthwest OregonNorthwest WashingtonEastern Washington and Northern IdahoSouthern Nevada, Southeastern California and Northwestern Arizona - Las VegasSouthwestern California - San DiegoCentral Arizona and California DesertsSoutheast ArizonaNorthern ArizonaUtahNorthern and Northeastern NevadaSouthwestern Idaho and Eastern OregonSoutheastern IdahoWestern Montana and Central IdahoCentral Montana - Great FallsNortheastern MontanaSoutheastern MontanaWestern WyomingSoutheastern Wyoming and Western NebraskaNortheastern ColoradoWestern Colorado and Eastern UtahSoutheastern ColoradoNorthern and Central New MexicoSouthern New Mexico and extreme Western Texas - El PasoTexas and OklahomaLubbock and South Plains TexasWestern Texas and Southeastern New MexicoWestern South Dakota and Northeastern WyomingNorthwestern Kansas and East Central Colorado - GoodlandCentral Nebraska - North PlatteNorth Central Kansas and South Central NebraskaSoutheastern South Dakota, Southwestern Minnesota, and Northwestern IowaNorthern and Northeastern South DakotaWestern North DakotaEastern Nebraska and Southwestern Iowa - Omaha ValleyNortheastern KansasSoutheastern KansasSouthwestern Kansas - Dodge CityCentral OklahomaEastern Oklahoma and Northwestern ArkansasDallas and Fort WorthCentral Texas - San AngeloAustin and San Antonio TexasCorpus Christi, Victoria, and Laredo TexasSouthern TexasTexas - Houston/GalvestonSoutheast Texas and Southwest LouisianaNorthern Louisiana and Eastern Texas - ShreveportArkansasSouthwestern MissouriNorthwestern MissouriCentral IowaSouthern MinnesotaNortheastern North Dakota and Northwestern MinnesotaNortheast Minnesota and Northern WisconsinSouthwestern Wisconsin, Southeastern Minnesota, and Northeast IowaEastern Iowa and Northwestern Illinois - Quad CitiesEastern Missouri - West Central IllinoisWestern Tennessee, Eastern Arkansas and Northern Mississippi - MemphisCentral MississippiSoutheastern LouisianaMiddle TennesseeNorthern AlabamaCentral AlabamaMobile - PensacolaWest Central FloridaEast Central FloridaPanhandle of Florida and Southwestern GeorgiaNortheast Florida and Southeast GeorgiaNorthern and Central GeorgiaLow Country of South Carolina and GeorgiaNortheastern South Carolina and Southeastern North Carolina - WilmingtonCentral South Carolina and CSRAWestern North Carolina and Northwest South CarolinaEastern TennesseeEastern KentuckyCentral KentuckySouthern Illinois and Indiana, Southeastern Missouri and Western KentuckyCentral and East Central IllinoisCentral IndianaNortheastern Illinois and Northwestern Indiana - ChicagoSouthern and Southeastern WisconsinEast Central Wisconsin - Green BayNorthern MichiganNortheast Michigan - GaylordNortheast Michigan - GaylordSoutheastern Michigan - DetroitSouthwestern MichiganNorthern Indiana and Northwestern OhioSouthwestern Ohio Northern KentuckyWest VirginiaWestern Virginia, Southeast West Virginia, and Northwest North CarolinaCentral North Carolina - RaleighEastern North CarolinaEastern Virginia, Southern Maryland and Northeast North CarolinaWashington D.C., Central Maryland, Northern Virginia, Eastern West VirginiaWestern Pennsylvania, East Central Ohio and Extreme Western MarylandNorthern OhioCentral PennsylvaniaNew Jersey, Delaware, and Southeastern PennsylvaniaNew York City and Surrounding AreasSouth Central New York and Northeastern PennsylvaniaWestern New York - BuffaloEastern New York and Western New England AreasBoston and Surrounding AreasNorthern Vermont and New YorkSouthern Maine and New HampshireNorthern Maine Gulf of Maine to the Hague LineGeorges Bank between Cape Cod and 68W north of 1000 fathomsSouth of New England between the Great South Channel and Montauk Point to 1000 fathomsSouth of Long Island between Montauk Point and Sandy Hook to 1000 fathomsHudson Canyon to Baltimore Canyon to 1000 fathomsBaltimore Canyon to Cape Charles Light to 100 NM offshoreCape Charles Light to Currituck Beach Light to 100 NM offshoreCurrituck Beach Light to Cape Hatteras to 100 NM offshoreCape Hatteras to Cape Fear to 100 NM offshoreCape Fear to 31N to 1000 FMGeorges Bank between 68W and the Hague LineEast of 69W to the Hague Line between 1000 fathoms and 39NEast of 69W and south of 39N to 250 NM offshoreBetween 1000 fathoms and 38.5N west of 69WBaltimore Canyon to 69W east of 1000 fathoms and south of 38.5N to 250 NM offshoreBaltimore Canyon to Hatteras Canyon between 100 NM and 250 NM offshoreHatteras Canyon to Cape Fear 100 NM and 250 NM offshoreCape Fear to 31N east of 1000 fathoms to 250 NM offshoreCape Flattery to Cape Shoalwater between 60 NM and 150 NM offshoreCape Shoalwater to Cape Lookout between 60 NM and 150 NM offshoreCape Lookout to Florence, OR between 60 NM and 150 NM offshoreFlorence, OR to Point St. George between 60 NM and 150 NM offshorePoint St. George to Point Arena between 60 NM and 150 NM offshorePoint Arena to Pigeon Point between 60 NM and 150 NM offshorePigeon Point to Point Piedras Blancas between 60 NM and 150 NM offshorePoint Piedras Blancas to Santa Cruz Island, CA between 60 NM and 150 NM offshoreSanta Cruz Island, CA to San Clemente Island, CA between 60 NM and 150 NM offshoreCape Flattery to Cape Shoalwater between 150 NM and 250 NM offshoreCape Shoalwater to Cape Lookout between 150 NM and 250 NM offshoreCape Lookout to Florence, OR between 150 NM and 250 NM offshoreFlorence, OR to Point St. George between 150 NM and 250 NM offshorePoint St. George to Point Arena between 150 NM and 250 NM offshorePoint Arena to Pigeon Point between 150 NM and 250 NM offshorePigeon Point to Point Piedras Blancas between 150 NM and 250 NM offshorePoint Piedras Blancas to Santa Cruz Island, CA between 150 NM and 250 NM offshoreSanta Cruz Island, CA to 120W between 150 NM and 250 NM offshoreSan Clemente Island, CA to Guadalupe Island from 60 NM Offshore west to 120W                                                                                                                                                                  


Purple/Pink/blue on land is cold/Winter weather. Brown is wind,  Green is flooding. Gray is fog.  Reddish is a red flag advisory.  

Go to the link below, then hit the location/county on the map for details.

                 https://www.spc.noaa.gov/                 Go to "hazards"                                                                                     


https://www.mesonet.org/index.php/weather/map/us_air_temperature/air_temperature


https://www.mesonet.org/index.php/weather/map/wind_chill_heat_index1/air_temperature


 Current Weather Map


NCEP Days 0-7 Forecast Loop
NCEP Short-Range Model Discussion
NCEP Day 3-7 Discussion


Understanding These Maps
Surface Map Legend
Precip Legend
NCEP Surface Maps
(Mouseover)

U.S. Surface Analysis
National Radar Image
12-Hr Forecast
24-Hr Forecast
36-Hr Forecast
48-Hr Forecast
Short Term Loop
Day 3 Forecast
Day 4 Forecast
Day 5 Forecast
Day 6 Forecast
Day 7 Forecast
Low Tracks Error Circle
Low Tracks Ensemble


Legend


Current Jet Stream


Low Temperatures Tomorrow Morning


Highs today and tomorrow.


Comments
By metmike - Nov. 17, 2020, 10:26 p.m.
Like Reply

Highs for days 3-7:


Mild by November standards for much of the country


http://www.wpc.ncep.noaa.gov/medr/DAY3_MAX_filled.gif

https://www.wpc.ncep.noaa.gov/medr/DAY4_MAX_filled.gif

http://www.wpc.ncep.noaa.gov/medr/DAY5_MAX_filled.gifhttp://www.wpc.ncep.noaa.gov/medr/DAY6_MAX_filled.gif


https://www.wpc.ncep.noaa.gov/medr/DAY7_MAX_filled.gif


By metmike - Nov. 17, 2020, 10:28 p.m.
Like Reply

Lows days 3-7 below:

Mild for this time of year, especially East and South!


https://www.wpc.ncep.noaa.gov/medr/medr_min.shtml

https://www.wpc.ncep.noaa.gov/medr/DAY3_MIN_filled.gifhttps://www.wpc.ncep.noaa.gov/medr/DAY4_MIN_filled.gifhttps://www.wpc.ncep.noaa.gov/medr/DAY5_MIN_filled.gifhttps://www.wpc.ncep.noaa.gov/medr/DAY6_MIN_filled.gifhttps://www.wpc.ncep.noaa.gov/medr/DAY7_MIN_filled.gif


By metmike - Nov. 17, 2020, 10:29 p.m.
Like Reply

Temperatures compared to Average for days 3-7


Positive departures dominate!


https://www.wpc.ncep.noaa.gov/medr/medr_mean.shtml


https://www.wpc.ncep.noaa.gov/medr/DAY3-7_MAX_ANOM_filled.gif


https://www.wpc.ncep.noaa.gov/medr/DAY3-7_MIN_ANOM_filled.gif


By metmike - Nov. 17, 2020, 10:30 p.m.
Like Reply

Surface Weather features days 0-1-2 then days 3-7:


Active front this weekend. 


https://www.cpc.ncep.noaa.gov/products/forecasts/

Days 0-1-2 below:


Forecast of Fronts/Pressure and Weather valid Sun 18Z


Forecast of Fronts/Pressure and Weather valid Mon 12Z

Forecast of Fronts/Pressure valid Tue 12Z


Days 3-7 below:
https://www.wpc.ncep.noaa.gov/medr/5dayfcst_wbg_conus.gif


By metmike - Nov. 17, 2020, 10:31 p.m.
Like Reply

Liquid equivalent precip forecasts for the next 7 days are below.


Turning wet this weekend!

Day 1 below


http://www.wpc.ncep.noaa.gov/qpf/fill_94qwbg.gif?1526306199054

http://www.wpc.ncep.noaa.gov/qpf/fill_94qwbg.gif?1531339983148

Day 2 below:

http://www.wpc.ncep.noaa.gov/qpf/fill_98qwbg.gif?1528293750112


http://www.wpc.ncep.noaa.gov/qpf/fill_98qwbg.gif?1531340045174


Day 3 below

http://www.wpc.ncep.noaa.gov/qpf/fill_99qwbg.gif?1528293842764

http://www.wpc.ncep.noaa.gov/qpf/fill_99qwbg.gif?1531340092706


Days 4-5 below:

http://www.wpc.ncep.noaa.gov/qpf/95ep48iwbg_fill.gif?1526306162

http://www.wpc.ncep.noaa.gov/qpf/95ep48iwbg_fill.gif?1531339379

 Days 6-7 below:

http://www.wpc.ncep.noaa.gov/qpf/97ep48iwbg_fill.gif?1526306162

http://www.wpc.ncep.noaa.gov/qpf/97ep48iwbg_fill.gif?1531339379

7 Day Total precipitation below:

https://www.wpc.ncep.noaa.gov/qpf/p168i.gif?1566925971


https://www.wpc.ncep.noaa.gov/qpf/p168i.gif?1566925971


By metmike - Nov. 17, 2020, 10:32 p.m.
Like Reply

Excessive rain potential.

Increasing this weekend to slight risk areas.

Mesoscale Precipitation Discussions


Current Day 1 ForecastCurrent Day 1 Excessive Rainfall Forecast


Day 1 Threat Area in Text Format  


  Day 2 and Day 3 Forecasts 
Current Day 2 ForecastCurrent Day 2 Excessive Rainfall Forecast


Day 2 Threat Area in Text Format 


Current Day 3 ForecastCurrent Day 3 Excessive Rainfall Forecast


By metmike - Nov. 17, 2020, 10:33 p.m.
Like Reply

Severe Storm Risk the next 8 days:

Low risk!

https://www.spc.noaa.gov/


Current Day 1 Outlook
        1300 UTC Day 1 Outlook             
               
          Current Day 2 Outlook
          0600 UTC Day 2 Outlook               
         
          Current Day 3 Outlook
          0600 UTC Day 3 Outlook               
                F
          Current Day 4-8 Outlook
          Day 4-8 Convective Outlook


By metmike - Nov. 17, 2020, 10:35 p.m.
Like Reply

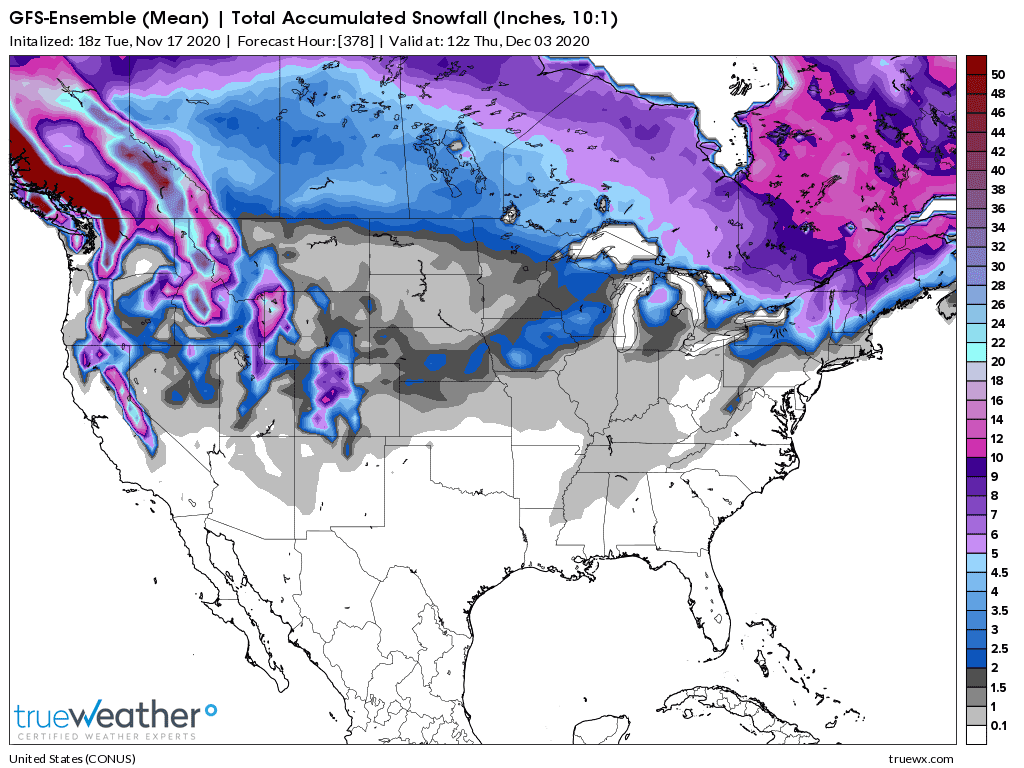
Total snow accumulation the next 2 weeks from the GFS ensemble mean model:

Not much Plains eastward.


Weather Model

By metmike - Nov. 17, 2020, 10:37 p.m.
Like Reply

Last 24 hour precip top map

Last 7 day precip below that

https://www.wunderground.com/maps/precStatic map

By metmike - Nov. 17, 2020, 10:38 p.m.
Like Reply

Current Dew Points

Widespread very dry air in place!


Current Dew Points


Latest radar loop


http://www.nws.noaa.gov/radar_tab.php

Doppler Radar National Mosaic Loop


Upper Mississippi Valley sector loop


 (3400x1700 pixels - 2.2mb)
Go to: Most Recent Image


Central Great Lakes sector loop
Go to: Most Recent Image


    You can go to this link to see precipitation totals from recent time periods:


https://water.weather.gov/precip/


                              Go to precipitation, then scroll down to pick a time frame. Hit states to get the borders to see locations better. Under products, you can hit "observed" or "Percent of Normal"


Soilmoisture anomaly:


These maps sometimes take a day to catch up to incorporate the latest data(the bottom map is only updated once a week).


https://www.cpc.ncep.noaa.gov/products/Soilmst_Monitoring/US/Soilmst/Soilmst.shtml#


Daily Soil Moisture Pecentile       

        Daily Anomaly Soil Moisture (mm)

        Monthly Soil Moisture Change

https://www.cpc.ncep.noaa.gov/products/analysis_monitoring/regional_monitoring/palmer.gif


By metmike - Nov. 17, 2020, 10:55 p.m.
Like Reply

Drought Monitor maps:

Latest: The first map below is the latest. The 2nd one is from last week.


April 23: LOOKY_LOOKY!  For the first time this year, its gotten dry enough for a few (small)areas in the Upper Midwest/Western Cornbelt to report slight drought.

April 30: Drought increased a bit......Plains and U.Midwest.

May: 7:  Drought increased a bit from KS westward.

May 14: Drought increased a bit again, now, parts of Iowa have slight drought(this dry weather is why planting is ahead of schedule). Rains are coming to the dry spots in the forecast though.......bearish.

May 21:  A bit more drought in ND.

May 28: Not much change

June 4: Drought increases a tad in the N.Plains and Upper Midwest.

June 10: Drought worsening in the S.Plains could be part of the La Nina signal!!

June 17: Drought got worse again in the S.Plains and yellows/slight drought emerged in new locations............all of Indiana.

June 24: Drought help in some places(KS) but increased a bit in others(ND).

July 1: Drought shrunk in Ohio Valley(I got 5.5 inches of rain in sw INdiana!) but not much change elsewhere. Surprised it didn't shrink more in IN/IL where some places(Bowyer) got great rains recently.

July 8: The main change was an increase over w.IA and e.NE. At the end of July with the hot/dry weather coming up, the S.Plains drought should expand into the S.Midwest to the Eastern Cornbelt.

July 15: Drought increased again over IA/MO/IN/OH. In july, evaporation usually exceeds rainfall, so some of this is seasonal. Hot temps coming up will accelerate evaporation.

July 22: Some Recent rains in IN did not make the cutoff.

July 29: Main dry spots are W.Iowa and IN/OH. Upcoming rains prospects good for ECB.

August 6: Drought got much worse in Iowa.

August 13: Looks like rains on Monday made no difference to W.IA drought(only around 1 inch).

August 20: IA is very dry.........into N.IL now.

August 27: Drought got worse in IA!!

September 3:  Drought worse in IA and IL, N.IN!

September 10: We should probably be noting the real drought out West. The Rockies back to OR is the most severe.

October 1: La Nina driven severe drought out West, some of which has pushed into the Plains and even parts of the Midwest in recent months.

Oct. 7: Drought intensifies..............which is not unusual since this is the driest time of year seasonally.

November 5: Drought improves in the S.Plains!

November 12: Not much change. Hard to increase drought at this time of year with the cooler temperatures.


      https://droughtmonitor.unl.edu/     

Drought Monitor for conus


Drought Monitor for conus


By metmike - Nov. 17, 2020, 10:57 p.m.
Like Reply

The top map is the Canadian ensemble average,  the maps below are the individual members that make up the average at the end of week 2.

+++++++++++++++++++++++++++++++++++++++++

Each member is like the parent, Canadian model operational model.......with a slight tweek/variation in parameters. Since we know the equations to represent the physics of the atmosphere in the models are not perfect, its useful to vary some of the equations that are uncertain(can make a difference) to see if it effects the outcome and how.

The average of all these variations(ensembles) often yields a better tool for forecasting. It's always more consistent. The individual operational model, like each individual ensemble member can vary greatly from run to run.........and represent an extreme end of the spectrum at times. The ensemble average of all the members, because it averages the extremes.............from opposite ends of the spectrum.........changes much less from run to run.

End of week 2....................0z  Canadian ensembles:

Wednesday November 18: Waiting on maps


By metmike - Nov. 17, 2020, 11:02 p.m.
Like Reply

Individual GFS ensemble solutions for the latest 12z run at 360 hours:

http://mp1.met.psu.edu/~fxg1/ENSHGT_0z/f384.gif

Wednesday, November 18: Good agreement of no major cold intrusions with colder air from the high latitudes cut off.

http://mp1.met.psu.edu/~fxg1/ENSHGT_0z/f384.gif


By metmike - Nov. 17, 2020, 11:07 p.m.
Like Reply

GFS Ensemble mean(average of all the individual solutions above).  The first map is a mid/upper level map. The 2nd one is a temperatures map at around 1 mile above the surface. These are anomalies(difference compared to average).

NCEP Ensemble t = 360 hour forecast


Wednesday November 18: Positive anomalies across most of the country. Greatest positives and warmth during week 2 shifting to the center of the country. No chance with this configuration during week 2 for meridional flow to transport cold from high latitudes to mid latitudes. It would actually need to be the complete opposite of this set up. 

https://www.psl.noaa.gov//map/images/ens/z500anom_f168_nhbg.gif


https://www.psl.noaa.gov//map/images/ens/t850anom_f168_nhbg.gif


2 weeks out below

NCEP Ensemble t = 360 hour forecast product


https://www.esrl.noaa.gov/psd/map/images/ens/t850anom_f360_nhbg.gif

                                    ++++++++++

By metmike - Nov. 17, 2020, 11:12 p.m.
Like Reply

Latest, updated graph/forecast for AO and NAO and PNA here, including an explanation of how to interpret them...............mainly where they stand at the end of 2 weeks


https://www.marketforum.com/forum/t


Previous analysis, with the latest day at the bottom for late week 2 period.

Discussions, starting with the oldest  below.


Wednesday, November 18: +AO and +NAO are unfavorable for cold air delivery thru 2 weeks but they drop closer to 0 by the end of 2 weeks, which increases chances for cold intrusions........ though there are no signs of MAJOR cold then. PNA near 0.


By metmike - Nov. 17, 2020, 11:13 p.m.
Like Reply

National Weather Service 6-10 day, 8-14 day outlooks.

 Updated daily just after 2pm Central.


Temperature Probability


6 to 10 Day Outlook - Temperature Probability Precipitation Probability


  6 to 10 Day Outlook - Precipitation Probability


the 8-14 day outlooks
ArchivesAnalogsLines-Only FormatGIS Data

Temperature Probability

8 to 14 Day Outlook - Temperature Probability
8 to 14 Day Outlook - Precipitation Probability


By metmike - Nov. 17, 2020, 11:42 p.m.
Like Reply

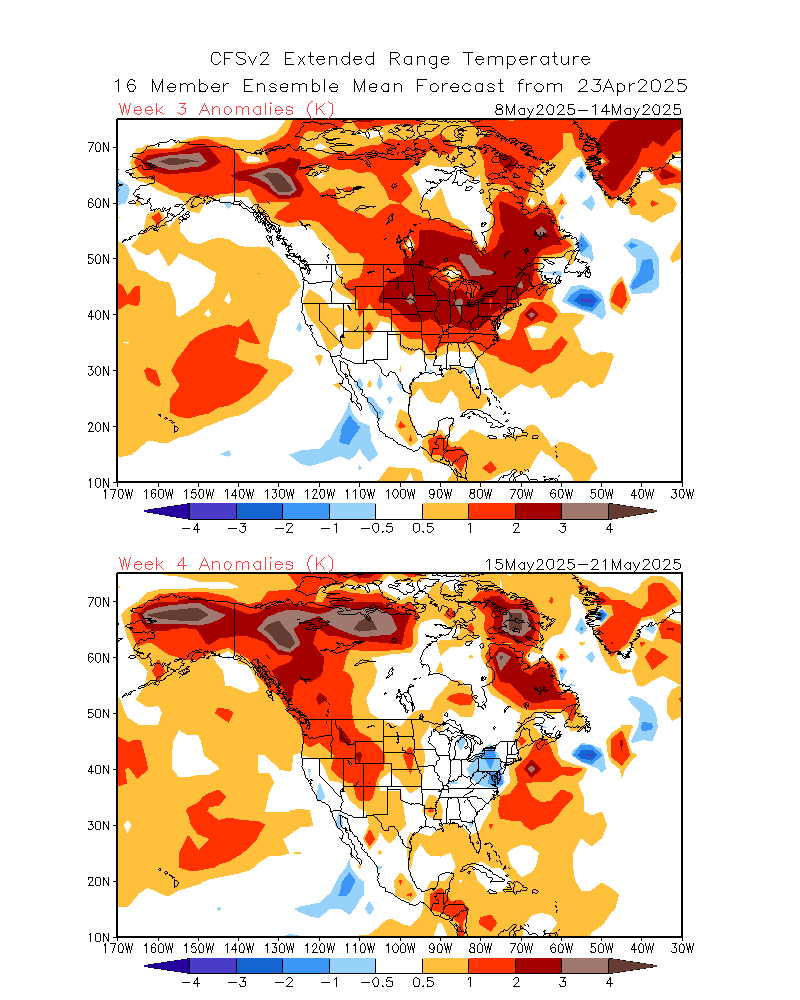
Even the week 3 and week 4 CFS model looks very mild!

https://www.cpc.ncep.noaa.gov/products/people/mchen/CFSv2FCST/weekly/images/wk3.wk4_latest.NAsfcT.png

By metmike - Nov. 18, 2020, 2:54 a.m.
Like Reply

Early morning European model is colder(not as mild but not a pattern change-just more HDD's in the same general pattern-for now)!

By metmike - Nov. 20, 2020, 12:17 p.m.
Like Reply

Ridge West, Trough East couplet may be forming and amplifying in week 2 which could signal a pattern change to colder in the Eastern half of the country in week 2 and beyond.