https://www.marketwatch.com/story/oil-prices-edge-higher-after-inventory-fall-11610543055
The Energy Information Administration said U.S. crude inventories fell by 3.2 million barrels last week, slightly less than the 3.8 million barrel drop expected by analysts surveyed by S&P Global Platts. It was also smaller than the 5.8 million fall said to be reported by the American Petroleum Institute late Tuesday.
The overall trend for supply, and oil production, “still is on a downward trajectory,” said Phil Flynn, analyst at Price Futures Group, in a note. “The oil market trend towards our near-term target of $55 is intact and while we may see a pullback from that area, this summer, prices will be much higher.”
Gasoline inventories increased by 4.4 million barrels last week, according to EIA, while distillate stocks rose 4.8 million barrels. The S&P Global Platts analysts had penciled in a 3.2 million barrel rise in gasoline stocks and a 2.8 million barrel rise in distillate inventories.
WTI was struggling to extend its winning streak to seven sessions, with crude prices underpinned globally by Saudi Arabia’s decision last week to cut production by 1 million barrels a day in February and March. Analysts said crude could be vulnerable to a near-term pullback.
“Negative news flow on the global macro front or problems with the rollout of COVID vaccines can trigger a sharp fall in oil prices,” said Stephen Innes, chief global market strategist at Axi, in a note.
“Still, Saudi’s willingness to support the oil price does limit downside risk this year, but one must believe that Brent above $57 a barrel is susceptible to bad news,” he said.
Latest Release Jan 13, 2021 Actual-3.247M Forecast-2.266M Previous-8.010M
https://www.investing.com/economic-calendar/eia-crude-oil-inventories-75
| Release Date | Time | Actual | Forecast | Previous | |
|---|---|---|---|---|---|
| Jan 13, 2021 | 10:30 | -3.247M | -2.266M | -8.010M | |
| Jan 06, 2021 | 10:30 | -8.010M | -2.133M | -6.065M | |
| Dec 30, 2020 | 10:30 | -6.065M | -2.583M | -0.562M | |
| Dec 23, 2020 | 10:30 | -0.562M | -3.186M | -3.135M | |
| Dec 16, 2020 | 10:30 | -3.135M | -1.937M | 15.189M | |
| Dec 09, 2020 | 10:30 | 15.189M | -1.424M | -0.679M |
Weekly US ending stocks of crude oil.
https://www.eia.gov/dnav/pet/hist/LeafHandler.ashx?n=PET&s=WCRSTUS1&f=W
Weekly ending stocks for unleaded gasoline.
https://www.eia.gov/dnav/pet/hist/LeafHandler.ashx?n=PET&s=WGTSTUS1&f=W
Weekly US ending stocks for distillate fuel oil(heating oil-especially used in the Northeast).
https://www.eia.gov/dnav/pet/hist/LeafHandler.ashx?n=PET&s=WDISTUS1&f=W
Crude 3 month chart
| |
Crude 1 year chart below
| |
Crude 5 year chart below
| |
Crude 10 year chart below
| |
Unleaded Gasoline Price Charts:
| |
| |
5 year........are we headed back to the highs?
| |
Current gas prices.
https://www.gasbuddy.com/GasPriceMap?z=4&lng=-96.591588&lat=38.822395
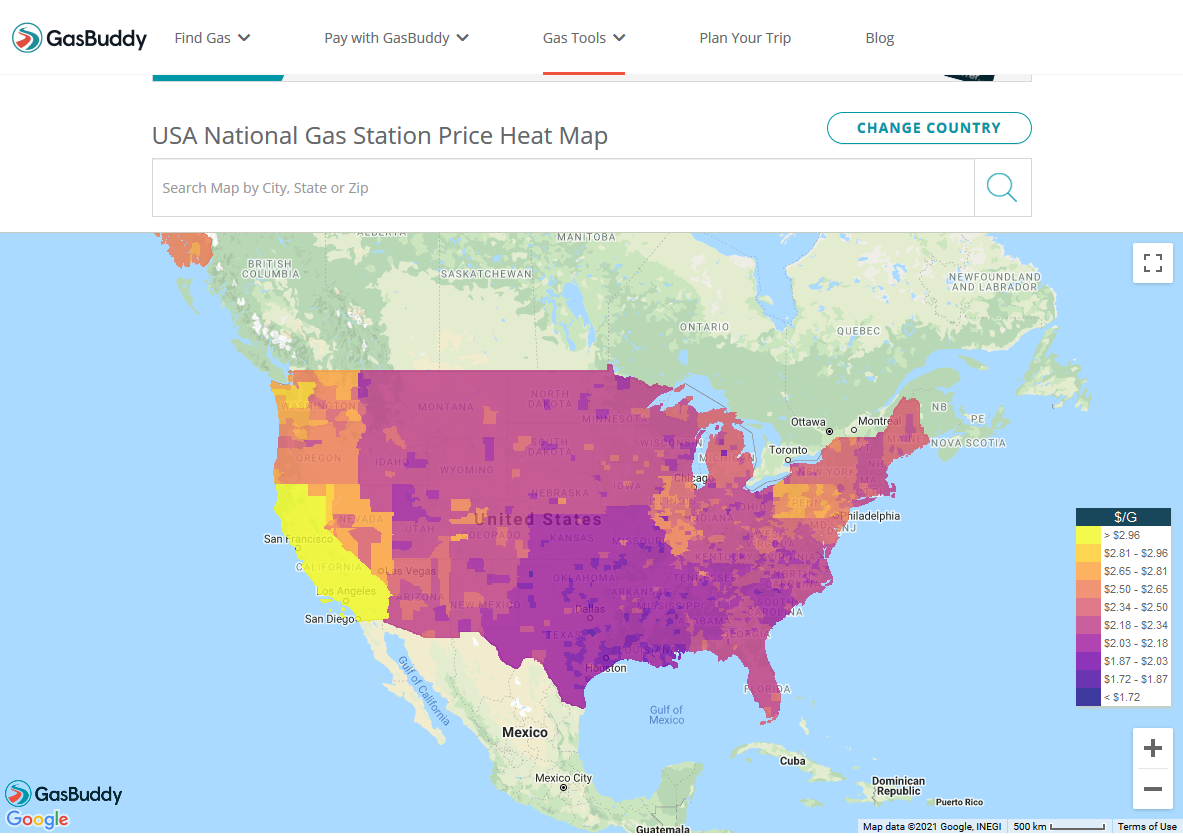
Why are west coast gasoline prices higher?
https://www.quora.com/Why-are-west-coast-gasoline-prices-higher