Thanks pj!
July is the hottest month of the year, so it's expected that records in July would be most likely to be all time records for heat.
The planet hasn't been this hot since the Medieval Warm Period, 1,000 years ago, so the slow warming would be expected to be setting more records for heat. We've warmed the planet by around 1 Deg. C in the past 150 years(1.6 Deg F).
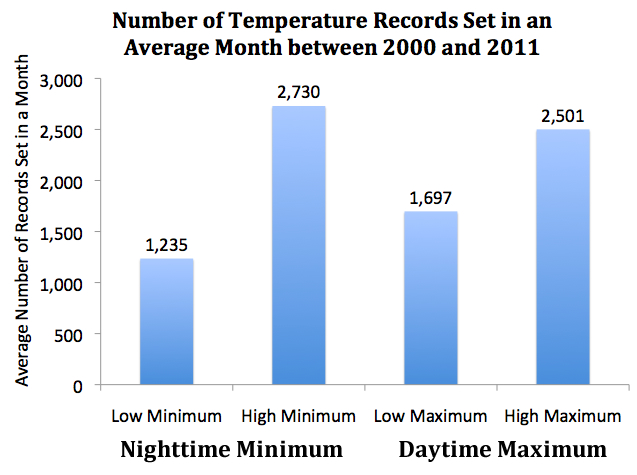
It's actually nightime lows that are setting the most records for warmth and its the highest latitudes in the coldest times of year, that have experienced the most warmth.
Graphs and data to show that shortly:
http://www.climatecentral.org/blogs/record-warm-nighttime-temperatures-a-closer-look
Latest satellite measured,. monthly global temperature.....+0.21 Deg C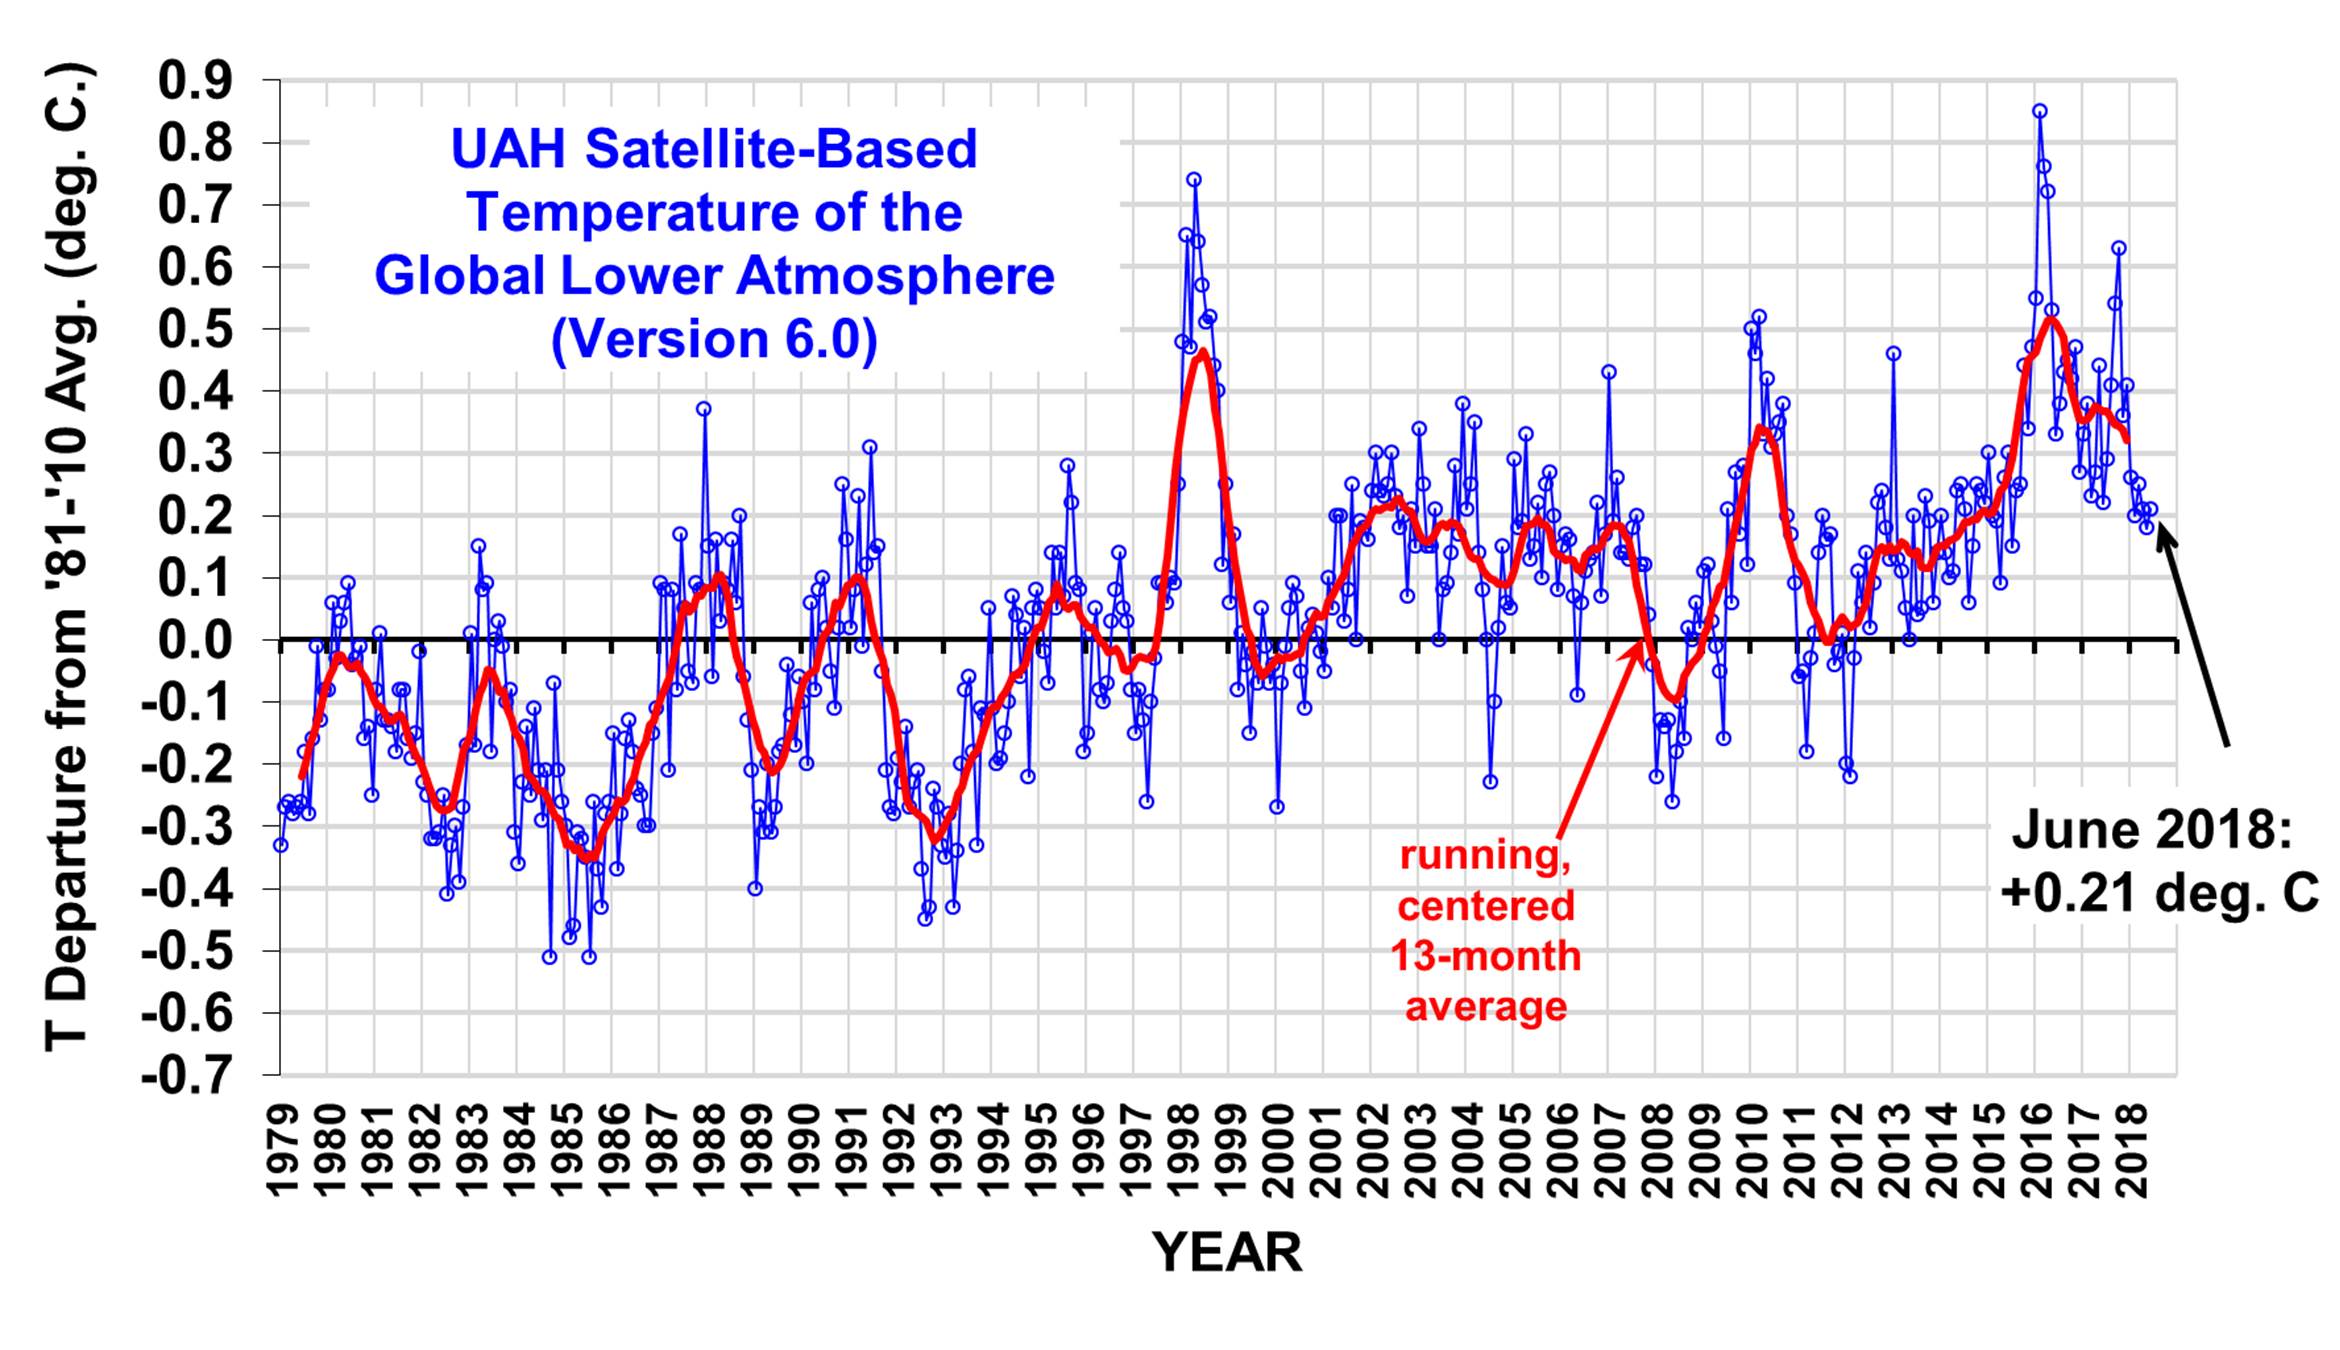 The big question should be: Is that rate of warming catastrophic as we are being told....or has it even been harmful so far?
In the hottest times of year, like right now, the answer is an irrefutable yes to it being harmful.
Going outside this time of year and considering the massive benefits from an increase in world food production and a greening planet gives the opposite answer.
Record heat, especially in the hottest month of the year is definitely a bad thing for many locations.
Is it unprecedented in the US?
Not even close to the 1930's. We all know about the Dust Bowl.......but even you aren't old enough to remember it.
Does this matter? I guess only if you want to view it objectively with a realistic, historically accurate perspective.

Places in California and Africa setting all time high temperature records is certainly very impressive......even if we would expect all time temperature records in some places EVERY July.
It would be much more unusual, if we were not setting records..........and most of the planet had close to their average temperature all month. That NEVER happens because weather patterns ALWAYS feature extreme warmth and extreme cool in some places at all times.
Weather records from accurate instruments are around 130 years old. So we are smashing 130 year old records. Pretty impressive but what if our thermometers went back 13,000 years. 130 years would represent just 1% of that time.
Going back 13 million years means 130 years is a minuscule fraction of that time, much of which was so much warmer than it is now, that it would be impossible to break any records for heat if we considered a time frame that long.
But that doesn't mean that increasing CO2 has not increased global temperatures, at least half of the 1 Deg. C of warming that has occurred over the last 150 years.
In physics, we know that CO2 is a greenhouse gas.
You will note that the 1930's featured the decade with the MOST record high state temperatures set in the US.
https://en.wikipedia.org/wiki/U.S._state_temperature_extremes
The temperature graph below, looks pretty scary/ominous. Note that the Y axis coordinates were chosen so the temperature goes from the bottom to the top in 140 years:

Here's another, longer term view that provides a wider perspective......this has happened several times before in the last 4,000 years (Medieval, Roman and Minoan WARM periods really did happen and really were at least this warm):
