About time for a new weather thread, wouldn't you say??
Latest radar and surface conditions, updated constantly
THE TOP RADAR HAS NOT BEEN UPDATED RECENTLY.............use the 2nd one please.
In July for the planted crop.
1. Rains make grain
2. Failed rains make for price gain.
3. On rare occasions..........too much rain can damage grain
https://www.wunderground.com/maps/radar/current
This link below provides some great data. Hit the center of the box below for the area that you want, then go to observation on the far left, then surface observations to get constantly updated surface observations.
 |
Current Conditions below updated every few minutes.
https://www.spc.noaa.gov/exper/mesoanalysis/new/viewsector.php?sector=13#


Surface moisture in the air:

The latest rain forecasts are below.
Day 1 below:
http://www.wpc.ncep.noaa.gov/qpf/fill_94qwbg.gif?1526306199054

Day 2 below:
http://www.wpc.ncep.noaa.gov/qpf/fill_98qwbg.gif?1528293750112

Day 3 below:
http://www.wpc.ncep.noaa.gov/qpf/fill_99qwbg.gif?1528293842764

Days 4-5 below:
http://www.wpc.ncep.noaa.gov/qpf/95ep48iwbg_fill.gif?1526306162

Days 6-7 below:
http://www.wpc.ncep.noaa.gov/qpf/97ep48iwbg_fill.gif?1526306162

7 Day Total precipitation below:
http://www.wpc.ncep.noaa.govcdx /qpf/p168i.gif?1530796126

Excessive rain threat.
https://www.wpc.ncep.noaa.gov/qpf/excess_rain.shtml
Current Day 1 Forecast
Day 1 Threat Area in Text Format
Current Day 2 Forecast |

Severe Storm Risk.
https://www.spc.noaa.gov/products/outlook/
Current Day 1 Outlook | |
Current Day 2 Outlook | |
Current Day 3 Outlook | |
Current Day 4-8 Outlook |
Mike,
A strong tropical wave or possibly even a TD is going to make landfall tomorrow toward sunset in or near the GA/SC line near SAV. This will result in a breezy showery day especially in coastal and SE SC/GA with the potential for several inches of rain in a short period due to scattered heavy tropical downpours. Also, expect a windy day mainly along the SC coast but maybe also for the upper Ga coast, too, if the center tracks into GA.
Extended weather.
https://www.cpc.ncep.noaa.gov/products/predictions/610day/ | |||||||||
| 6 to 10 day outlooks | |||||||||
| Click below for information about how to read 6-10 day outlook maps Temperature Precipitation | |||||||||
| Click below for archives of past outlooks (data & graphics), historical analogs to todays forecast, and other formats of the 6-10 day outlooks ArchivesAnalogsLines-Only FormatGIS Data | |||||||||
Temperature Probability | |||||||||
Precipitation Probability | |||||||||
Soilmoisture anomaly:
These maps sometimes take a day to catch up to incorporate the latest data(the bottom map is only updated once a week).
https://www.cpc.ncep.noaa.gov/products/Soilmst_Monitoring/US/Soilmst/Soilmst.shtml#
![]()


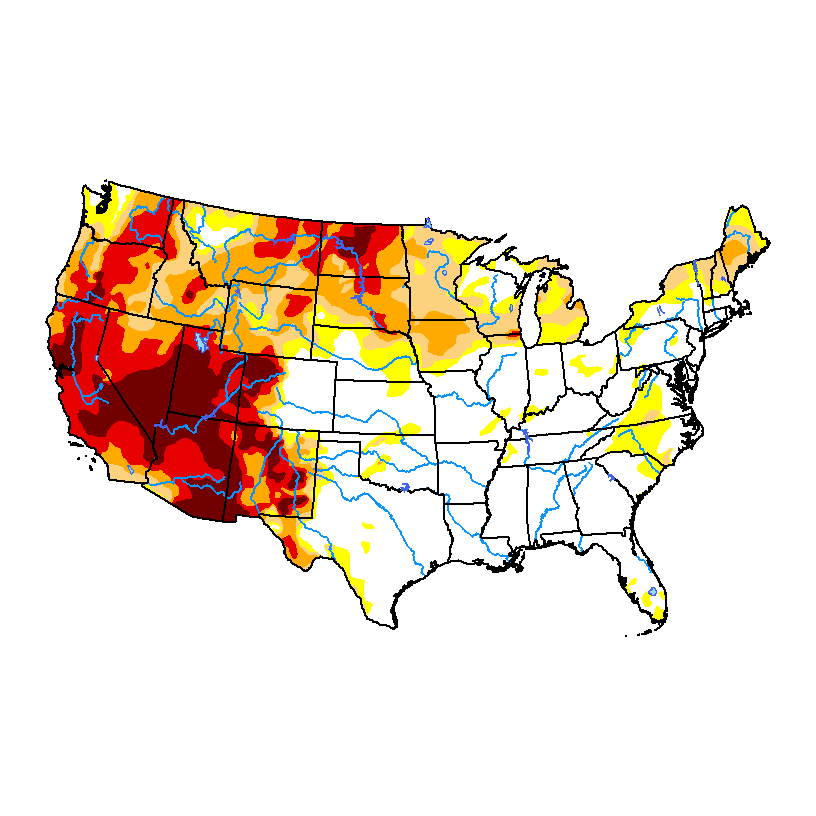
Drought Monitor....long term drought.
Top map was updated July 1st. 2nd map was the previous week/map.
https://droughtmonitor.unl.edu/Maps/CompareTwoWeeks.aspx

You can go to this link to see precipitation totals from recent time periods:
https://water.weather.gov/precip/
Go to precipitation, then scroll down to pick a time frame. Hit states to get the borders to see locations better. Under products, you can hit "observed" or "Percent of normal"
Rainfall the last 7 days ending Sunday AM.

Rainfall % of average the last 7 days ending Sunday AM.
Good site with tons of data:
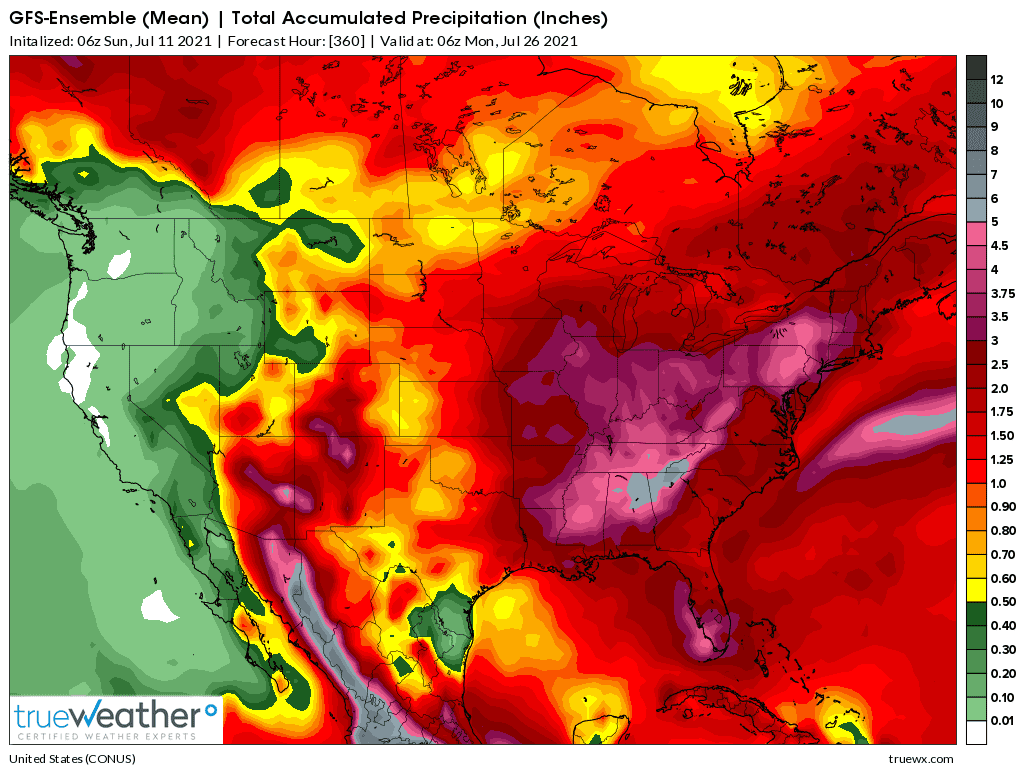
Last run of the 0z GFS ensemble 500 mb mean at 360 hours:
Robust positive anomaly for the northern 1/3 of the US.
Individual ensemble solutions below:
850 mb map at 360 hours below...........heat continues in the Northwest and spreads east along the Canadian border and vicinity.
Canadian ensemble mean from 0z(updated around midnight), along with individual solutions below that:
360h GZ 500 forecast valid on Jul 12, 2021 00UTC


Forecasts for global GEM, control (GEM 0) and the 20 ensemble members
MetMike
Thank you for the new thread.
I am NOT weather savvy and depend upon your lead when it comes to forecasts. NOAA helps, but I have not liked Its changes and find it hard to find the "old" quick look sites easily.
BASED upon my crude observation of the 'total rainfall over the 3-4 day storm period', I have gone long(er) oats, rice, bean oil and Mn wheat. Each of these commodities has severe weather related issues in the growing regions of the Dakotas, northern tier Iowa, and Minnesota, in that, if I am correct from NOAA and posted comments in the Ag forum on actual rainfall, they received little rainfall. In other words, areas without moisture received none/little; areas with abundant moisture (MO and W Ill) received 6-10 inches and are now facing total saturation with ponding and at least N loss. Areas with so so moisture got a drink (Ohio), but the crop needs are on the increase and evaporative rates are likely to substantially increase after Thursday this week.
From a technical/chart perspective, Corn appears to have made a daily low on Friday, meal a daily/weekly low on Friday, beans a double bottom, wheat a daily/weekly bottom, oats a test of low after making a d/w bottom, and rice made a breakout from a d/w bottom without a daily sell signal (never closed near its recent high). Low RSI and over sold conditions prevail in these commodities. (SO, cycle lows with low RSI after huge retracements)
Again, my perception is that the western heat waive will torch all crops at least west of Wisconsin above Iowa, INCLUDING the Canadian provinces, areas already perilously near crop disasters. IF, IF (MetMike correct me or amplify current data) the heat and ridge moves east, prices must build in risk.
MetMike clearly identified the changing weather pattern and cautioned the likelihood of a major grain setback (mostly ignored by the AG community) at least two weeks ago. IMHO that retracement has run its course. A 2-3 week, risk on, rally may now be commencing.
It will take considerable FEAR to take out the lead month highs, but again, IMHO, a major northerly retrace is underway. Deliveries will be few until weather is "known", but old crop may initially lead the rally.
MY TWO CENTS
Thanks tjc,
I agree with everything that you stated.
The N/C Plains and Upper Midwest forecast is pretty bullish. The rest of the cornbelt is pretty bearish.
The MWE crop is already severely damaged and will be one of the worst ever. Seasonals for wheat go up here(with the HRW crop harvest getting pretty far along)..........but are negative for corn/beans.
Previous thread on wheat.
Thanks Larry.
I’m having a colonoscopy this morning and will be out for awhile.
Week 2 and beyond look pretty bullish....actually before then and for the foreseeable future for the n.plains and upper Midwest wcb.
Weather looks extremely bullish for much of the cornbelt.
The southern and eastern cornbelt has very bearish weather coming up.
Been in the hospital for much of the last 2 days.
The forecast has not changed that much.
Very bullish for the N/C Plains. Upper Midwest, Western Cornbelt.
Very bearish else where..........Eastern Cornbelt, Southern Midwest and possibly the Central Cornbelt.
The cutoff between extremely bullish and extremely bearish weather, has creeped a bit farther northwest will slightly more in the bearish territory.
The cutoff is probably around Des Moines IA. North and West =Bullish. South and east =Bearish.
The weather forecast continues to be almost the same. This weeks rains are ending which have been pretty bearish the last 10 days for many places in the Cornbelt. Too much rain in some spots though.
The market will focus on the next weather pattern with its different weather systems that gets going early next week.
It's the tale of 2 different weather stories.
Very bullish for the northwestern 1/3 of the belt(N/C Plains-Upper Midwest/Western Cornbelt)
Very bearish for the southeastern 1/3 of the belt(southern Midwest/Eastern Cornbelt) a
In between........much of the Central Cornbelt could go either way.
These are the rains over the last 7 days. Numerous counties in MO got over 10 inches of rain which did some damage.
Many dozens of counties got over 6 inches, some over 8 inches. Those higher amounts likely hurt the crops more than helped them but all those places should not need another rain for over 2 weeks now.
The 2nd map shows how astounding this rain event was. Over 6 times the average rain for the last 1 week period in a massive area of pink. WOW!
https://water.weather.gov/precip/


That is incredible!
It is incredible Jim!
Our producers are telling us those excessive rains did some damage!
https://www.marketforum.com/forum/topic/71851/
We predicted them well ahead of time here:
Excessive rains coming up
31 responses |
Started by metmike - June 23, 2021, 12:21 p.m.
Updated forecast for July from NWS:
Not good for the N/C Plains, Upper Midwest.
Good for the S.Midwest, Eastern Cornbelt.


I think NG might be forming a short term top here. I think if it wasn't for the hurricane in the Atlantic heading into the weekend, it would be down hard today.
Could be Jim!
Rains pushed south on Friday on precip map below... but scroll to the top to see they have returned to the Plains.
Weather turning much more bearish for the grains.
Weather is still bearish grains.
Could turn bullish in week 2 but not until a ton of rain falls in Iowa in week 1.
You can go to this link to see precipitation totals from recent time periods:
https://water.weather.gov/precip/
Go to precipitation, then scroll down to pick a time frame. Hit states to get the borders to see locations better. Under products, you can hit "observed" or "Percent of normal"
These are the rains the last 7 days.
Not much in many areas but huge rains are on the way for the southern and eastern Cornbelt..........then the weather could turn pretty bullish, especially for the very dry northwest Corn/U.pper Midwest, N/C Plains.
Interesting that there could be some excessive rains again, like we had a couple of weeks ago for areas in the grey shade, which is 5+ of rain. Most of it in week 1. There's a sharp cutoff in the rains that go to almost nothing when you get to the N. Plains.
Scroll up for the latest weather maps. Though I'm still in Detroit with my almost 96 year old Dad this week, the weather maps all get updated constantly.
Lots of rain the last 7 days. The crop will maintain or improve on Monday's crop condition report in those locations. May drop a bit outside of that.
You can go to this link to see precipitation totals from recent time periods:
https://water.weather.gov/precip/
Go to precipitation, then scroll down to pick a time frame. Hit states to get the borders to see locations better. Under products, you can hit "observed" or "Percent of normal"

Rain totals the next 2 weeks below. Dry in the Northwest Cornbelt/Plains.........wet to the southeast of there.
The cut off is around Des Moines IA.(though, hopefully there will be some rain this upcoming week just northwest of there)
Scroll up for the constantly updated weather maps.
We got some real nice rains here in NE Ohio. Corn looks great.
Week 2 weather turns pretty bullish, however, these are week 1 rains:
7 Day Total precipitation below:
http://www.wpc.ncep.noaa.govcdx /qpf/p168i.gif?1530796126
Thanks Jim!
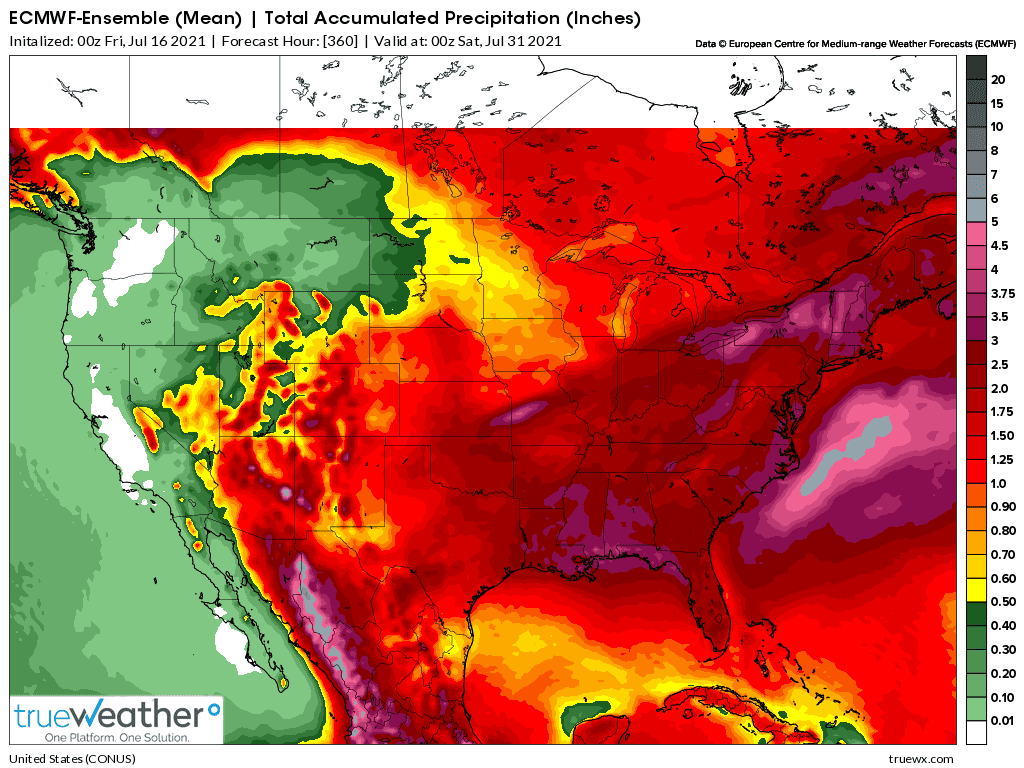
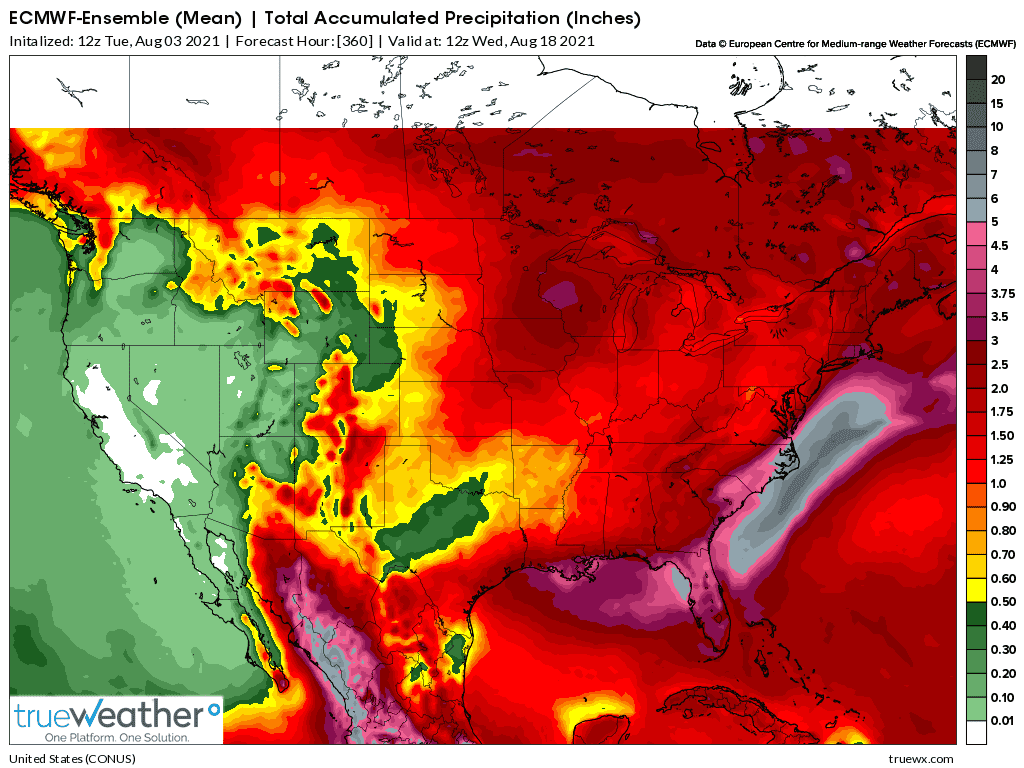
Total 2 week rains from the last European model.
Not much!
I bot a bean put (too 'scary' to sell call). Seems we have come 'very' far on 14 day forecasts
Will it be bullish/bearish weather forecast sunday night?
If soil conditions are any where close to our area, that narrow band from central Ill, [perhaps a bit south of C ILL] keeps on getting inches of rain. It is to the point of being way too wet. N loss is visible, soil will not allow a sprayer to operate [fungicide or any thing else needing spray] Low spots flooded and big crop acres is dead from flooding
In corn the crop is too tall to see the damage but bean fields tell the story. Same flooding in both bean and corn fields
When combines roll then operators will see the corn crop damage
Mind you it is a narrow band but Ill has some really good soil with too much rain
Assuming all places in that band are like our small part of the world, That band keeps on getting 2-3" rains, or at least we do
Only good thing is our farms have tile and mostly sandy loam, but there is a limit. Any farm with less than good tile patterns is mostly dead from flooding
Our basement sump pump works constantly pumping soil water from around the house tile, which tells me how soggy the soil is way down deep, below basement floor. At least the sump and tile keep our basement dry. The high water alarm went off in the sump which means the pump is working really hard, as I type this. Still raining and the system over us is huuuge.
Sweet corn harvest starts in a week to 10 days. We are gearing up with duals and 4 wheel drive. Going to be some big ruts where the crop did not die from flooding
Sprayer can't move in soggy soil, even with part loads. The rain might wash the bugs, worms, larvae away. We shall see.
Thanks Wayne and tjc,
I have no idea what direction that the grains are going from one minute to the next or one day to the next day.
Conditions continue too dry northwest and previously too wet south and east but dry there now. Some dry locations in the Upper Midwest have a bit better chance for rain today vs yesterday.
COVID picking up again because ignorant people refuse to be vaccinated is also a factor here.
7 Day Total precipitation below:
http://www.wpc.ncep.noaa.govcdx /qpf/p168i.gif?1530796126
I80 at Il.71 area
Have had "sufficient to too much rain" over the past two weeks. 6-10 days of 'nice' (85ish days with upper 60s night) will be very welcomed. Crops look very nice with some drown outs, but overall a very good crop so far. Golf course was pretty soggy Friday evening, but with its good drainage it will bounce back quickly.
First sweet corn stand opened Sunday afternoon. $5 for a dozen!
all things considered corn did not have an awful day like many markets. Maybe the new forecast today with hotter and drier than previous helped the corn not sell off
The forecast is mostly dry and bullish but there could be some surprise ridge riders (around the periphery of the heat ridge) that bring rain to dry spots in the Upper Midwest.
The dry weather in the southern Midwest is beneficial.
7 Day Total precipitation below:
http://www.wpc.ncep.noaa.govcdx /qpf/p168i.gif?1530796126
Potential ridge riders
Still potential ridge riders and much of the Cornbelt benefiting right now from the drier weather.
Could turn bullish at some point.
Eric Snodgrass 7-22=21
Smoke and Aug weather
Ag Weather Forecast with Eric Snodgrass (extended) | Nutrien Ag Solutions | July 22, 2021 - YouTube
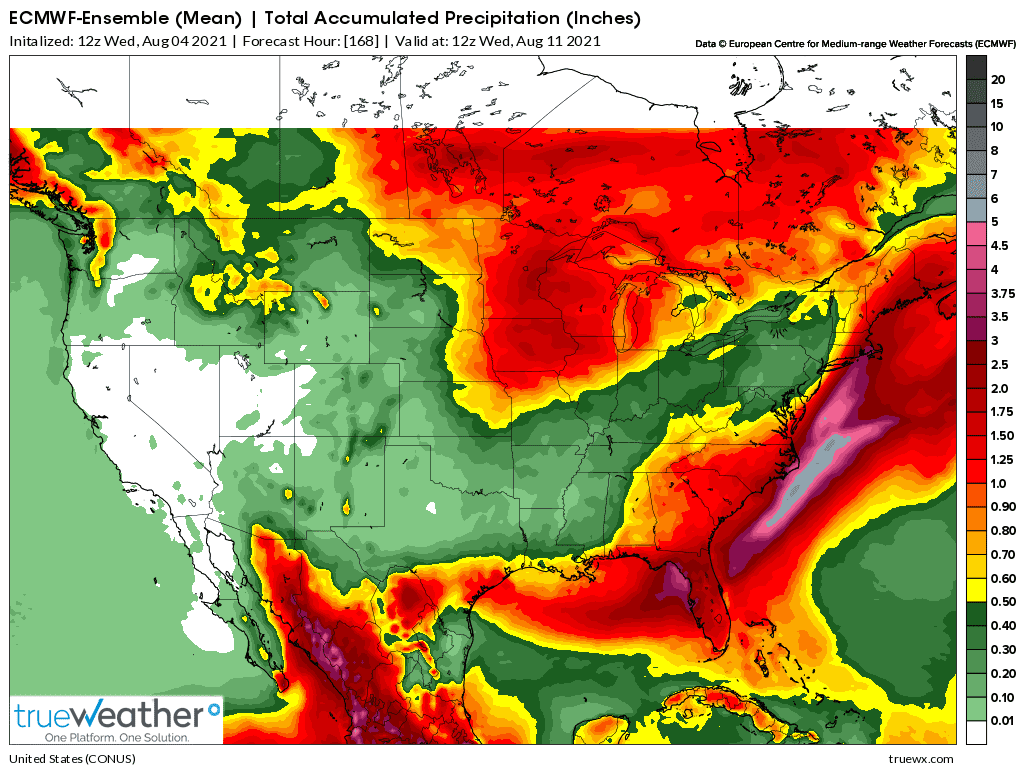
European model rains the next week:
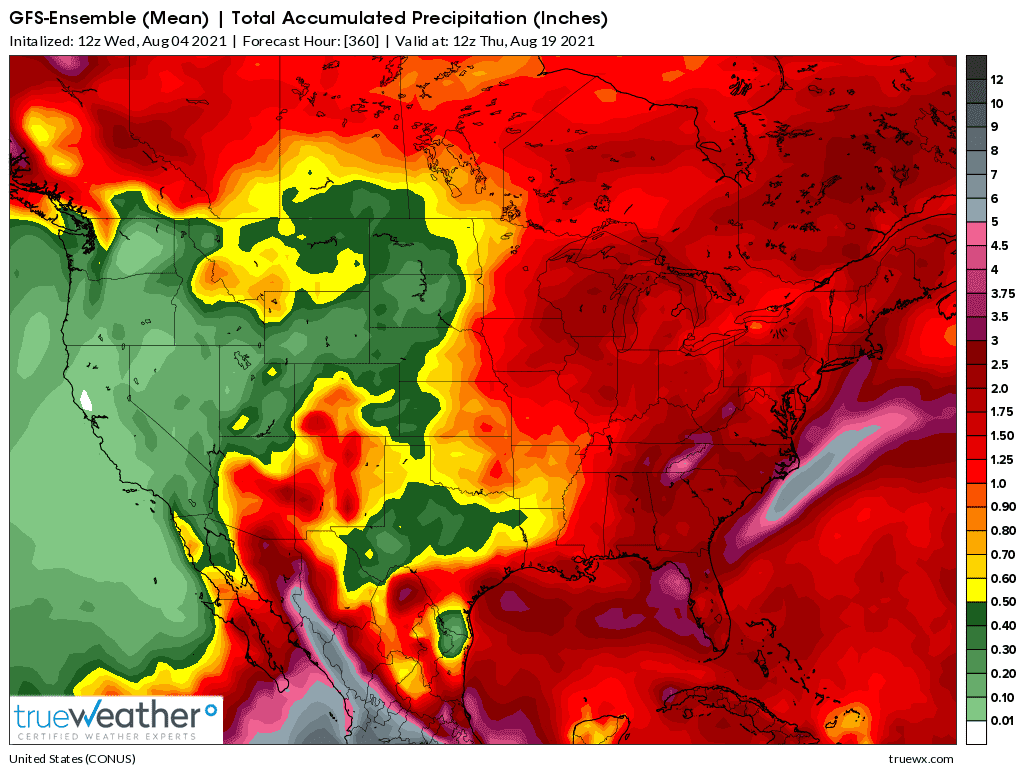
Rains the next 2 weeks:
NWS:
https://www.marketforum.com/forum/topic/71672/#71676
7 Day Total precipitation below:
http://www.wpc.ncep.noaa.govcdx /qpf/p168i.gif?1530796126
European model continues MUCH WETTER in driest locations. It doesn't come out until the grain market is closed.
GFS for week 1 below.
++++++++++++++++++++++++++++++++++++++++++++
Just out European model below....heavier amounts Upper Midwest
+++++++++++++++++++++++++++++++++++++
12z GFS 2 week totals below. It's wetter in the Eastern Cornbelt, drier elsewhere.
++++++++++++++++++++++++++++++++++++++
Just out wetter European model for 2 weeks below
About time to start a new weather page!
New Tropical Storm Nicholas
6 responses
Started by metmike - Sept. 13, 2021, 11:17 a.m.


