September 1st, 2021 by Roy W. Spencer, Ph. D.
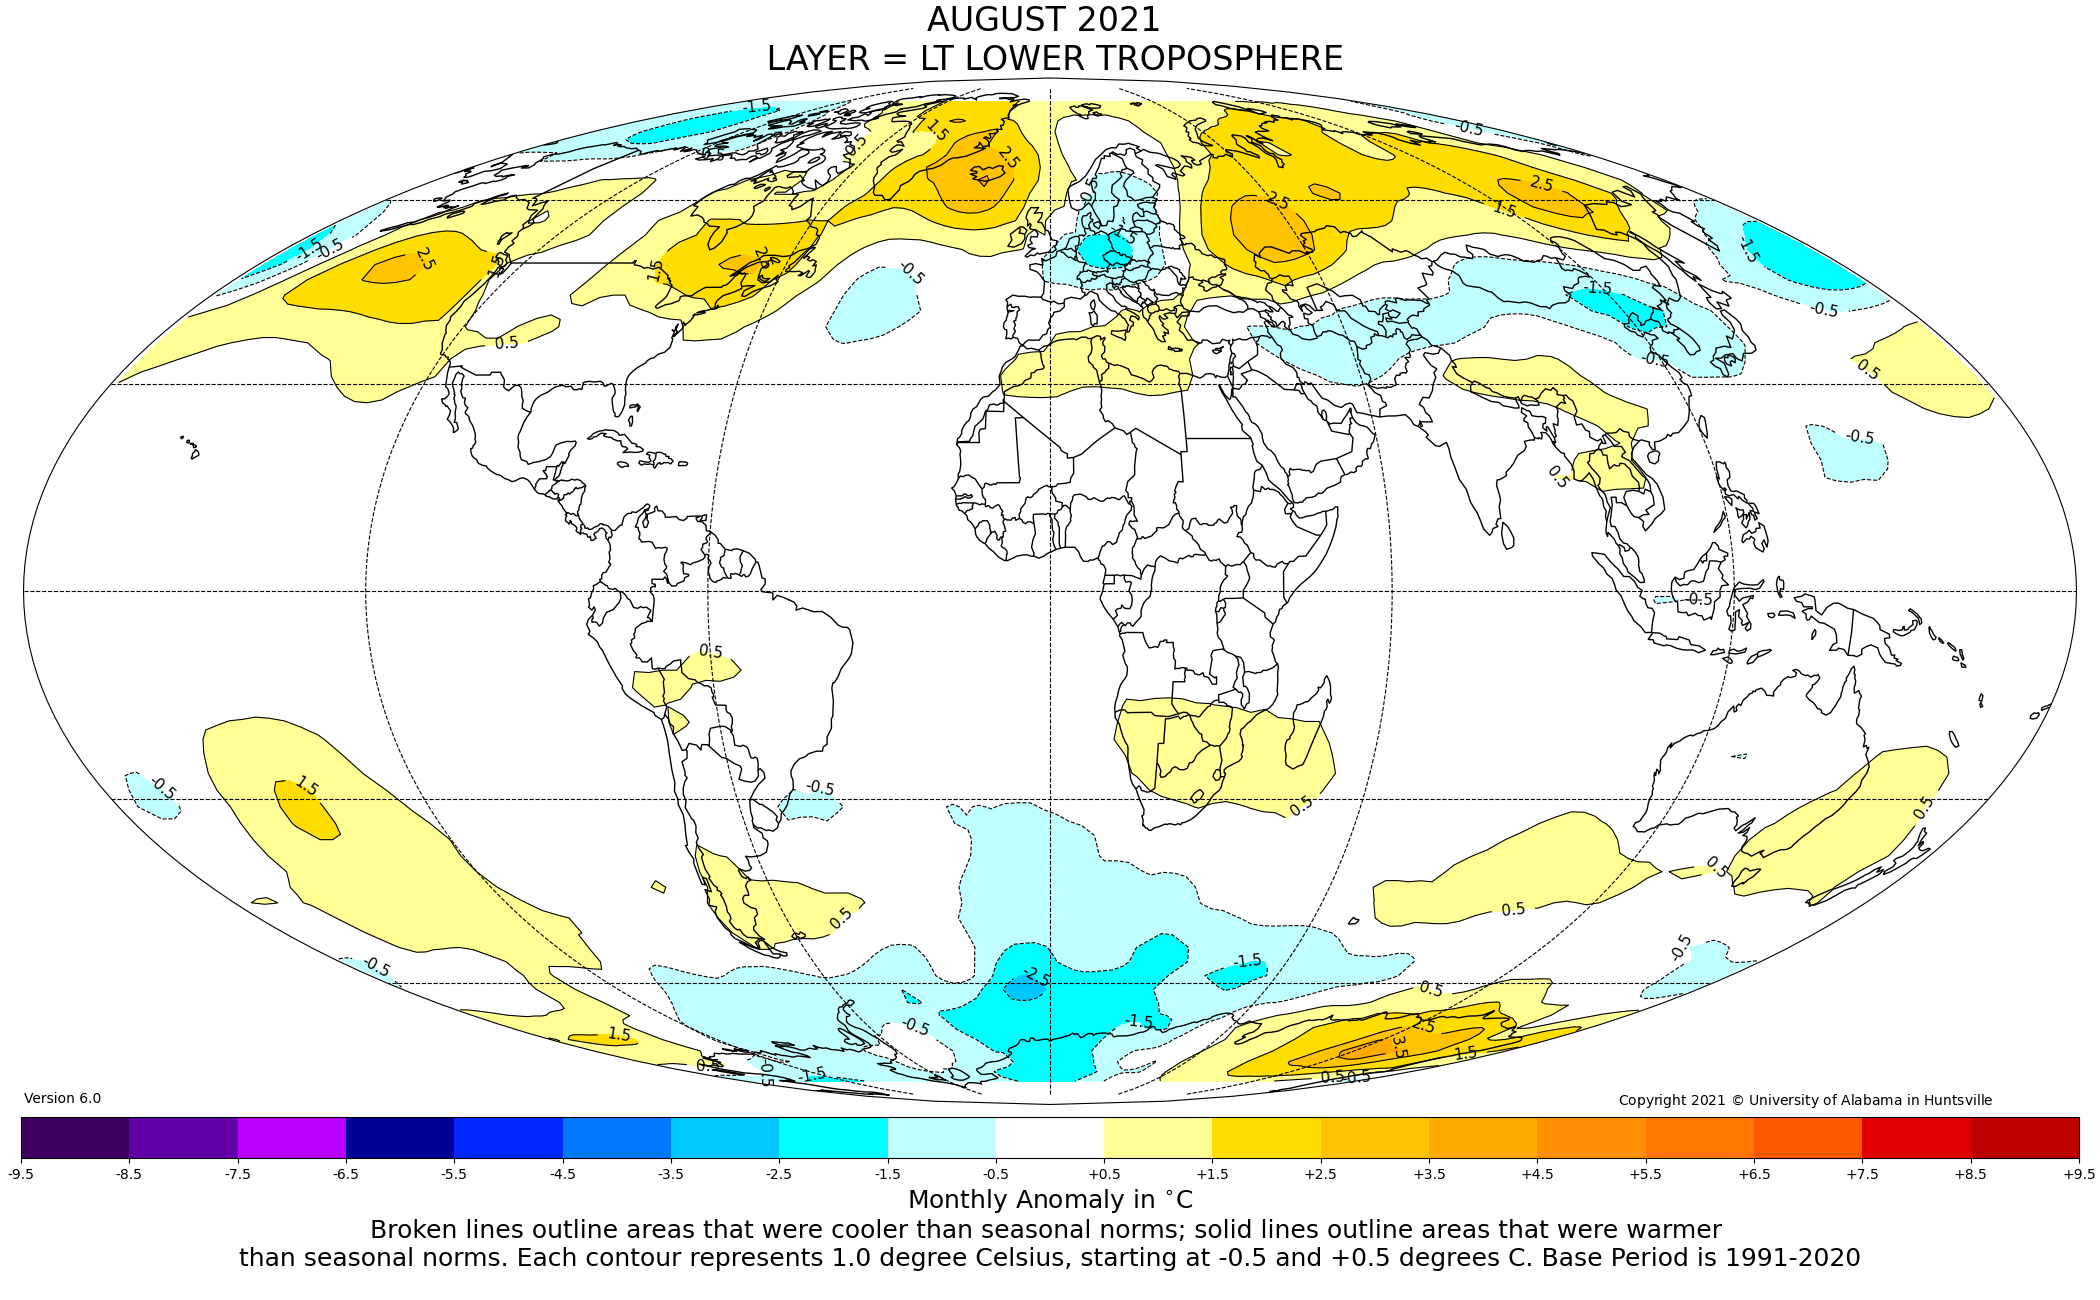
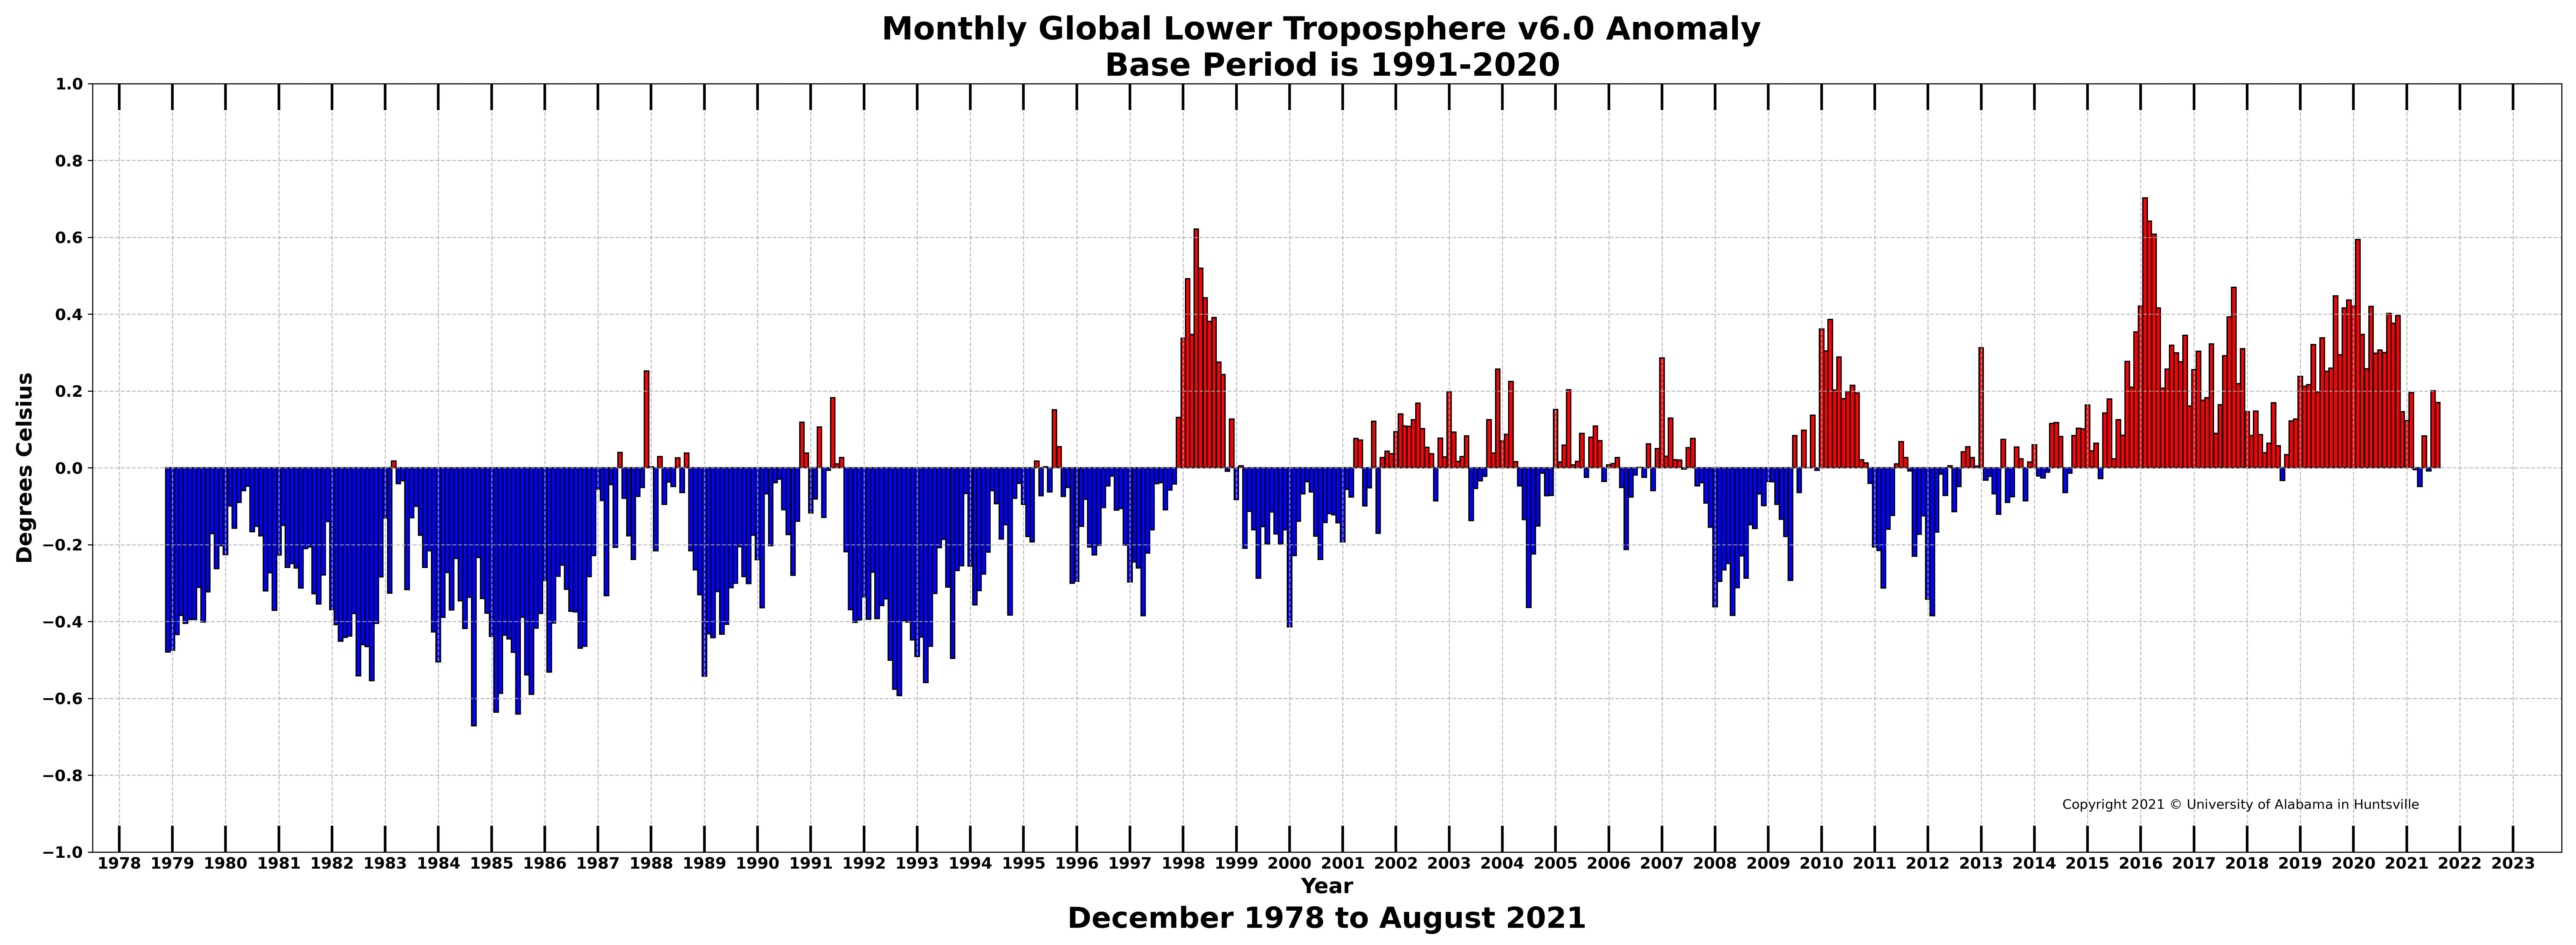
The Version 6.0 global average lower tropospheric temperature (LT) anomaly for August, 2021 was +0.17 deg. C, down slightly from the July, 2021 value of +0.20 deg. C.
http://www.drroyspencer.com/2021/09/uah-global-temperature-update-for-august-20210-17-deg-c/

The linear warming trend since January, 1979 has now dropped slightly, at +0.13 C/decade (+0.12 C/decade over the global-averaged oceans, and +0.18 C/decade over global-averaged land).
https://wattsupwiththat.com/2021/09/01/the-new-pause-lengthens-yet-again/
The trend on the entire UAH dataset since December 1978, a period of 42 years 9 months, is equivalent to only 1.35 C°/century, even though the data began shortly after the naturally-occurring Great Pacific Shift of 1976 that is responsible for much of the warming over most of the period.
Furthermore, over the 18 years 1984-2001 a naturally-occurring reduction in cloud cover was responsible for most of the period radiative forcing (Pinker et al. 2005) and hence global warming.

The New Pause has again lengthened by another two months. On the normative UAH lower-troposphere dataset there has been no global warming over the 6 years 8 months from January 2015 to August 2021. As always, the Pause is calculated as the longest period ending in the present that shows no warming trend, taken as the least-squares linear-regression trend on the UAH satellite monthly global mean surface temperature anomalies for the lower troposphere:

For the Medieval Warm Period compared to today below:
Red balloons showed it was warmer.
Blue was colder than today(in that study)
Green was wetter/more precip
Yellow was drier
https://wattsupwiththat.com/2017/01/03/documenting-the-global-extent-of-the-medieval-warm-period/
If you go to the link below, you can hit those individual balloons and get each individual study:
https://www.marketforum.com/forum/topic/27525/#27705
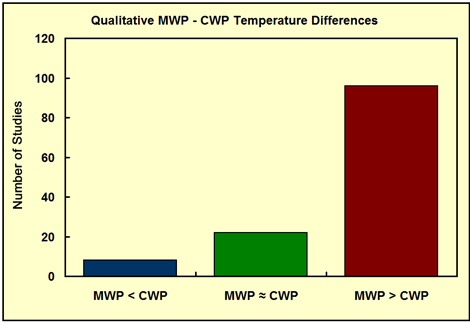
Here are most of the studies(hundreds on the map below), most of which, by a wide margin, show that the Medieval Warm Period was this warm or warmer than this. Most of them done before climate science was hijacked(I'll show you the actually hijack below):
Over 100 studies from the Medieval Warm Period, most of which show the planet was this warm or warmer 1,000 years ago. It was also this warm 2,000 years ago during the Roman Warm Period and also just over 3,000 years ago, during the Minoan Warm period.
Medieval Warm Period Project:
http://www.co2science.org/data/mwp/mwpp.php
| MWP-CWP Qualitative Temperature Differentials - CO2 Science Figure Description: The distribution of Level 2 Studies that allow one to determine whether peak Medieval Warm Period temperatures were warmer than (red), equivalent ... |

Where did the data from the bar graphs above come from so that we know that this is the authentic science vs the one that the MSM and dems describe with the fake climate crisis(where they can't show the data to prove)?
List of Scientists Whose Work We Cite:
http://www.co2science.org/data/mwp/scientists.php
List of Research Institutions Associated With the Work We Cite
http://www.co2science.org/data/mwp/institutions.php
Earth System science Center
THe University of Alabama in Huntsville
https://www.nsstc.uah.edu/climate/

