KEY EVENTS TO WATCH FOR:
Thursday, September 30, 2021
8:30 AM ET. August CFNAI Chicago Fed National Activity Index
NAI (previous 0.53)
NAI, 3-mo Moving Avg (previous 0.23)
8:30 AM ET. 2nd Quarter State Quarterly Personal Income
8:30 AM ET. Unemployment Insurance Weekly Claims Report - Initial Claims
Jobless Claims (expected 320K; previous 332K)
Jobless Claims, Net Chg (previous +20K)
Continuing Claims (previous 2665000)
Continuing Claims, Net Chg (previous -187K)
8:30 AM ET. U.S. Weekly Export Sales
Corn (Metric Tons) (previous 248.9K)
Soybeans (Metric Tons) (previous 1266.2K)
Wheat (Metric Tons) (previous 617.1K)
9:45 AM ET. Bloomberg Consumer Comfort Index
9:45 AM ET. September US Flash Manufacturing PMI
PMI, Mfg (expected 61.7; previous 61.2)
9:45 AM ET. September US Flash Services PMI
PMI, Services (expected 54.9; previous 55.2)
10:00 AM ET. August Leading Indicators
Leading Index, M/M% (expected +0.7%; previous +0.9%)
Leading Index (previous 116.0)
Coincident Index, M/M% (previous +0.6%)
Lagging Index, M/M% (previous +0.6%)
10:30 AM ET. EIA Weekly Natural Gas Storage Report
Working Gas In Storage (Cbf) (expected 3079B; previous 3006B)
Working Gas In Storage, Net Chg (Cbf) (expected +73B; previous +83B)
11:00 AM ET. Sept. Federal Reserve Bank of Kansas City Survey of Tenth District Manufacturing
Mfg Activity Idx (previous 22)
6-Mo Exp Prod Idx (previous 46)
Mfg Composite Idx (expected 30; previous 29)
6-Mo Exp Composite Idx (previous 36)
2:00 PM ET. SEC Closed Meeting
4:30 PM ET. Federal Discount Window Borrowings
4:30 PM ET. Foreign Central Bank Holdings
Friday, October 1, 2021
8:30 AM ET. August Personal Income & Outlays
Personal Income, M/M% (previous +1.1%)
Consumer Spending, M/M% (previous +0.3%)
PCE Price Idx, M/M% (previous +0.4%)
PCE Price Idx, Y/Y% (previous +4.2%)
PCE Core Price Idx, M/M% (previous +0.3%)
PCE Core Price Idx, Y/Y% (previous +3.6%)
9:45 AM ET. September US Manufacturing PMI
PMI, Mfg (previous 61.1)
10:00 AM ET. September ISM Report On Business Manufacturing PMI
Manufacturing PMI (previous 59.9)
Prices Idx (previous 79.4)
Employment Idx (previous 49.0)
Inventories (previous 54.2)
New Orders Idx (previous 66.7)
Production Idx (previous 60.0)
10:00 AM ET. 2nd Quarter GDP by State
10:00 AM ET. August Construction Spending - Construction Put in Place
New Construction (previous +0.3%)
Residential Construction
10:00 AM ET. September University of Michigan Survey of Consumers – final
End-Mo Sentiment Idx (previous 70.3)
End-Mo Expectations Idx (previous 65.1)
12-Month Inflation Forecast (previous 4.6%)
5-Year Inflation Forecast (previous 2.9%)
End-Mo Current Idx (previous 78.5)
11:00 AM ET. September Global Manufacturing PMI
PMI, Mfg (previous 54.1)
4:00 PM ET. September Domestic Auto Industry Sales
N/A U.S. fiscal year begins
Monday, October 4, 2021
10:00 AM ET. August-September Manufacturers' Shipments, Inventories & Orders (M3)
Total Orders, M/M% (previous +0.4%)
Orders, Ex-Defense, M/M% (previous -0.1%)
Orders, Ex-Transport, M/M% (previous +0.8%)
Durable Goods, M/M%
Durable Goods, M/M%
Tuesday, October 5, 2021
7:45 AM ET. Weekly Chain Store Sales Index
8:30 AM ET. August U.S. International Trade in Goods & Services
Trade Balance (USD) (previous -70.05B)
Exports (USD) (previous 212.83B)
Exports, M/M%
Imports (USD) (previous 282.88B)
Imports, M/M%
8:55 AM ET. Johnson Redbook Retail Sales Index
Ret Sales Mo-to-Date, M/M%
Ret Sales Mo-to-Date, Y/Y%
Latest Wk, Y/Y%
9:45 AM ET. September US Services PMI
PMI, Services (previous 55.1)
10:00 AM ET. September ISM Report On Business Services PMI
Non-Mfg Composite Idx (previous 61.7)
Non-Mfg Business Idx (previous 60.1)
Prices Idx (previous 75.4)
Employment Idx (previous 53.7)
New Orders Idx (previous 63.2)
10:00 AM ET. October IBD/TIPP Economic Optimism Index
Economic Optimism Idx (previous 48.5)
6-Mo Economic Outlook (previous 41.3)
11:00 AM ET. September Global Services PMI
PMI, Services (previous 52.9)
4:30 PM ET. API Weekly Statistical Bulletin
Crude Stocks, Net Chg (Bbls)
Gasoline Stocks, Net Chg (Bbls)
Distillate Stocks, Net Chg (Bbls)
Wednesday, October 6, 2021
7:00 AM ET. MBA Weekly Mortgage Applications Survey
Composite Idx
Composite Idx, W/W%
Purchase Idx-SA
Purchase Idx-SA, W/W%
Refinance Idx
Refinance Idx, W/W%
8:15 AM ET. September ADP National Employment Report
Private Sector Jobs, Net Chg (previous +374000)
9:00 AM ET. IMF World Economic Outlook analytical chapter 2 published
10:30 AM ET. EIA Weekly Petroleum Status Report
Crude Oil Stocks (Bbl)
Crude Oil Stocks, Net Chg (Bbl)
Gasoline Stocks (Bbl)
Gasoline Stocks, Net Chg (Bbl)
Distillate Stocks (Bbl)
Distillate Stocks, Net Chg (Bbl)
Refinery Usage
Total Prod Supplied (Bbl/day)
Total Prod Supplied, (Bbl/day) Net Chg
11:00 AM ET. IMF World Economic Outlook analytical chapter 3 published
The STOCK INDEXES? http://quotes.ino.com/ex?changes/?c=indexes
The STOCK INDEXES: The December NASDAQ 100 was higher overnight as it consolidates some of the sharp decline off Monday's high. Overnight strength sets the stage for a steady to higher opening when the day session begins trading. Stochastics and the RSI are oversold but remains neutral to bearish signaling that sideways to lower prices are possible near-term. If December extends the decline off September's high, July's low crossing at 14,437.00 is the next downside target. Closes above the 20-day moving average crossing at 15,297.67 would signal that a short-term low has been posted. First resistance is the 20-day moving average crossing at 15,297.67. Second resistance is the September 7th high crossing at 15,702.25. First support is August's low crossing at 14,699.00. Second support is July's low crossing at 14,437.00.
The December S&P 500 was higher overnight as it consolidates some of the decline off Monday's high. Overnight strength sets the stage for a steady to higher opening when the day session begins trading later this morning. Stochastics and the RSI are neutral to bearish signaling that sideways to lower prices are possible near-term. If December resumes this month's decline, July's low crossing at 4214.50 is the next downside target. Closes above Monday's high crossing at 4472.00 would signal that a short-term low has been posted. First resistance is Monday's high crossing at 4472.00. Second resistance is the September 3rd high crossing at 4549.50. First support is September's low crossing at 4293.75. Second support is July's low crossing at 4214.50. Third support is June's low crossing at 4117.00.
INTEREST RATES http://quotes.ino.com/ex changes/?c=interest"
INTEREST RATES: December T-bonds were higher overnight as it consolidates some of the decline off last-Wednesday's high. Overnight strength sets the stage for a steady to higher opening when the day session begins trading. Stochastics and the RSI are oversold but remain neutral to bearish signaling that sideways to lower prices are possible near-term. If December extends the aforementioned decline, the 62% retracement level of the March-August rally crossing at 157-13 is the next downside target. Closes above the 20-day moving average crossing at 162-11 would signal that a short-term low has been posted. First resistance is the 10-day moving average crossing at 161-17. Second resistance is the 20-day moving average crossing at 162-11. First support is the 50% retracement level of the March-August rally crossing at 158-30. Second support is the 62% retracement level of the March-August rally crossing at 157-13.
December T-notes were higher due to short covering overnight as is consolidates some of the decline off last-Wednesday's high. Overnight strength sets the stage for a steady to higher opening with the day session begins trading. Stochastics and the RSI are oversold but remain neutral to bearish signaling that sideways to lower prices are possible near-term. If December extends last-week's decline, the 87% retracement level of the March-August rally crossing at 130.207 is the next downside target. Closes above the 20-day moving average crossing at 132.258 would temper the near-term bearish outlook. First resistance is the 10-day moving average crossing at 132.094. Second resistance is the 20-day moving average crossing at 132.258. First support is the 75% retracement level of the March-August rally crossing at 131.072. Second support is the 87% retracement level of the March-August rally crossing at 130.207.
ENERGY MARKETS? http://quotes.ino.com/ex?changes/?c=energy ""
ENERGIES:November crude oil was steady to slightly lower overnight. Overnight weakness sets the stage for a steady to slightly lower opening when the day session begins trading. Stochastics and the RSI are overbought and are turning neutral to bearish signaling that a short-term top might be in or is near. If November extends the rally off August's low, long-term resistance on the monthly continuation chart crossing at $76.90 is the next upside target. Closes below the 20-day moving average crossing at $71.54 would signal that a short-term top has been posted while opening the door for additional weakness near-term. First resistance is Tuesday's high crossing at $76.67. Second resistance is long-term resistance on the monthly continuation chart crossing at $76.90. First support is the 20-day moving average crossing at $71.54. Second support is the 50-day moving average crossing at $69.48.
November heating oil was slightly higher overnight as it posted a new high for the year. The mid-range overnight trade sets the stage for a steady to higher opening when the day session begins trading. Stochastics and the RSI are overbought but remain neutral to bullish signaling that sideways to higher prices are possible near-term. If November extends the rally off August's low, the 50% retracement level of the 2008-2020-decline on the monthly continuation chart crossing at $2.3697 is the next upside target. Closes below the 20-day moving average crossing at $2.2004 would signal that a short-term top has been posted. First resistance is the overnight high crossing at $2.3341. Second resistance is the 50% retracement level of the 2008-2020-decline on the monthly continuation chart crossing at $2.3697. First support is the 10-day moving average crossing at $2.2458. Second support is the 20-day moving average crossing at 2.2004.
November unleaded gas was steady to slightly higher overnight. Overnight strength sets the stage for a steady to higher opening when the day session begins trading. Stochastics and the RSI are neutral to bullish signaling that sideways to higher prices are possible near-term. If November extends the rally off August's low, the 62% retracement level of the 2008-2020-decline on the monthly continuation chart crossing at 236.96 is the next upside target. Closes below the 50-day moving average crossing at 2.0703 would signal that a short-term top has been posted while opening the door for additional weakness near-term. First resistance is Tuesday's high crossing at 2.1937. Second resistance is the July high on the monthly continuation chart crossing at 236.96. First support is the 50-day moving average crossing at 2.0703. Second support is September's low crossing at 2.0225.
November Henry natural gas was higher overnight as it consolidates some of Wednesday's decline. Overnight strength sets the stage for a steady to higher opening when the day session begins trading. Stochastics and the RSI are neutral to bearish signaling that sideways to lower prices are possible near-term. If November extends this year's rally, the 62% retracement level of the 2008-2020-decline crossing at 6.671 is the next upside target. Closes below the 20-day moving average crossing at 5.170 would signal that a short-term top has been posted. First resistance is Tuesday's high crossing at 6.318. Second resistance is the 62% retracement level of the 2008-2020-decline crossing at 6.671. First support is the September 21st low crossing at 4.766. Second support is the September 7th low crossing at 4.608.
CURRENCIEShttp://quotes.ino.com/ex changes/?c=currencies"
CURRENCIES:The December Dollar was higher overnight as it extends the rally off September's low. Stochastics and the RSI are overbought but remain neutral to bullish signaling that sideways to higher prices are possible near-term. If December extends the rally off September's low, the 38% retracement level of the 2020-2021-decline on the weekly continuation chart crossing at $94.82 is the next upside target. Closes below the 50-day moving average crossing at $92.81 would signal that a short-term top has been posted. First resistance is the overnight high crossing at $94.52. Second resistance is the 38% retracement level of the 2020-2021-decline on the weekly continuation chart crossing at $94.33. First support is the 10-day moving average crossing at $93.56. Second support is the 50-day moving average crossing at $92.81.
The December Euro was lower overnight as it extends this month's decline.The low-range overnight trade sets the stage for a steady to lower opening when the day session begins trading. Stochastics and the RSI are oversold but remain neutral to bearish signaling that sideways to lower prices are possible near-term. If December extends the decline off September's high, the 62% retracement level of the 2020-2021-rally crossing at $114.56 is the next downside target. Closes above the 50-day moving average crossing at $117.98 would signal that a short-term low has been posted. First resistance is the 10-day moving average crossing at $117.07. Second resistance is the 50-day moving average crossing at $117.98. First support is the overnight low crossing at $115.83. Second support is the 62% retracement level of the 2020-2021-rally crossing at $114.56.
The December British Pound was steady to slightly lower overnight as it extends this month's decline. Overnight weakness sets the stage for a steady to lower opening when the day session beings trading. Stochastics and the RSI are oversold but remain neutral to bearish signaling that sideways to lower prices are possible near-term. If December extends this month's decline, the 38% retracement level of the 2020-2021-rally crossing at 1.3223 is the next downside target. Closes above the 20-day moving average crossing at 1.3722 would signal that a short-term low has been posted.First resistance is the 20-day moving average crossing at 1.3722. Second resistance is the 50-day moving average crossing at 1.3777. First support is Wednesday's low crossing at 1.3412. Second support is the 38% retracement level of the 2020-2021-rally crossing at 1.3223.
The December Swiss Franc was lower overnight as it extends the decline off August's high. Overnight weakness sets the stage for a steady to lower opening when the day session begins trading. Stochastics and the RSI are oversold but remain neutral to bearish signaling that sideways to lower prices possible near-term. If December extends the aforementioned decline, March's low crossing at 1.0654 is the next downside target. Closes above the 20-day moving average crossing at 1.0847 would signal that a short-term low has been posted. First resistance is the 20-day moving average crossing at 1.0847. Second resistance is the 50-day moving average crossing at 1.0922. First support is the overnight low crossing at 1.0693. Second support is March's low crossing at 1.0654.
The December Canadian Dollar was steady to slightly higher overnight as it consolidates some of the decline off Tuesday's high. Overnight strength sets the stage for a steady to higher opening when the day session begins trading. Stochastics and the RSI have turned neutral to bearish signaling that sideways to lower prices are possible near-term. If December extends the decline off Tuesday's high, September's low crossing at $77.54 is the next downside target. Closes above the 50-day moving average crossing at $79.22 would signal that a short-term low has been posted. First resistance is the 50-day moving average crossing at $79.22. Second resistance is September's high crossing at 80.09. First support is September's low crossing at $77.54. Second support is August's low crossing at $77.24.
The December Japanese Yen was lower overnight as it extends the decline off September's high. Overnight weakness sets the stage for a steady to lower opening when the day session begins trading. Stochastics and the RSI are oversold but remain neutral to bearish signaling that sideways to lower prices are possible near-term. If December extends the aforementioned decline, the February-2020 low on the weekly continuation chart crossing at 0.089205 is the next downside target. Closes above the 50-day moving average crossing at 0.091010 would signal that a short-term low has been posted. First resistance is the 10-day moving average crossing at 0.090471. Second resistance is the 50-day moving average crossing at 0.091010. First support is the overnight low crossing at 0.089275. Second support is the February-2020 low on the weekly continuation chart crossing at 0.089205.
PRECIOUS METALS http://quotes.ino.com/ex changes/?c=metals"
PRECIOUS METALS:Decembergold was steady to slightly higher overnight as it consolidates some of the decline off September's high. Overnight strength sets the stage for a steady to higher opening when the day session begins trading. Stochastics and the RSI are oversold but remain neutral to bearish signaling that sideways to lower prices are possible near-term. If December extends the decline off September's high, August's low crossing at $1677.90 is the next downside target. Closes above the 50-day moving average crossing at $1786.60 would signal that a short-term low has been posted. First resistance is the 10-day moving average crossing at $1750.90. Second resistance is the 20-day moving average crossing at $1774.60. First support is Wednesday's low crossing at $1721.10. Second support is August's low crossing at $1677.90.
December silver was steady to slightly higher overnight as it consolidates some of Wednesday's sharp decline. Overnight strength sets the stage for a steady to higher opening when the day session begins trading later this morning. Stochastics and the RSI are oversold but remain neutral to bearish signaling that sideways to lower prices are possible near-term. If December extends this month's decline, the 50% retracement level of the 2020-2021-rally crossing at $21.120 is the next downside target. Closes above last-Wednesday's high crossing at $23.150 would signal that a short-term low has been posted. First resistance is the 20-day moving average crossing at $23.140. Second resistance is the 50-day moving average crossing at $23.852. First support is Wednesday's low crossing at $21.410. Second support is the 50% retracement level of the 2020-2021-rally crossing at $21.120.
December copper was lower overnight as it extends the decline off Monday's high. The low-range overnight trade sets the stage for a steady to lower opening when the day session begins trading. Stochastics and the RSI are neutral to bearish signaling that sideways to lower prices are possible near-term. If December extends this week's decline, September's low crossing at 4.0160 is the next downside target. Closes above the 50-day moving average crossing at 4.3052 would signal that a short-term low has been posted. First resistance is the 50-day moving average crossing at 4.3052. Second resistance is September's high crossing at 4.4715. First support is September's low crossing at 4.0160. Second support is August's low crossing at 3.9615.
GRAINS http://quotes.ino.com/ex changes/?c=grains
December corn was higher overnight as it extends the rally off September's low.The high-range trade overnight sets the stage for a steady to higher opening when the day sessions begins trading. Stochastics and the RSI are overbought but remain neutral to bullish signaling that sideways to higher prices are possible near-term. Closes above the 50-day moving average crossing at $5.40 3/4 would open the door for a possible test of the August 30th high crossing at $5.58. Closes below the 20-day moving average crossing at $5.24 1/2 would temper the near-term friendly outlook. First resistance is the 50-day moving average crossing at $5.40 3/4. Second resistance is the August 30th high crossing at $5.58. First support is the September 21st low crossing at $5.12 3/4. Second support is September's low crossing at $4.97 1/2.
December wheat was higher overnight as it consolidated some of Tuesday's decline. Overnight strength sets the stage for a steady to higher opening when the day session begins trading. Stochastics and the RSI have turned neutral to bearish signaling that sideways to lower prices are possible near-term. Multiple closes below the 20-day moving average crossing at $7.08 1/4 would temper the near-term friendly outlook. If December renews the rally off September's low, September's high crossing at $7.33 1/4 is the next upside target. First resistance is the September 7th high crossing at $7.33 1/4. Second resistance is the August 27th high crossing at $7.45. First support is the 62% retracement level of the July-August-rally crossing at $6.82 1/2. Second support is the 75% retracement level of the July-August rally crossing at $6.60 1/4.
December Kansas City wheat was higher overnight as it consolidated some Tuesday's sharp decline. Overnight strength sets the stage for a steady to higher opening when the day session begins trading. Stochastics and the RSI are turning neutral to bearish signaling that sideways to lower prices are possible near-term. Closes below last-Tuesday's low crossing at $6.86 1/4 would signal that a short-term top has been posted. If December renews the rally off September's low, the September 7th high crossing at $7.29 3/4 is the next upside target. First resistance is the September 7th high crossing at $7.29 3/4. Second resistance is the August 27th high crossing at $7.35 1/2. First support is last-Tuesday's low crossing at $6.86 1/4. Second support is September's low crossing at $6.70 1/4.
December Minneapolis wheat was higher overnight as it consolidates some of the decline off Tuesday's high while at the same time extending that July-September trading range. Overnight strength sets the stage for a steady to higher opening when the day session begins trading. Stochastics and the RSI have turning neutral to bearish signaling that sideways to lower prices are possible near-term. Closes below the 20-day moving average crossing at $8.99 1/2 would signal that a short-term top has been posted while opening the door for additional weakness near-term. If December extends the rally off September's low, August's high crossing at $9.37 1/2 is the next upside target. First resistance is the August 30th high crossing at $9.27. Second resistance is August's high crossing at $9.37 1/2. First support is last-Tuesday's low crossing at $8.81 3/4. Second support is September's low crossing at $8.61 1/2. Third support is the 25% retracement level of the 2020-2021-rally crossing at $8.44 3/4.
SOYBEAN COMPLEX? http://quotes.ino.com/ex?changes/?c=grains "
November soybeans were higher overnight while extending this month's trading range. Overnight strength set the stage for a steady to higher opening when the day session begins trading. Stochastics and the RSI are neutral signaling that sideways trading is possible near-term. Closes above the September 16th high crossing at $13.08 would signal that a short-term low has been posted while opening the door for a possible test of the 50-day moving average crossing at $13.14 1/4. If November resumes the decline off August's high, June's low crossing at $12.40 1/2 is the next downside target. First resistance is the 16th high crossing at $13.08. Second resistance is the 50-day moving average crossing at $13.14 1/4. First support is last-Tuesday's low crossing at $12.57 1/2. Second support is June's low crossing at $12.40 1/2.
December soybean meal was lower overnight as it extends this month's trading range. Overnight weakness sets the stage for a steady to lower opening when the day session begins trading. Stochastics and the RSI are neutral to bearish signaling that sideways to lower prices are possible near-term. If December resumes the decline off August's high, the 75% retracement level of the 2020-2021-rally crossing at $324.40 is the next downside target. Closes above the September 14th high crossing at $347.30 would signal that a short-term low has been posted while opening the door for additional gains near-term. First resistance is the September 14th high crossing at $347.30. Second resistance is the 50-day moving average crossing at $349.80. First support is September's low crossing at $335.40. Second support is the 75% retracement level of the 2020-2021-rally crossing at $324.40.
December soybean oil was higher overnight and poised to extends the rally off September's low. Overnight strength sets the stage for a steady to higher opening when the day session begins trading. Stochastics and the RSI are neutral to bullish signaling sideways to higher prices are possible near-term. Closes above the September 16th high crossing at 58.75 would signal that a short-term low has been posted. If December renews the decline off July's high, June's low crossing at 51.98 is the next downside target. First resistance is the September 16th high crossing at 58.75. Second resistance is the 50-day moving average crossing at 59.63. First support is September's low crossing at 54.18. Second support is June's low crossing at 51.98.
Thanks much tallpine!
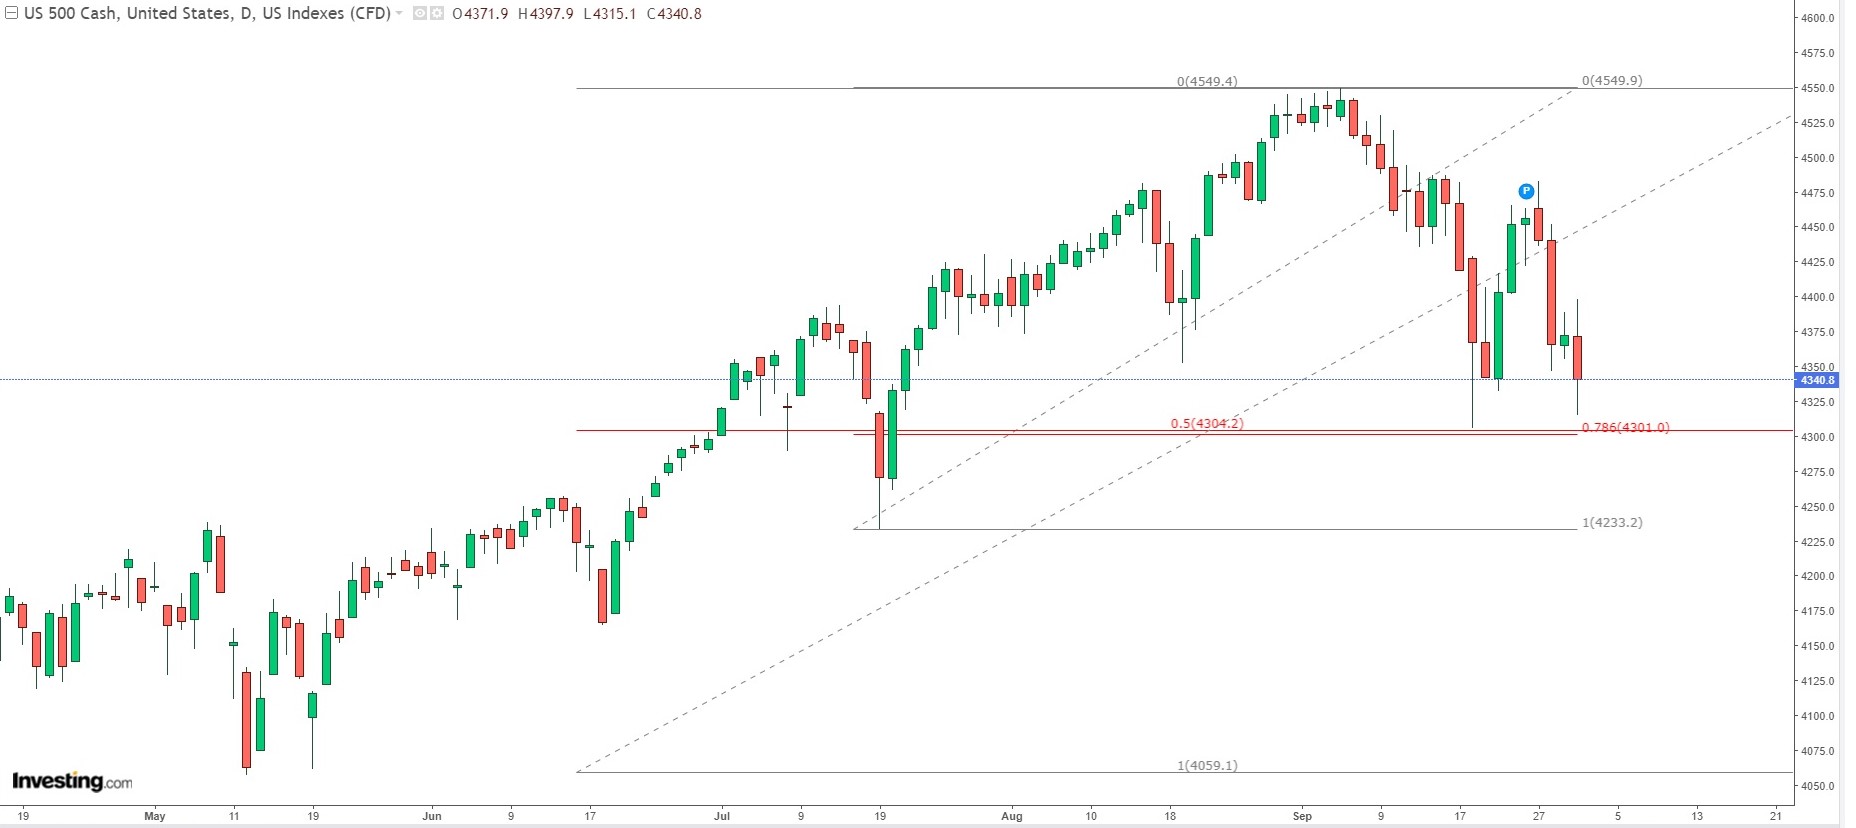
Just a comment on the S&P and a bit of a follow up on the most informative daily chart provided by Gunter a few days ago:
The market has touched upon a combo of important retracements, a 0.5 and a 0.786 which is a confluence of support at roughly 4300
Today is day 4 of a Fibonacci sequence starting with the low on 09/20 and ending with the high on 09/27 which equals 6 trading days , 6 times 0.618 = 3.708 which equals 4 trading days.
Whether today will be a high or a low is yet to be determined, if it turns out to be a high and the support at 4301/4304 gives way then we will see some more down imho.