https://www.nytimes.com/interactive/2021/us/covid-cases.html
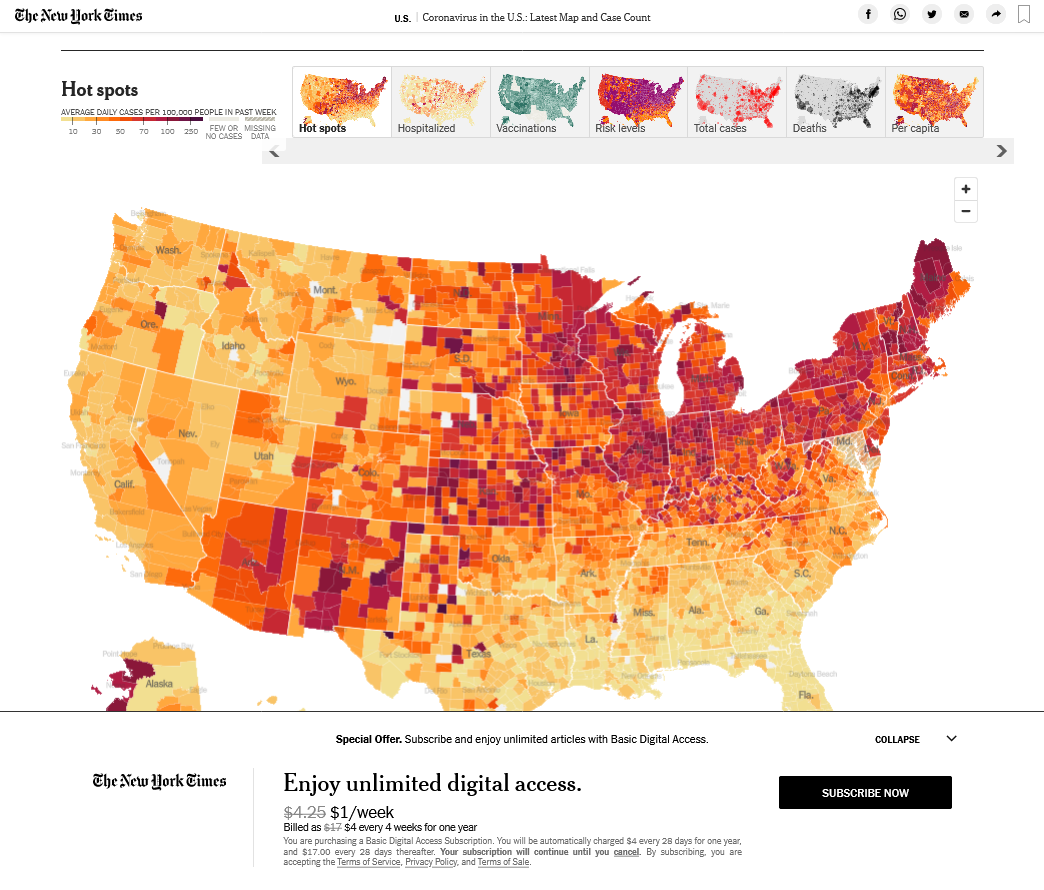
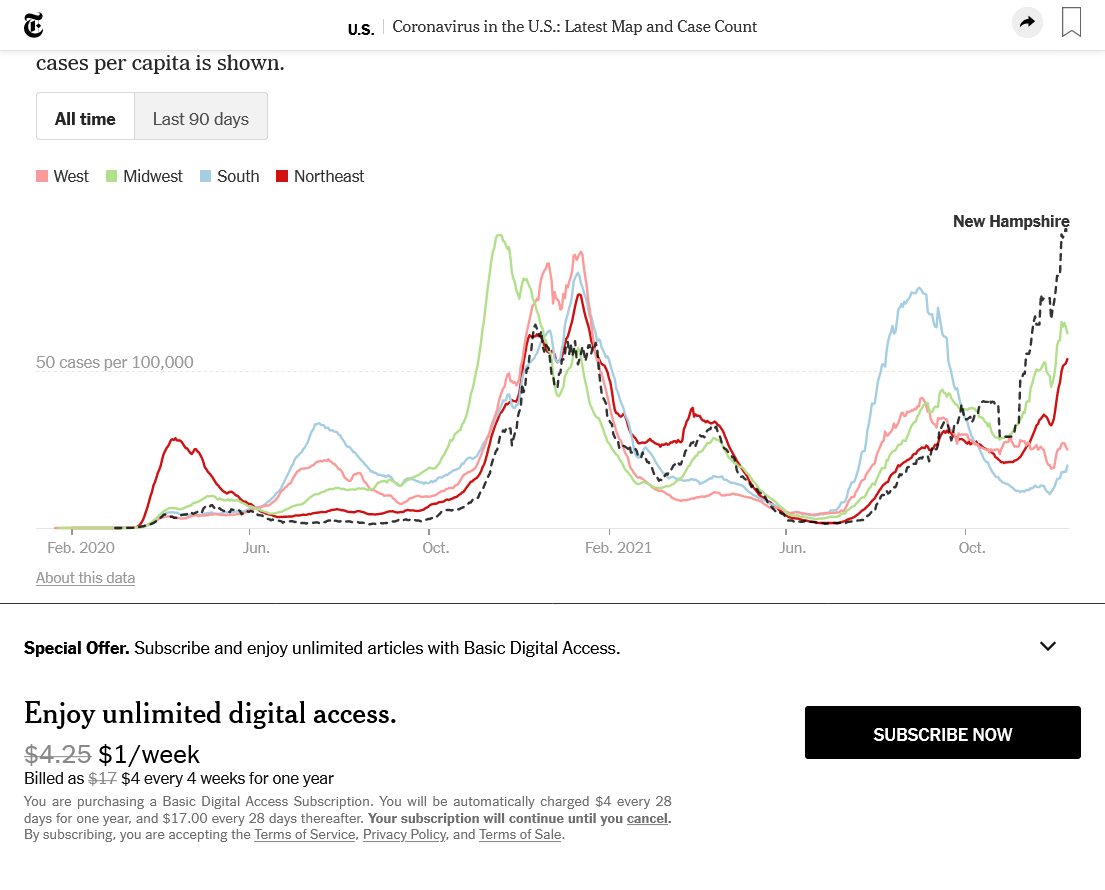
Cases by region:
Midwest and Northeast getting hit hard(with cooler drier air). Virus's love that weather.
South and West doing well(milder, more humid weather).
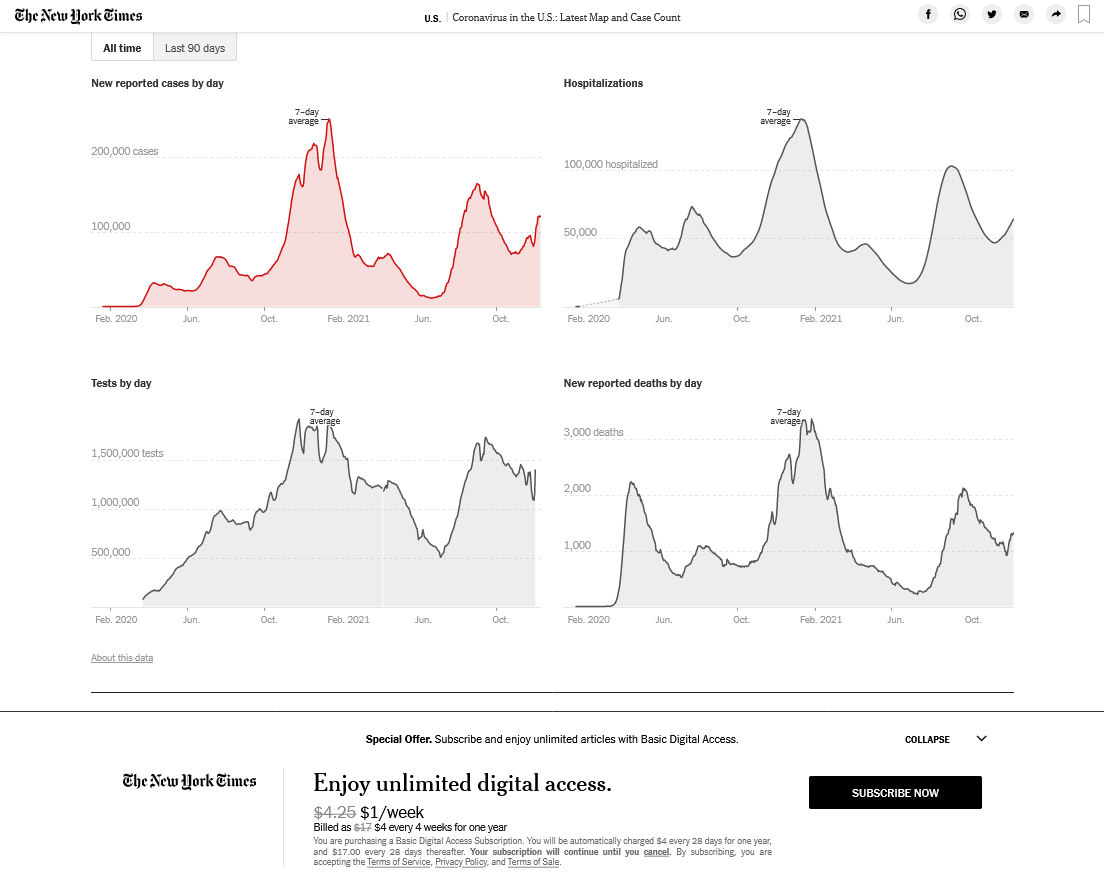
Reliable Statistics on COVID/opinions +Virus Season-weather
19 responses |
Started by metmike - Nov. 11, 2021, 7:54 p.m.
https://www.marketforum.com/forum/topic/77622/
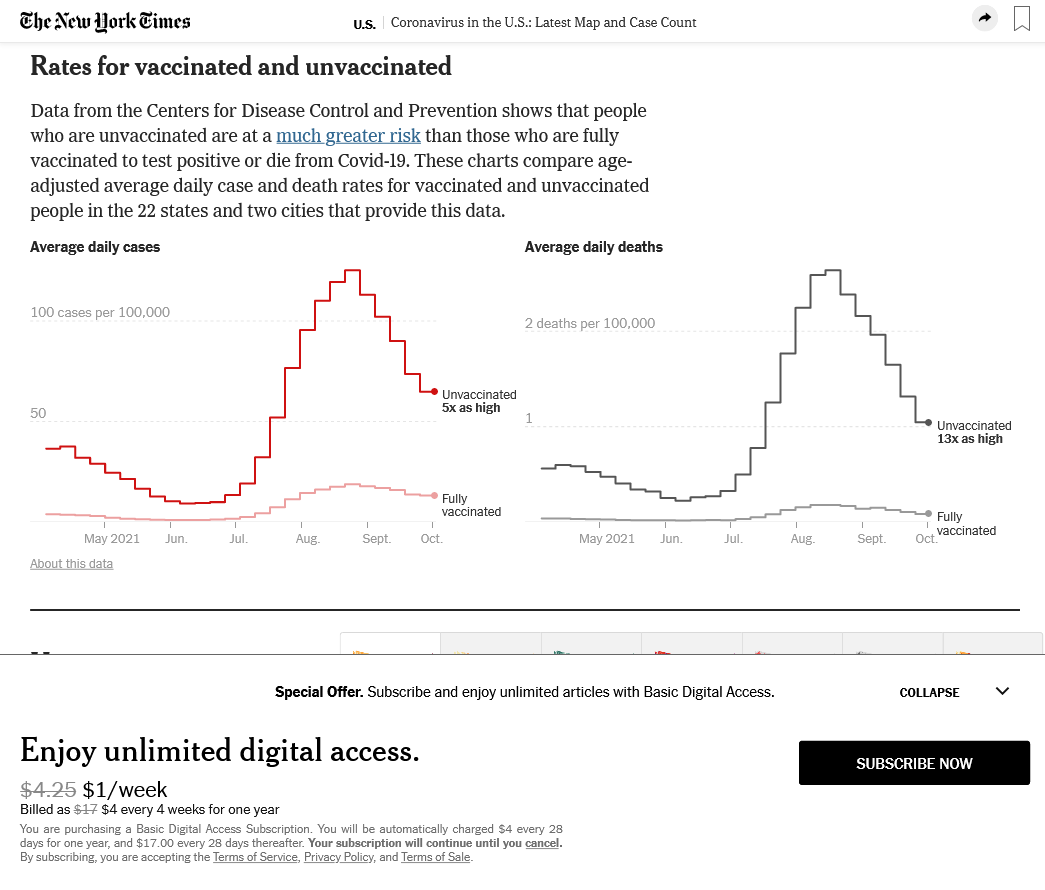
Why are the Ny Times charts age adjusted?
Anyone know of a good reason to age adjust this data?
Is that to make the charts fit the scenario?
"Is that to make the charts fit the scenario?"
Of the many dozens of sources that I have found data at, the NYT has shined brighter than any in showing massive amounts of enlightening/meaningful objective data.
If only they did that with climate science data.
Do you know of a better source cutworm?
Why do you think that they are manipulating the charts to fit the data?
it is a question. I would like to know Why they think that an age adjustment is necessary. It is IMHO necessary to know how and what data is charted to know what it means.
Sicentist= Question everything
Thanks cutworm!
Just seems like another way to get a better understanding of the affects of COVID to me(using age) and maybe they explain why they do it somewhere. I don't have time to look into it, however.
Why the 1918 Flu Pandemic Never Really Ended
Fascinating article about the 1918 flu never ending. Thanks Mike!
Amazing that they can trace the genetic code of a virus back to 1918.
In the article it also affirms other articles I've read that say virus mutations revert to the mean.
Which is to say, they evolve into something akin to the seasonal flu.
It is why I am hopeful that this is the last winter for the pandemic.