https://www.yahoo.com/news/la-nina-conditions-prevail-summer-141622764.html
hey, metmike, what does mean for crop yields going forward?
Great question bear!
I'm in the middle of chess season (coaching 5 schools) and in addition, working as a scientist for my wife's newly formed carbon capture business.
So I will try to get it later today or by the weekend for sure.
Thanks
Mike
This was my last brief update a few weeks ago, without many details:
Another thing about the war on fossil fuels that will hurt future crop yields is this:
Another secret about fossil fuels: Haber Bosch process-fertilizers feeding the planet using natural gas-doubling food production/crop yields. September 2019
https://www.marketforum.com/forum/topic/81786/#81798
By metmike - Feb. 14, 2022, 6:07 p.m.
I do agree with this guy, that if we continue with more La Nina's and any sort of global cooling, the food supplies will not be able to keep up.
La Nina Conditions Continue
Started by metmike - Feb. 11, 2022, 1:58 a.m.
https://www.marketforum.com/forum/topic/81653/
Fake Climate Crisis
Started by metmike - Jan. 18, 2022, 1:07 p.m.
https://www.marketforum.com/forum/topic/80552/
This one here is a real good one!
LaNina caused the drought and wildfires.......LaNina's are a cold water anomaly in the East/Central Tropical Pacific..........the opposite of El Nino/global warming
https://www.marketforum.com/forum/topic/73659/#73720
If we turned the atmospheric clock back to 100 years ago and it was suddenly 1 deg.C cooler and the atmospheric CO2 was 120 parts per million lower like it was in 1922...........over a billion people would starve to death within 3 years.
Storage/stocks would run out quickly and rationing would cause food prices to at least triple during that period for many foods.
Check out this website https://nasagrace.unl.edu/
Look at both North America and Europe.
Wonderful link/maps tallpine!!!
The drought got better in the N.Plains since last growing season but is WORSE in the S.Plains.
La Nina is bad news for drought relief.
El Nino would be good news............but it won't be coming this growing season.
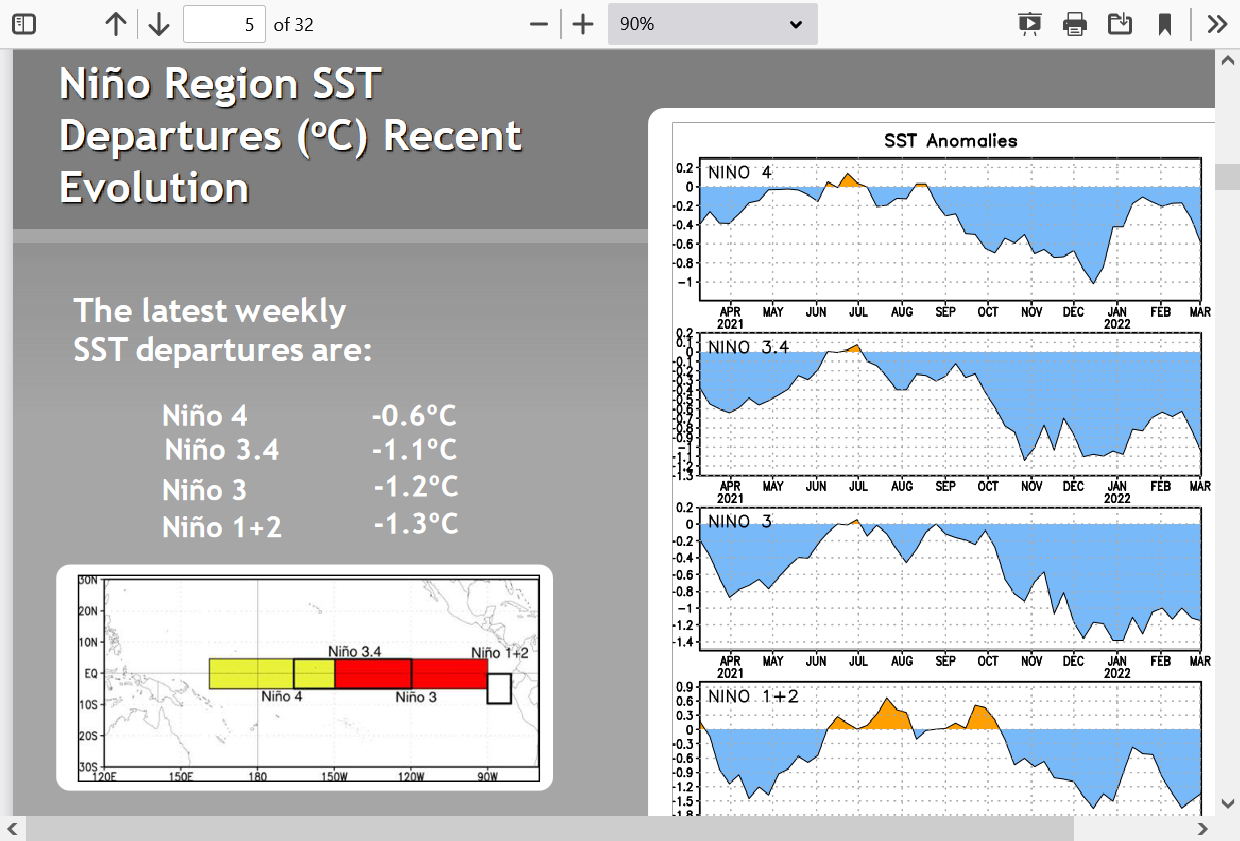
Eric Snodgrass
Low skill before spring for summer forecast, spring barrier
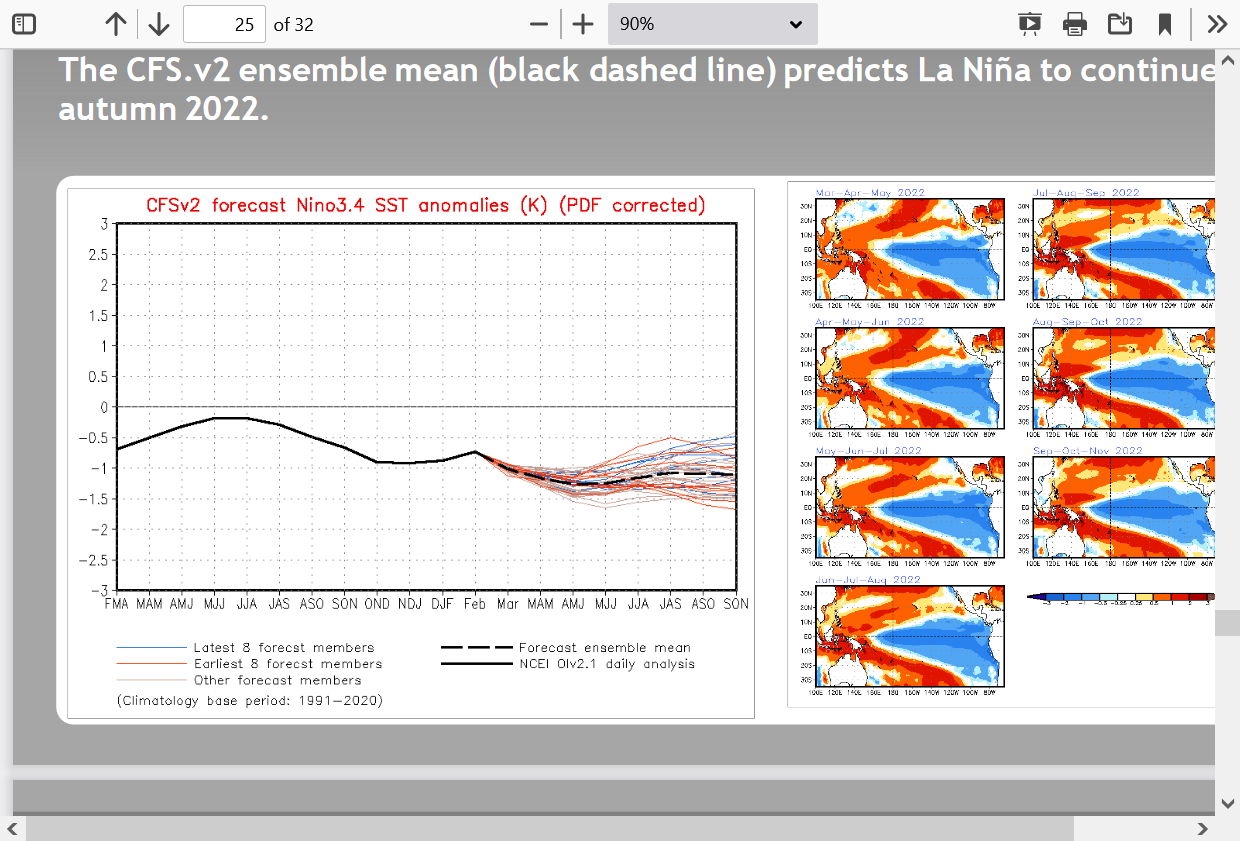
NMMME and Euro Forecast
At 9:10 La Nina discussion
Ag Weather Forecast with Eric Snodgrass (in-depth) | Nutrien Ag Solutions | March 10, 2022 - YouTube
Thanks a zillion cutworm!
Eric is THE best and that was THE best seasonal weather forecast presentation I've ever watched!
It blows away anything that I ever did but I'll follow it up with additional stuff later this weekend.
Because of the La Nina and current dry soils out West into the C/S Plains, we have one of the most bullish long range (seasonal) growing season forecasts that I can remember.
Keep in mind that seasonal forecasts do not have great skill.
https://www.cpc.ncep.noaa.gov/products/NMME/seasanom.shtml
April/May/June precip below:
NMME | Prob fcst | PAC calib. prob fcst |
|---|
NCEP_CFSv2 | CanCM4i | GEM5_NEMO | GFDL_SPEAR |
|---|
NCAR_CCSM4 | NASA_GEOS5v2 | IMME |
|---|
April/May June Temperatures below
NMME | Prob fcst | PAC calib. prob fcst |
|---|
NCEP_CFSv2 | CanCM4i | GEM5_NEMO | GFDL_SPEAR |
|---|
NCAR_CCSM4 | NASA_GEOS5v2 | IMME |
|---|
https://www.cpc.ncep.noaa.gov/products/NMME/seasanom.shtml
June/July/August precip below
NMME | Prob fcst | PAC calib. prob fcst |
|---|
NCEP_CFSv2 | CanCM4i | GEM5_NEMO | GFDL_SPEAR |
|---|
NCAR_CCSM4 | NASA_GEOS5v2 | IMME |
|---|
June/July/August temperatures below
NMME | Prob fcst | PAC calib. prob fcst |
|---|
NCEP_CFSv2 | CanCM4i | GEM5_NEMO | GFDL_SPEAR |
|---|
NCAR_CCSM4 | NASA_GEOS5v2 | IMME |
|---|
The pictures on the previous pages and here are worth 1,000 words!
Soilmoisture anomaly:
These maps sometimes take a day to catch up to incorporate the latest data(the bottom map is only updated once a week).
https://www.cpc.ncep.noaa.gov/products/Soilmst_Monitoring/US/Soilmst/Soilmst.shtml#
![]()


U.S. Drought Monitor
https://droughtmonitor.unl.edu/Maps/CompareTwoWeeks.aspx
TOP Map is Sept 7. Bottom map is the last one, March 8, 2022.
Drought Improved in the Upper Midwest, N.Plains and West.
Drought expanded in S.Plains!!
Wet in the Eastern Cornbelt!

MARCH 8, 2022 BELOW

If the projection for hot/dry weather does verify this growing season, there is a 100% chance that many sources(the usual ones) will blame it on climate change from global warming that has resulted from burning fossil fuels.
Not 99.99% but 100% chance that the same ones that have been doing it for 30 years will do it again.
Not only will they be wrong but they will be wrong in the complete opposite direction. The best way to avoid this would be to have global warming and an El Nino ASAP! The entire reason for these hot/dry forecasts is the current extremely long lived La Nina to continue.
The same La Nina that's caused the current long lived drought in the West to the Plains to the WCB.
The same La Lina that's greatly increased the wildfires out West the last 2 years.
La Nina's are not only natural phenomena, they are associated with global COOLING(or in this case, a pause in global warming).
For the past few years, we've had a pronounced ANTI global warming atmospheric weather pattern dominating in our part of the world and many other places too.
But those are all just words above. Let's PROVE it with the empirical data...that they WON'T show you this Summer when they claim it was from climate change, just like they've falsely blamed this drought and the wildfires on it.........despite the pattern that entire time being ANTI global warming.
https://www.marketforum.com/forum/topic/82262/
March 1st, 2022 by Roy W. Spencer, Ph. D.
The Version 6.0 global average lower tropospheric temperature (LT) anomaly for February, 2022 was 0.00 deg. C, down a little from the January, 2022 value of +0.03 deg. C.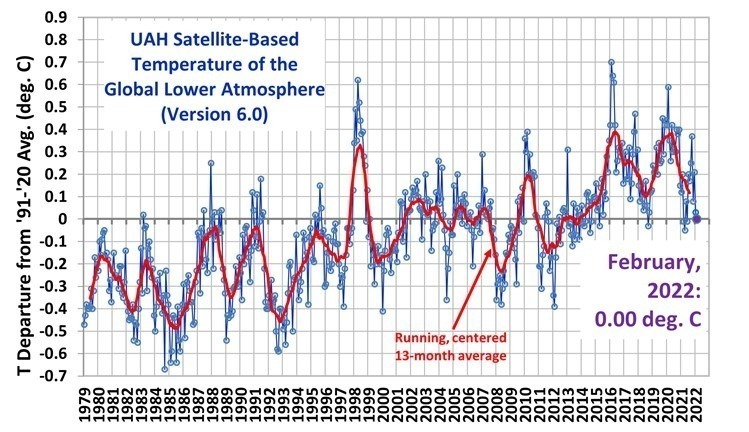
There has been no global warming the last several years as shown on the temperature graph above.
Global warming has not stopped forever as some "deniers" would falsely claim and I would refer to this as probably more of a temporary PAUSE in global warming instead of cooling but the past several years have indisputably featured global COOLING weather patterns around the world, especially locations closest to the source of the global cooling(the Pacific Ocean)!
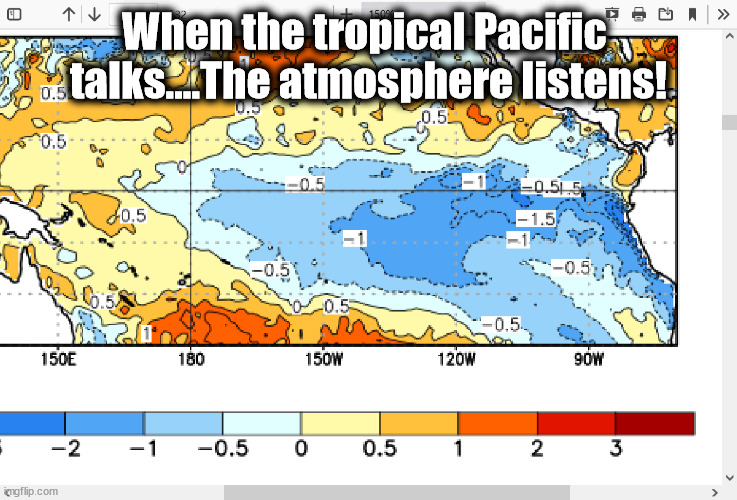
The Pacific Ocean contains 2/3rds of the heat stored on this planet(almost all of it in the oceans and the Pacific is the biggest ocean by far).
Remember the commercial "When EF Hutton talks........people listen"?
https://www.youtube.com/watch?v=2_ygqPepLjM
https://www.youtube.com/watch?v=2MXqb1a3Apg
https://www.youtube.com/watch?v=AetDSsgrWWk
It's the exact sort of thing with the Pacific ocean and atmosphere. Biggest ocean on the planet and when it speaks(with strong temperature anomalies) the entire atmosphere around the world listens(responds). The closer you are to the Pacific Ocean, the louder its message is to the atmosphere above it!!!
Anomalous warm temperatures in the tropical Pacific cause it to belch out heat and warm the entire planet by several tenths of a degree........just from that. This is usually the case during global warming spikes higher. This is from El Nino's.
The current long lived La Nina is exactly the opposite of that. Strong COLD temperature anomalies in the Central/Eastern tropical Pacific Ocean means much LESS heat coming out into the atmosphere! This is entirely responsible for the modest temporary global cooling during the last few years and also the weather pattern in the US. This has been an ANTI global warming pattern.
This is the La Nina below:
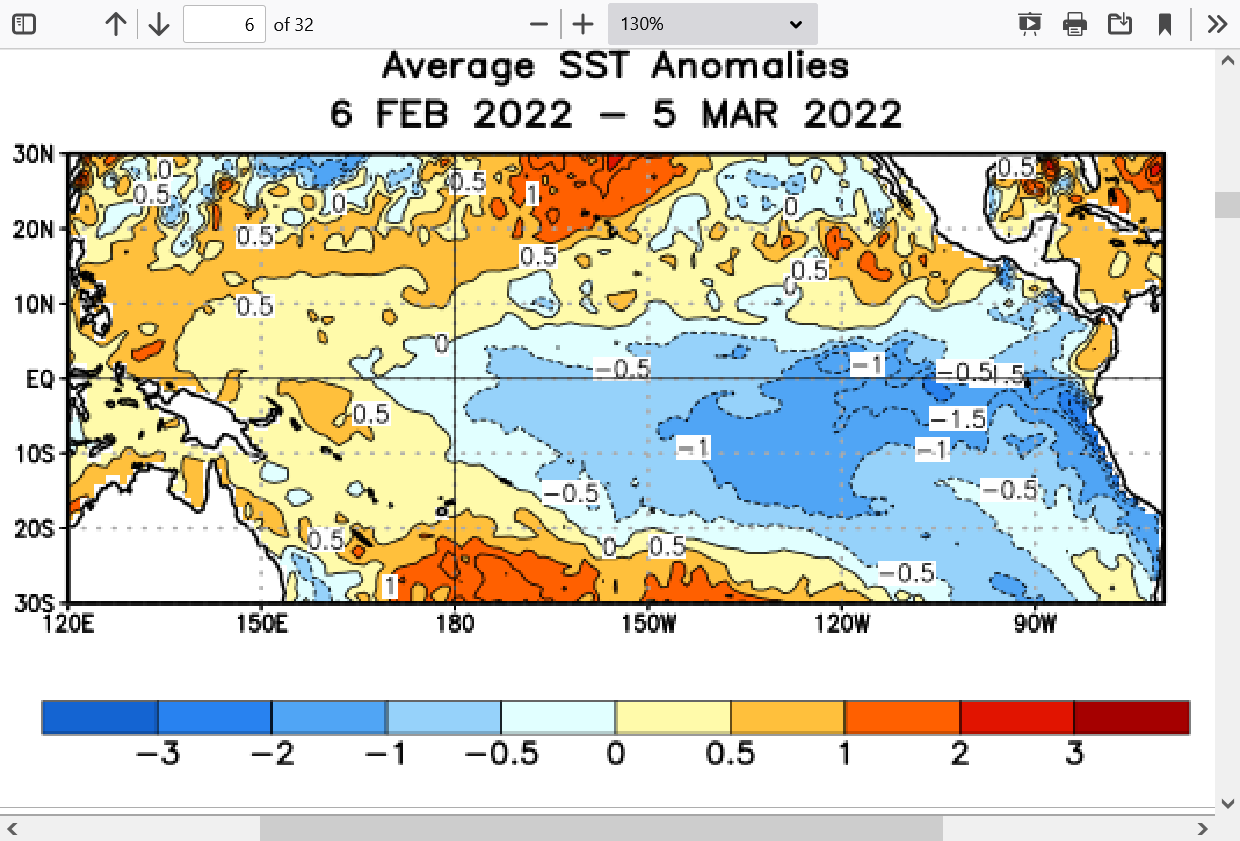
Below is how that huge cool water anomaly pool looks like on the big picture scale. Amazing that this location is so influential in controlling global temperatures and weather. This is related to the massive amount of heat stored in that region.

More on the next page.
Our best chance to break the drought would be to have an El Nino and global warming. Very few people know the truth. Global warming/El Nino's greatly increase the chances for FAVORABLE growing season weather and increasing crop yields for most crops in the United States.
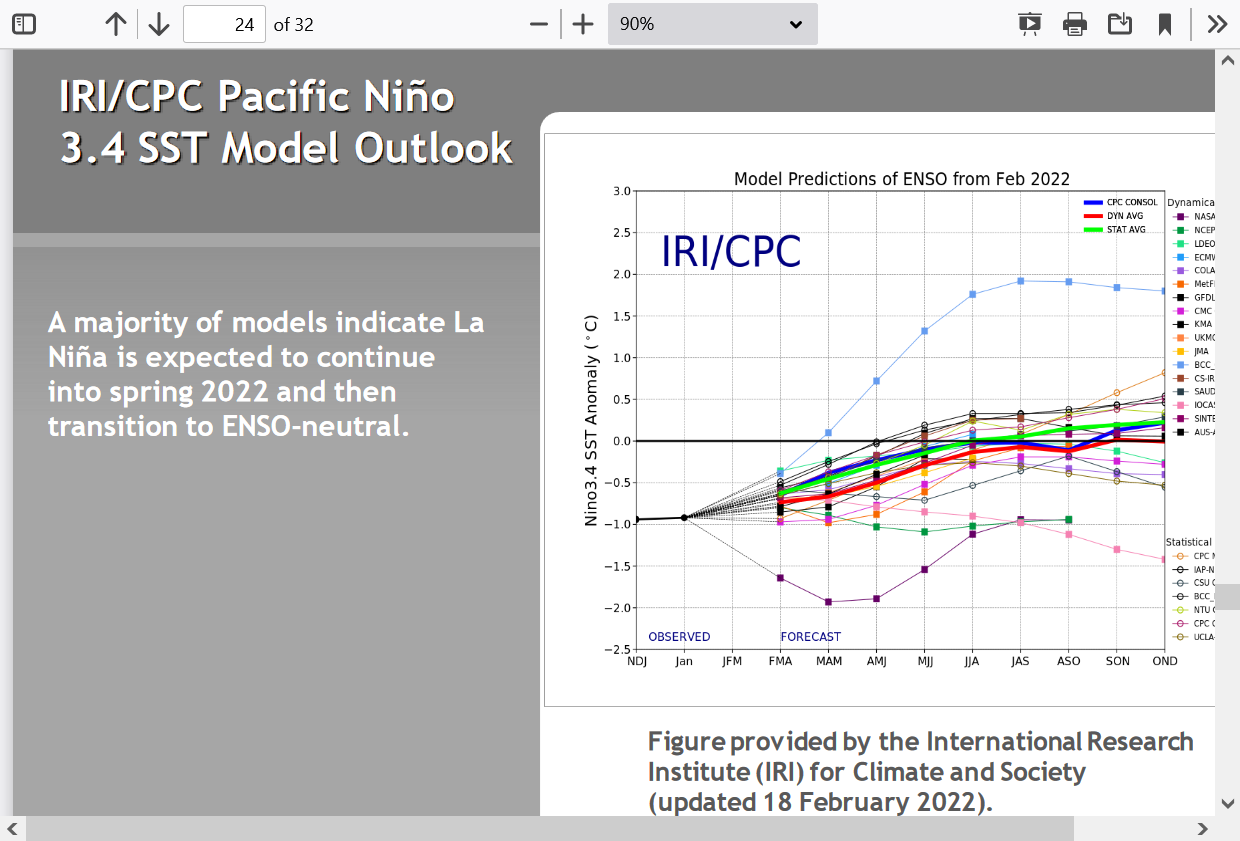
Unfortunately, almost none of the models project that right now. Some of them go to ENSO neutral which is not as bad as La Nina but only 1 out of dozens of models projects an El Nino.
This means global warming with gusto is not likely to return for a bit longer. That would be good news for people that think global warming and the fake climate crisis are bad! It's the complete opposite with the recent climate optimum.
Here's some predictions going out much farther based on the REALITIES of CO2 and global warming. They continue to increase thru the year 2100. It uses actual observations and the law of photosynthesis.
https://www.marketforum.com/forum/topic/69258/#69259
https://earthobservatory.nasa.gov/images/146296/global-green-up-slows-warming
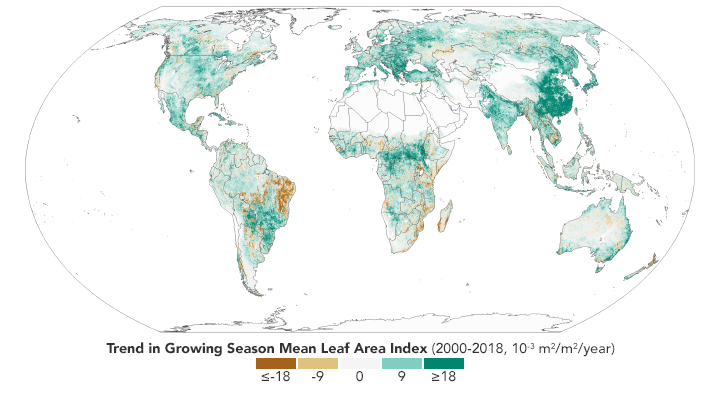
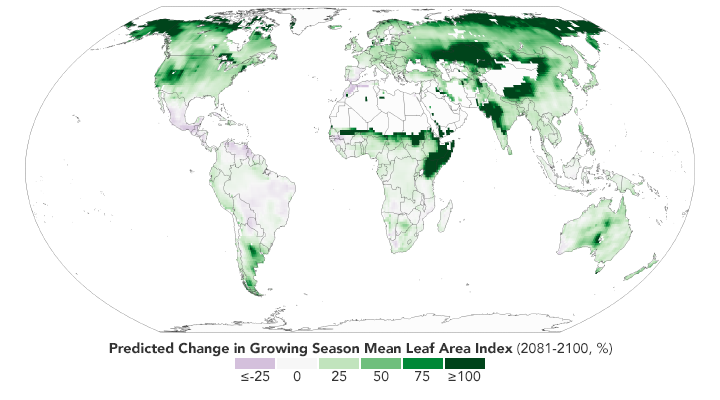
"The paper’s authors reviewed more than 250 published articles that have used satellite data, modeling, and field observations, to understand the causes and consequences of global greening. Among the key results, the authors noted that on a global scale greening can be attributed to the increase of carbon dioxide in the atmosphere. Rising levels of carbon dioxide increase the rate of photosynthesis and growth in plants."
metmike: Why isn't this paper, based on 250........let me repeat that number 250 published articles using the best technology known to science............getting much news coverage?
Because they don't want you to know this!
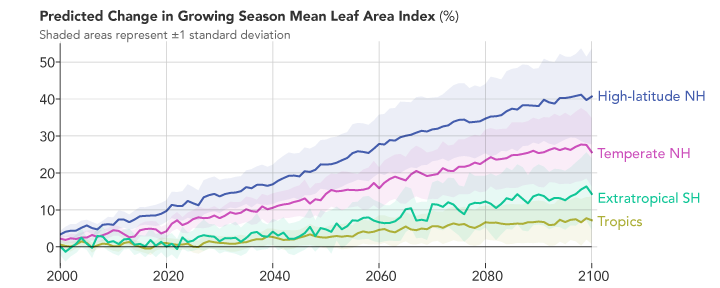
From the projections: According to climate models, the future looks even greener. The second map shows what the green-up might look like in the future based on the Coupled Model Intercomparison Project (CMIP5) climate model, under a scenario in which increases in greenhouse gases lead to almost 5° Celsius (9° Fahrenheit) of warming by the end of the 21st century. Specifically, it shows the predicted change in the growing season’s “leaf area index” from 2081-2100 relative to 1981-2000. The chart below the map shows the predicted changes by latitude. Notice that high latitudes in the Northern Hemisphere are still expected to change the most.
metmike: There is almost no chance we will see that amount of warming(9 Deg. F/5 Deg. C.)
In fact, people, including scientists using models like that with almost impossible numbers(which would mean the warming would have to suddenly be amplified by 4 times and stay that way for almost 80 years) totally give away that they have discarded all science and are purely political.
I had a conversation with an intelligent person that I respect very much yesterday that caused me to try harder in order to communicate the authentic science to fight the DISinformation about climate science that has totally taken over almost every brain in society today.
I want to THANK HIM for insisting on the wrong position last night because it's forced me to be even better at clearly communicating authentic climate science to help most people, who have been intentionally misled. In fact, this guy is MUCH smarter than the VAST majority of people.
If an atmospheric scientist can't spend an extra couple of hours explaining this......then where else will people get it!
I'm adding it to this MarketForum thread with a huge thanks to him!
Please try to have an open mind here, for those that think they already know what climate change/science is all about.
Almost everybody associates global warming exclusively with the increase in CO2. They KNOW that's what its all about... end of story.
Like suddenly, none of these other factors matter anymore because the physical laws of the oceans and atmosphere have been redefined to no longer have meaning and all we need to do is look at CO2 as the control knob.
This is why I get upset at the current sources providing ALL the information on this topic for stealing people's intelligence in my profession/field of expertise.
My email discussion yesterday, focused on thinking that I was using a wrong expression to describe this La Nina as anti global warming that is against science to mislead people but actually IT IS THE SCIENCE!
Just not the science you've been brainwashed to believe in.
Please put on the objective thinking cap and pretend you don't know what you think that you know for a few minutes now.
Most of the time, other sources say to do the OPPOSITE. Ignore this because people like me are evil deniers trying to sabotage their "save the planet" objective.
1. I'm an outspoken, practicing environmentalist that fights hard against DIS/MISinformation every day.
2. Please fact check everything presented here (like you should be doing with EVERYTHING you get off the internet).
La Nina's are parts of a natural, anti global warming dynamic that are more frequent during a -PDO(Pacific Decadal Oscillation) regime in the Pacific that can OPPOSE global warming for decades, like it did in the 1950's/60's/70's, when we had modest global cooling for around 30 years.
We are in fact, experiencing one of those periods right now(BUT NOT WITH 30 YEARS OF COOLING, JUST A FEW YEARS SO FAR OF TEMPORARY COOLING that I refer to as a pause in the warming)
During the 1980's/90's, the PDO flipped to a +PDO regime in the Pacific Ocean....and featured the complete opposite as we had more El Nina's that ENHANCE global warming and they added to the effect of global warming from increasing CO2.
Most people have the same completely wrong understanding.....thinking that El Nino and La Nina are just local events that occur randomly for a couple of years, then go away. WRONG!
Climate science gone political has robbed most people of an authentic understanding of many elements to climate, including this.
Yes, the increase in CO2 has super imposed close to 1 deg of warming on the atmosphere the past 100+ years but climate scientists thinking that it was entirely from CO2 has caused them to use equations that have doubled model projections of warming over the accurate, measured data/observations the past 2 decades. Even after we've had this empirical data, busting the models with certainty of doubling the real warming and proving this indisputably, THEY REFUSE TO CHANGE THE MODELS. This proves climate science as you know it, is really just political science.
El Nino's and La Nina's are part of a huge oceanic cycle in the vast Pacific that repeats around every 60 years and has a very significant, CONSTANT effect on climate and global warming in this case, that can oppose it for several decades or enhance it for several decades. This is irrefutable climate science.
There is stored heat in the Pacific from hundreds of years ago that comes out in what appears to be this 60 year cycle and based on the same solid science/physical laws, the Atlantic has a similar 60 year cycle called the AMO(Atlantic Multi Decadal Oscillation).
http://appinsys.com/globalwarming/SixtyYearCycle.htm
Profound: Smoking Guns!! Proof with accurate 2 decade long measurement of the actual amount of radiative forcing caused by CO2 of 1 irrefutable reason for WHY global climate models continue to be too warm. Climate emergency is really about social justice and brainwashing people. Even MORE confirmation that climate models overstate atmospheric warming. Models clearly too warm yet incredibly programmed to get even HOTTER! Now, even more confirmation why the models are too warm. August 2020 https://www.marketforum.com/forum/topic/57636/
More links to gain a better understanding on this topic.
There are MANY dozens on the internet. I just picked these:
Moody Pacific Unleashes Another Climate Mystery
https://www.nasa.gov/vision/earth/environment/PDO.html
https://www.nature.com/scitable/knowledge/library/el-nino-s-grip-on-climate-25816069/
https://www.nature.com/articles/srep06651
This is just a video with an unproven theory below, some of which I'm not on board with but has good explanations for how climate works that should be heard:
https://www.youtube.com/watch?v=IMH_K8IF-1s&t=1s
https://www.mdpi.com/2073-4433/10/4/211/htm
I always say that posts here on Marketforum that disagree with me are my favorites because they are potential opportunities for me to learn and potential opportunities for me to better express an idea backed by empirical data/science to assist the other person to learn.
When dealt with in a positive way..............BOTH sides learn!
I know with certainty that I learned from that discussion last night!
More elaboration to help others understand why a -PDO, with it's increased La Nina's is an anti global warming pattern during the typical -PDO phase that often lasts 3 decades. The +PDO phase often lasts around 3 decades also but there is a wide margin and variations.
We've only recently learned about it and don't have enough historical measurements of the 60 year cycles to study to even know if 60 years is the true periodicity or if it just randomly happened to be 60 years after we became aware of it and started measuring it accurately.
It's not taught to the public because the public must be brainwashed to believe that increasing CO2 is the ONLY thing that affects global warming.
As you can see below, during -PDO regimes, global warming IS OPPOSED by the much more frequent La Nina's. In fact, we actually had modest global cooling.
During +PDO regimes, which feature more El Nino's, you can see just as easily on the graph below how they enhance and accelerate global warming. In fact, ALMOST ALL the global warming we've experienced, has taken place during the 30 year +PDO phases.
-PDO has basically stopped global warming to even reversed it for 30 year periods during the last 140 years.
+PDO has accelerated it.
Nobody is saying there is NO global warming overall but 30 years is plenty long enough to be considered part of climate. Increased La Nina's are part of the -PDO climate regime. That's exactly why we have NOT seen global warming for several years. The La Nina's have stopped it.

Good analogy. In a big city with an increasing population and increasing crime the past 140 years, let's say we had crime fighting mayors in office for 30 year periods that increased the size of the police force during those years, followed by mayors that used the money for other things and reduced the police force for 30 years.
If crime went down during those 30 years with more aggressive measures to fight it, we would call the increase in cops as being a key part of an anti crime regime(similar to La Nina's being anti global warming events because they fight the physics of green house gas warming).
When they police force is cut back and crime increases again, it's like a +PDO that causes more global warming enhancing El Nino's.
More El Nino's are the result of massive stored heat in the Pacific Ocean burping out. They aren't just one and done. They are clustered with more frequency, having decadal frequency in the periodicity. (+PDO's)
La Nina's are the exact opposite. Again, we are in a -PDO regime and that's why we are not having global warming right now.
I call it a pause looking at the 150 year trend above because the increase in CO2 and the greenhouse effect is superimposed on the global temperature.
Saying that La Nina's can't be anti global agents is just not understanding climate science............just like saying that cops are not anti crime fighting agents if their increased presence is only over brief periods.
I can find 1,000 links and articles on global warming/climate change that don't mention this but you have to really search to find links that do.
It's for real folks!
As I've been saying forever, the climate science being taught to you is more political science at times.
This is the perfect example/evidence.
The typical -PDO phase illustration below is very close to what we've had in the recent, long lived La Nina.
Sea Surface Temperature Anomalies During a Cold PDO Phase
https://legacy.climate.ncsu.edu/climate/patterns/pdo
Below is our current SST temperature anomaly. EXTREMELY similar:
https://www.marketforum.com/forum/topic/82479/#82536
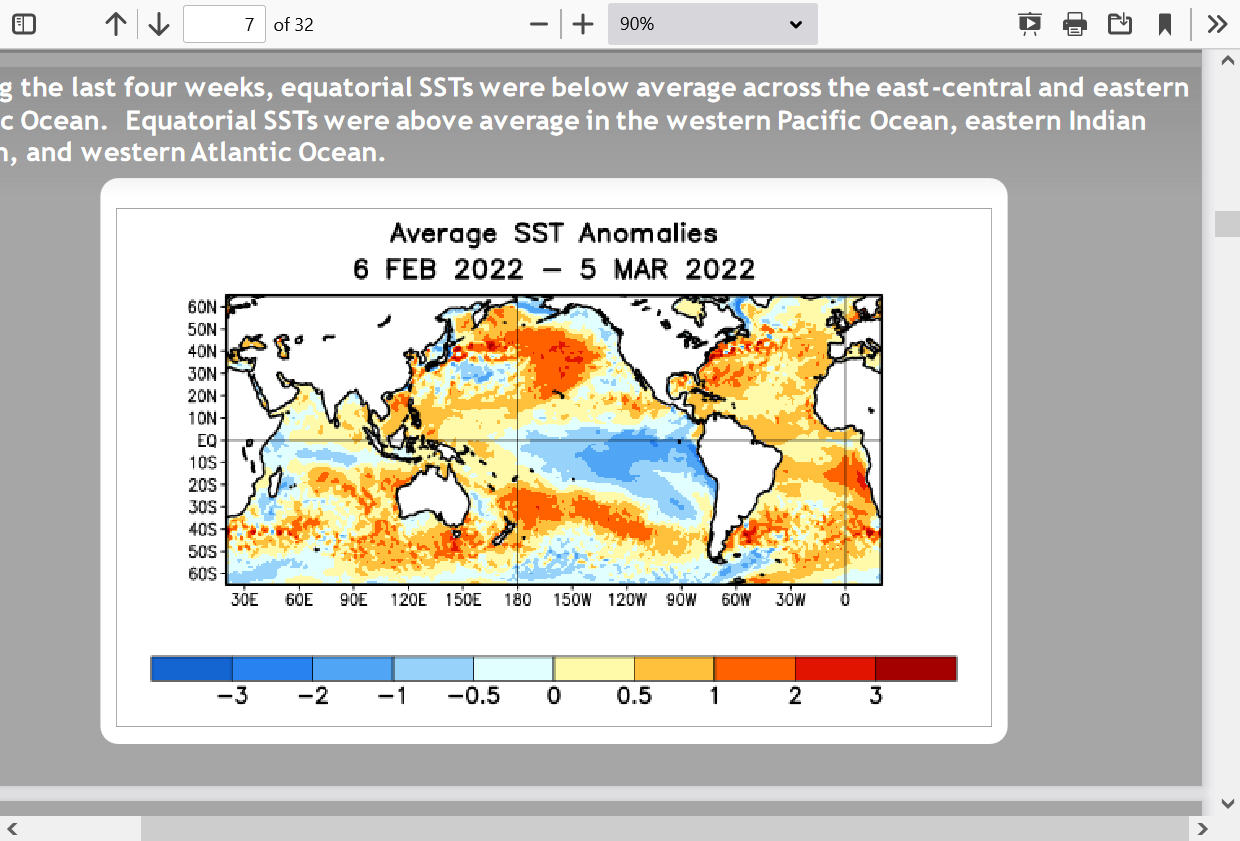
This is also why we're have a long lived(for La Nina's) anti global warming La Nina as part of the current -PDO which is preventing the planet from warming.
When the -PDO and more La Nina's go away. We will start warming again, especially during global warning enhancing El Nino's.
If one wants to ignore the powerful 30 year PDO(60 years for the entire cycle) influence on global temperatures and use only the increase in CO2..........that perfectly fine.
But that person is absolutely NOT following authentic climate science......which means almost everybody.
This makes it almost impossible for lessons in authentic climate science like this to gain traction in minds that have already decided that these principles are NOT climate science.
Latest weather here:
https://www.marketforum.com/forum/topic/78385/
I'm in Detroit this week with my 96 year old dad.
I emailed this message out earlier today:
One of the biggest problems/reasons with spending so much time with this recent La Nina is that we also have a -PDO(Pacific Decadal Oscillator) that lasts for decades and the temp profile in the Pacific under this regime is for cold water anomalies/La Nina's to be much more prevalent.
The +PDO and more El Ninos, along with enhanced global warming is what resulted in the longest stretch in history for the US to go without a drought and also the best growing conditions ever.
Only 1 major drought (2012) after the 1983 major widespread drought.
The Midwest, historically, had averaged around 1 major drought every decade(if you take out the 1930's Dust Bowl which was much of that decade) until global warming kicked in with the global warming enhancing El Nino's that protected us most of the time for several decades.
We've had the complete opposite pattern in place for the last 2 years now, with the current La Nina, causing the severe drought in parts of the Plains/westward. 2022 is shaping up to be the next severe drought in the Midwest.
Skill at forecasting weather long range like this is low, so hopefully it won't happen. However, ocean temperatures and oscillators take many months to years to change, so all we can say with certainty, is that based on the known, proven physics/interactions between the Pacific ocean and the atmosphere in the US, odds for the drought to expand and intensify in the Cornbelt this year are greatly elevated.