Tracking the weather system.
Hold on to your hats and anchor your flimsy outdoor furniture down!!
High wind warnings likely with this one as winds gust to 50 mph....... WITHOUT thunderstorms!
The next 3 maps update several times/hour:
CURRENT WEATHER
Surface Pressure/Wind (Incredible winds are developing)
https://www.spc.noaa.gov/exper/mesoanalysis/new/viewsector.php?sector=20

Temp/DP/Wind-Surface observations
https://www.spc.noaa.gov/exper/mesoanalysis/new/viewsector.php?sector=20#

Temp/Wind/DP/pressure below (holy cow, look at the temperature gradient)
https://www.spc.noaa.gov/exper/mesoanalysis/new/viewsector.php?sector=20#

This link below provides some great data. Hit the center of the box below for the area that you want, then go to observation on the far left, then surface observations to get constantly updated surface observations.
 |
Local NWS for Evansville Indiana:

Hourly weather graph:
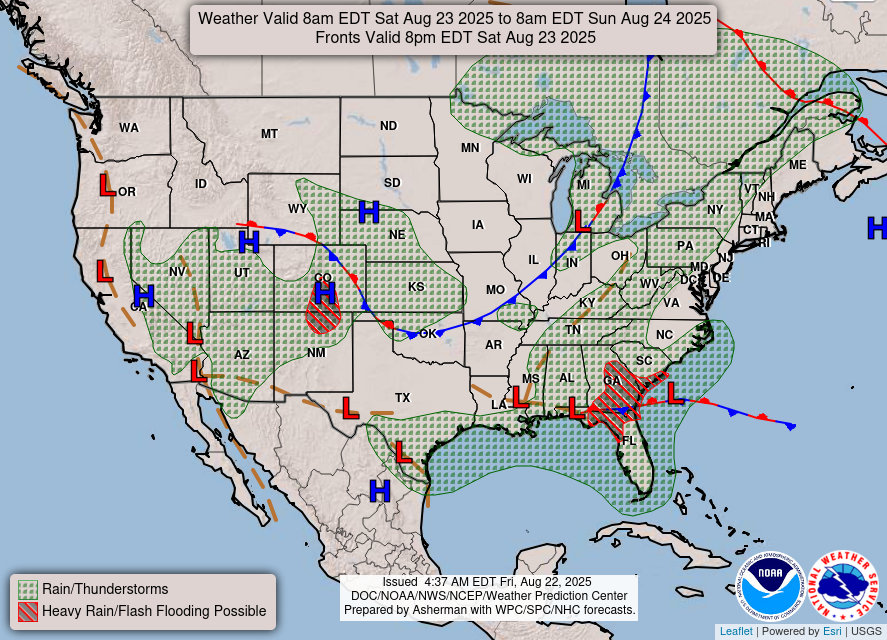
Severe Storm Risk......updated at least daily.
Severe storms/tornadoes possible, especially in orange/red but also in yellow.
https://www.spc.noaa.gov/products/outlook/
Current Day 1 Outlook | |
Current Day 2 Outlook | |
Current Day 3 Outlook | |
Current Day 4-8 Outlook |
Excessive rain threat(low threat).
https://www.wpc.ncep.noaa.gov/qpf/excess_rain.shtml
Current Day 1 Forecast
Day 1 Threat Area in Text Format
Current Day 2 Forecast |

The latest precip forecasts are below.
Day 1 below:
http://www.wpc.ncep.noaa.gov/qpf/fill_94qwbg.gif?1526306199054

Day 2 below:
http://www.wpc.ncep.noaa.gov/qpf/fill_98qwbg.gif?1528293750112

Day 3 below:
http://www.wpc.ncep.noaa.gov/qpf/fill_99qwbg.gif?1528293842764

Days 4-5 below:
http://www.wpc.ncep.noaa.gov/qpf/95ep48iwbg_fill.gif?1526306162

Days 6-7 below:
http://www.wpc.ncep.noaa.gov/qpf/97ep48iwbg_fill.gif?1526306162

7 Day Total precipitation below:
http://www.wpc.ncep.noaa.govcdx /qpf/p168i.gif?1530796126

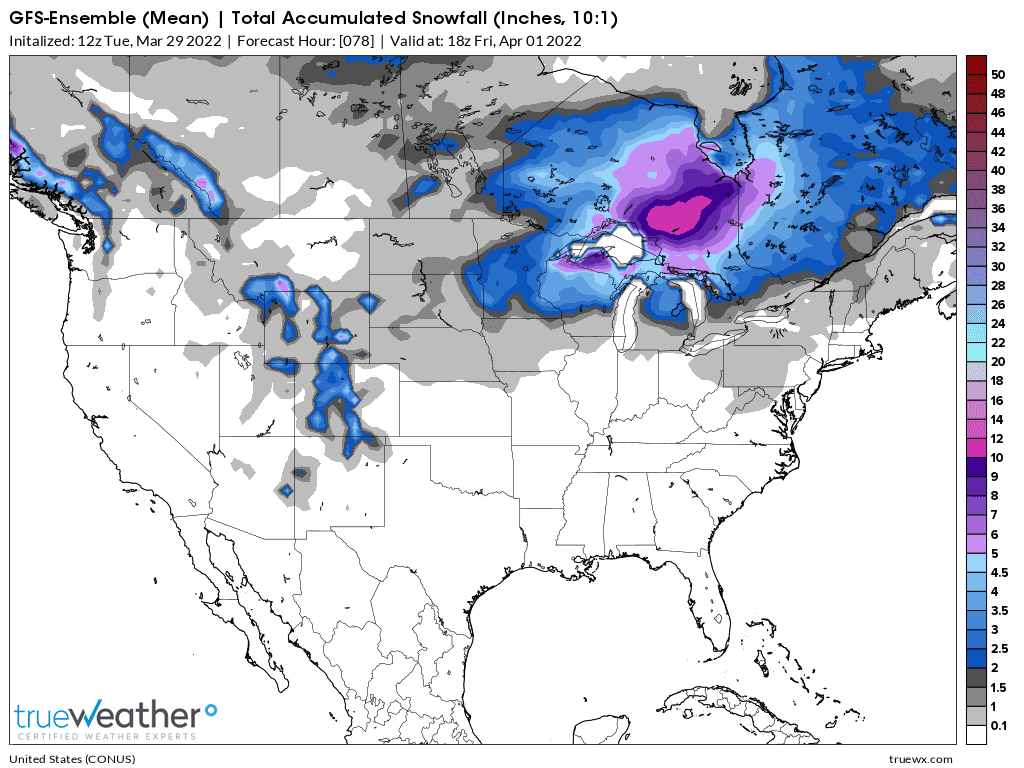
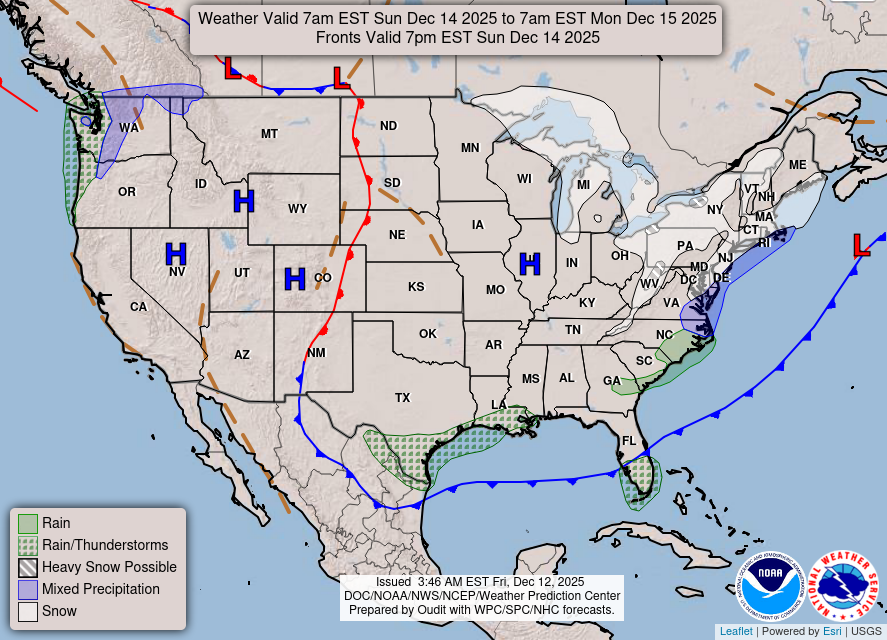
Here's the forecast from the snow/ice forecasting experts!
WPC Probabilistic Winter Precipitation Guidance
https://www.wpc.ncep.noaa.gov/wwd/winter_wx.shtml
Total snow the next 3 days from the GFS ensemble mean just updated:
Would be interesting to see the storm data/graphics for the storm that rolled through central California starting late Sunday night and continuing all day Monday. Just form personal observation, we had a decent amount of rain fall, lightning and thunder, and even some hail.
Thanks mm!
This is the same storm energy reforming east of the Rockies!
Severe Storms Forecast Center:
Evansville risk elevated.......now in the "enhanced threat"
https://www.spc.noaa.gov/products/outlook/day1otlk.html
See this verbiage at the link above:
Day 1 Convective Outlook NWS Storm Prediction Center Norman OK 1056 AM CDT Wed Mar 30 2022 Valid 301630Z - 311200Z ...THERE IS A MODERATE RISK OF SEVERE THUNDERSTORMS OVER PORTIONS OF WESTERN TENNESSEE...EASTERN ARKANSAS...NORTHERN/EASTERN LOUISIANA...MISSISSIPPI...WESTERN/SOUTHERN ALABAMA...AND THE WESTERN FLORIDA PANHANDLE... ...SUMMARY... A regional outbreak of severe thunderstorms is expected from the Lower Mississippi Valley into parts of the Ohio and Tennessee Valleys today, and over portions of the central Gulf Coast states later today into tonight. The greatest concerns are tornadoes (some strong, EF2+) and widespread damaging wind gusts (some to hurricane force). ...Lower OH/MS Valleys... Morning water vapor imagery shows a progressive shortwave trough rotating across TX/OK. This trough will become negatively-tilted this afternoon and evening as an associated 90+ kt mid-level jet moves into the lower MS Valley. The result will be rapid intensification of thunderstorms over AR/LA that spread rapidly eastward into portions of IL/KY/TN/MS later today. Low-level wind fields are also expected to intensify rapidly ahead of the line, resulting in very favorable shear profiles for supercells and/or bow/lewp structures along the squall line. Widespread damaging winds are possible across these areas, with the risk of several tornadoes (some strong) as well. As the storms move eastward into central KY/middle TN they will track into a progressively more unfavorable thermodynamic environment. This should result in a slow weakening of the damaging wind threat along the line. However, at least some risk of damaging winds may persist as far east as eastern KY/TN tonight. ...Southern MS/Southwest AL/Western FL Panhandle... The aforementioned squall line will track eastward across MS/LA and into AL by early evening, with a continued risk of widespread damaging winds. Convective intensity may decrease during the evening across northern AL, but greater low-level moisture farther south should allow the storms to remain potentially severe through much of the night. Meanwhile, low-level shear profiles will remain quite strong and capable of tornadoes and damaging wind gusts in the strongest cells.
Watches
https://www.spc.noaa.gov/products/watch/

Mesoscale discussions:
https://www.spc.noaa.gov/products/md/

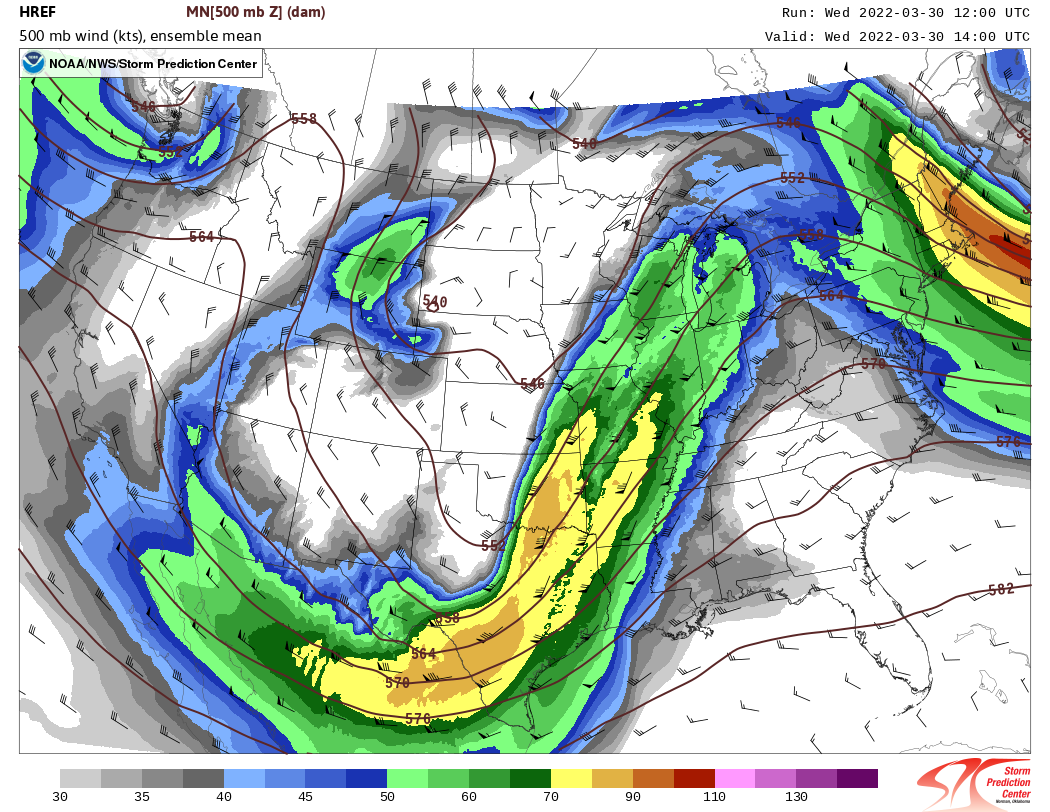
This is what the 500mb map looks like(about the mid point in the atmosphere(not half the distance but half of the mass of the atmosphere)) . Wind speeds are in knots. 5 knots = 6 mph.
This is around 18,000 feet above the surface, over 3.5 miles up.
https://www.spc.noaa.gov/exper/sref/
The speed max approaching the severe storm risk area is what helps to enhance the higher potential of severity and produce rotation/spin for tornadoes.

https://www.spc.noaa.gov/exper/href/
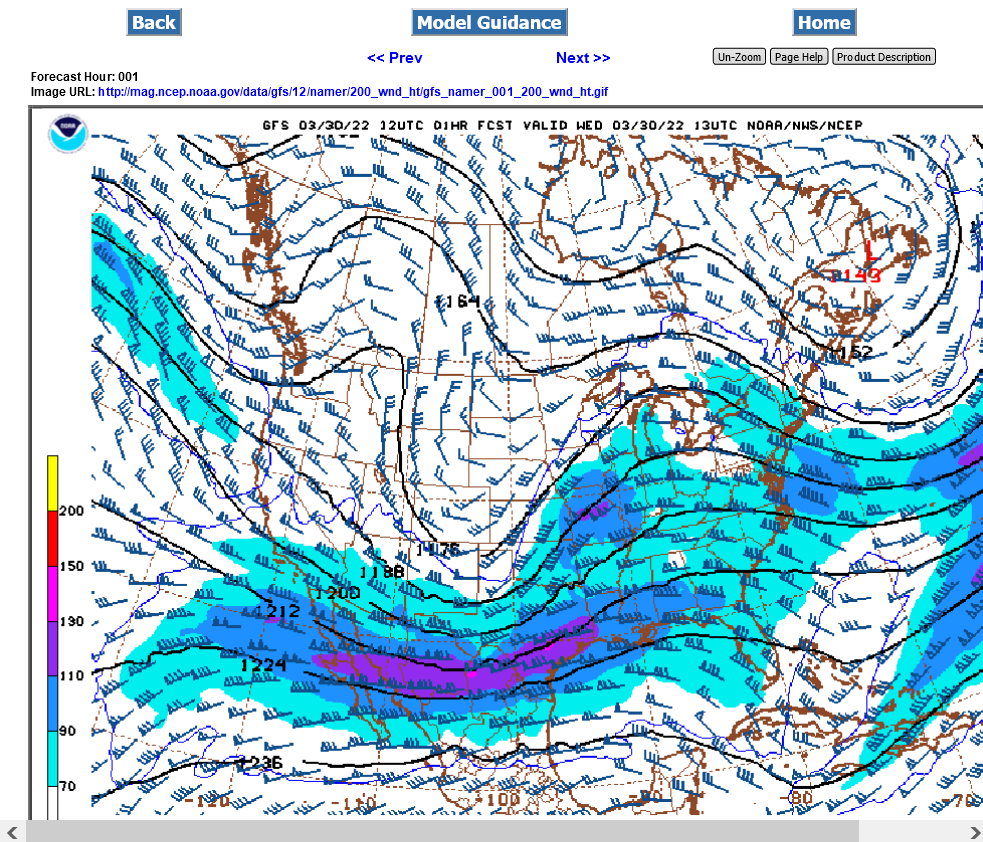
Here's a look at winds a bit higher up, at 200mb and the jet stream level. This is around 39,000 feet up or over 7 miles above the surface. It can range from 35,000 to 41,000 feet above the ground.
The tiny 130 knot speed max's in the pink are over 150 mph. The stronger jet stream to the south is why the risk for tornadoes is higher there(moderate).
the air ahead of and below strong jet streams is lifted and can become very unstable. As that air rises and cools, water vapor condenses out because cooler air has less capacity to hold moisture.
https://mag.ncep.noaa.gov/Image.php
For those that want to learn more about this, I strongly recommend Jeff Haby's tutorials!
https://www.weather.gov/source/zhu/ZHU_Training_Page/winds/JetStream_Stuff/300_200_chart.htm#top
Select A Tutorial Below or Scroll Down

