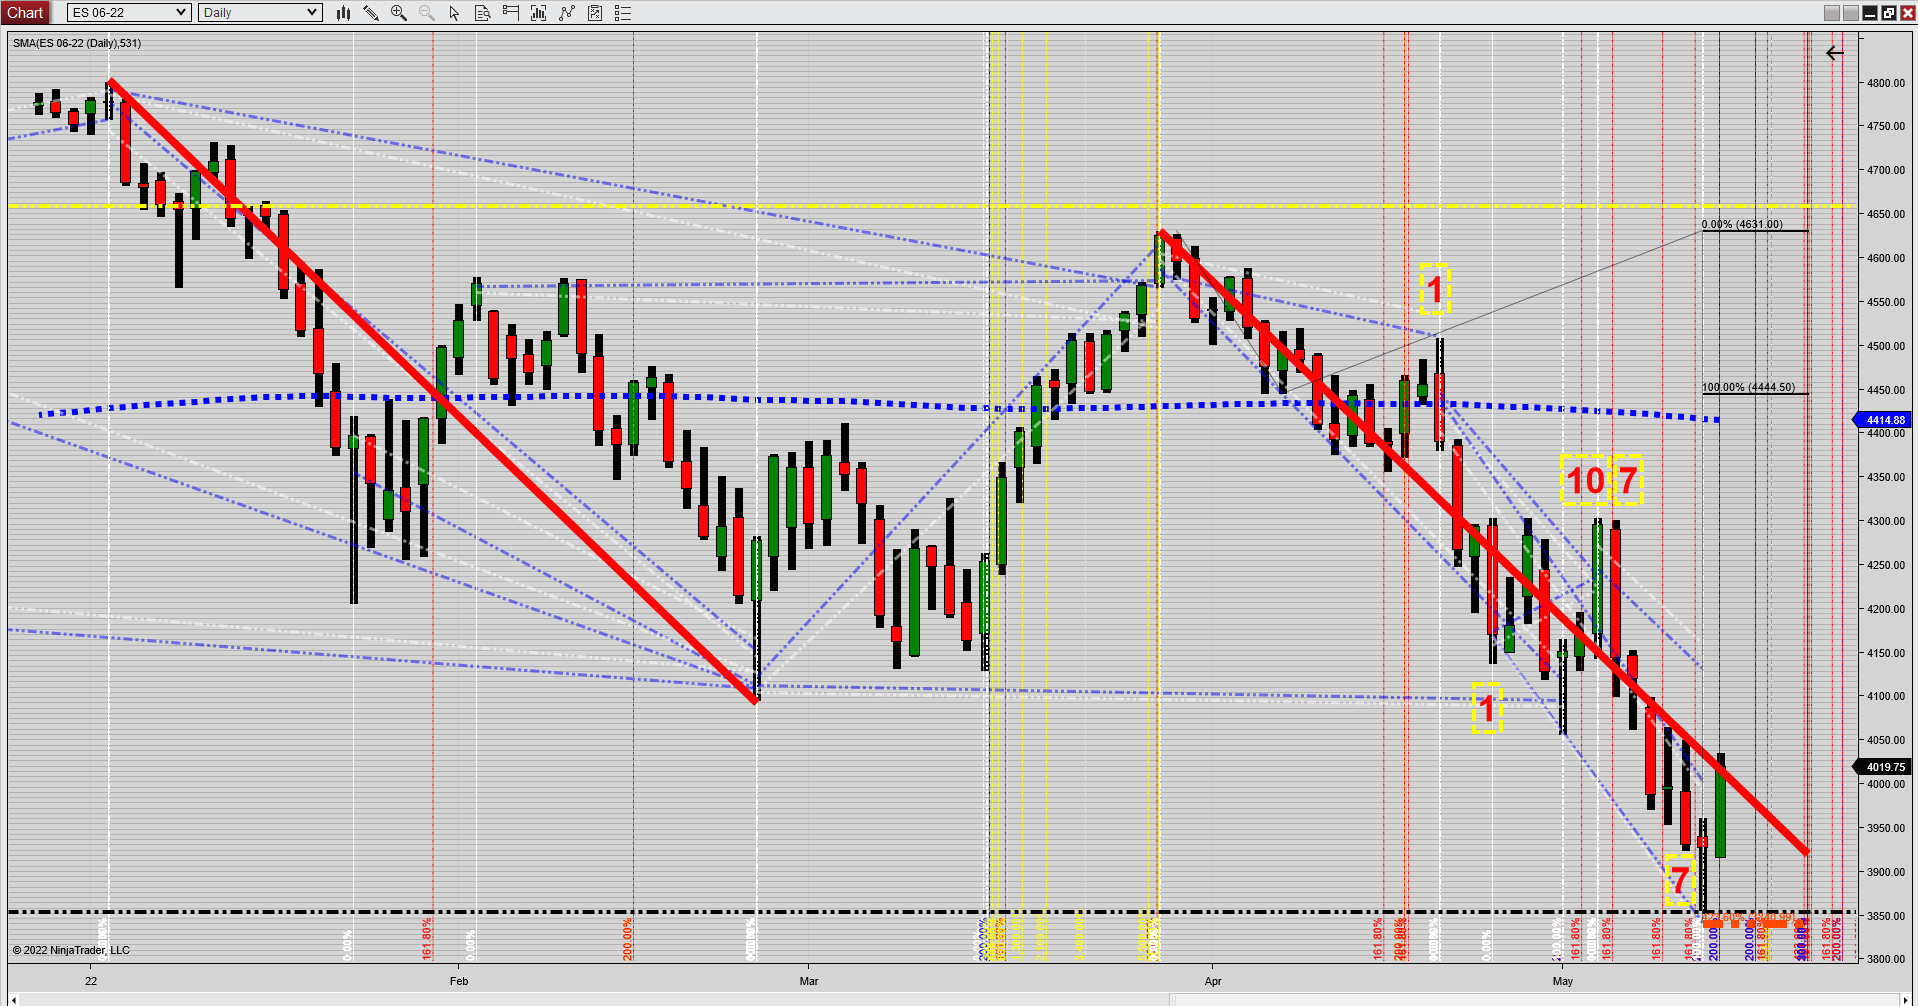
Based on a confluence of time and price levels I'll call a bottom here in the after hours market.
How long will this bottom hold? Nobody knows as of yet, a lot of work to be done to turn the trends back up.
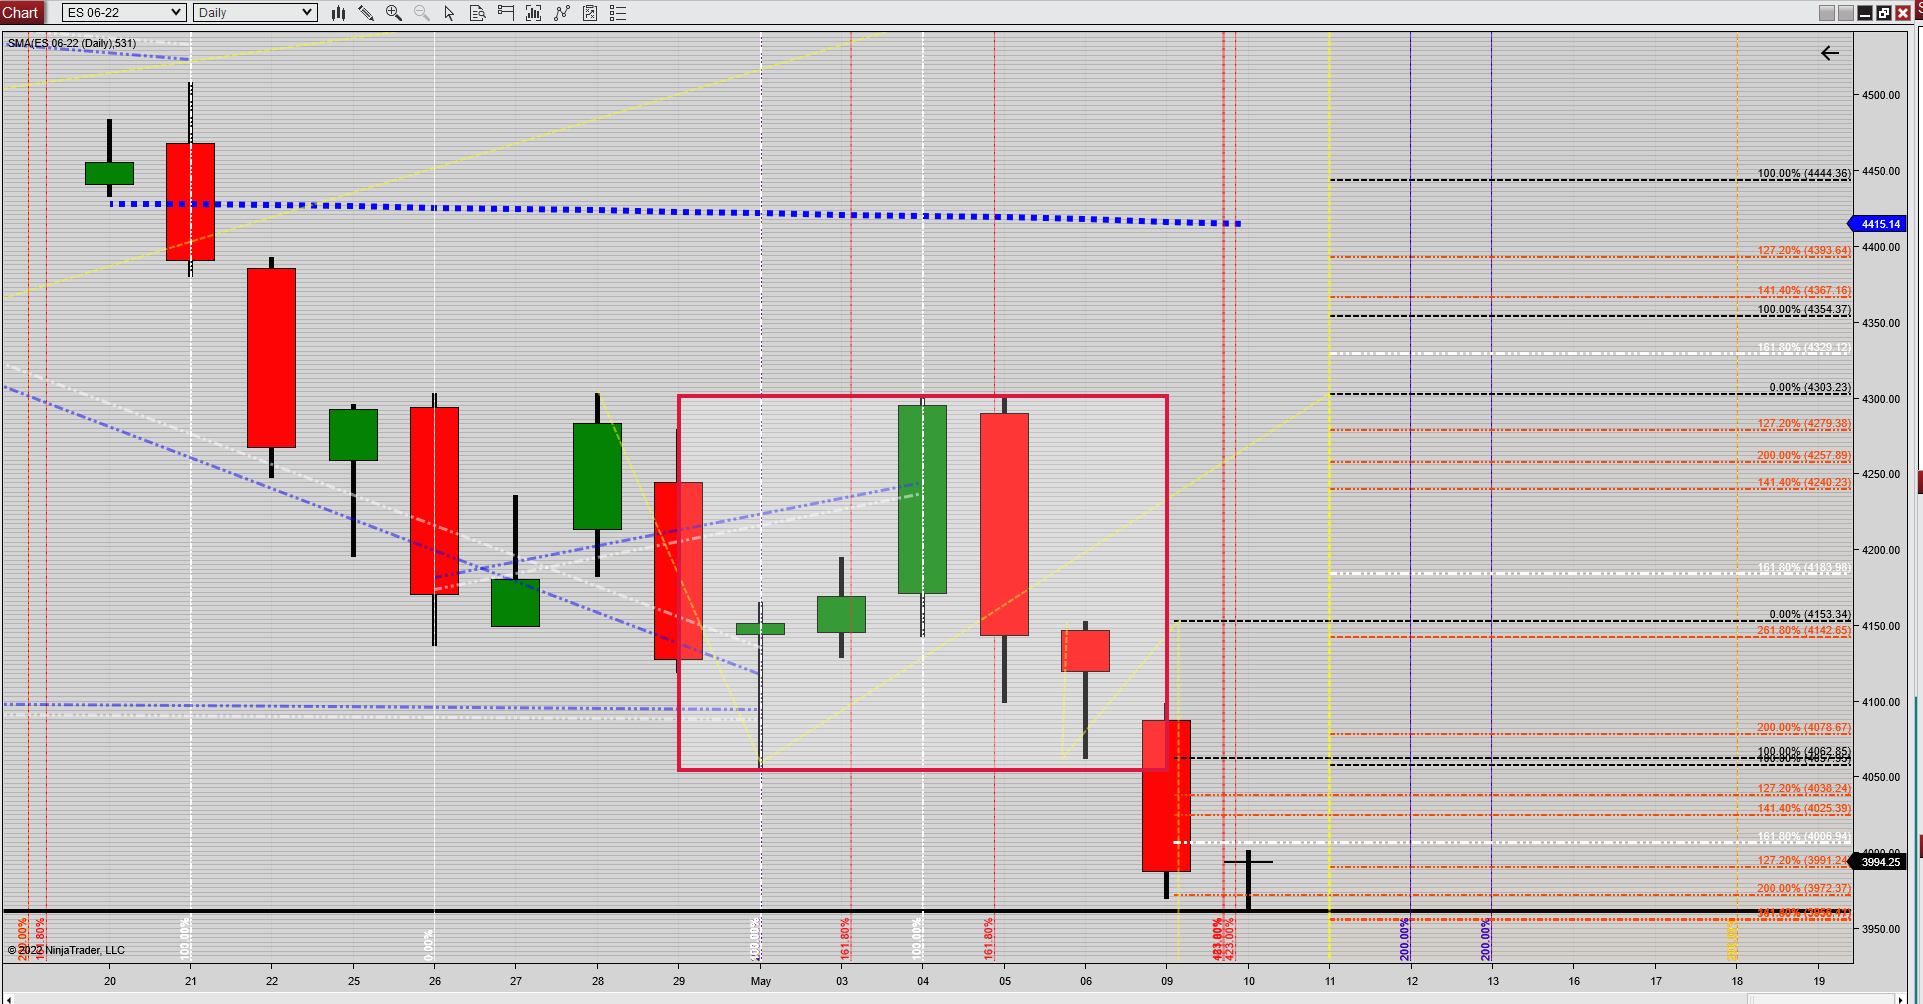
Ideally we'll clear the area I highlighted within the square of the below chart.
Keep in mind also that going up takes a lot longer than going down ....
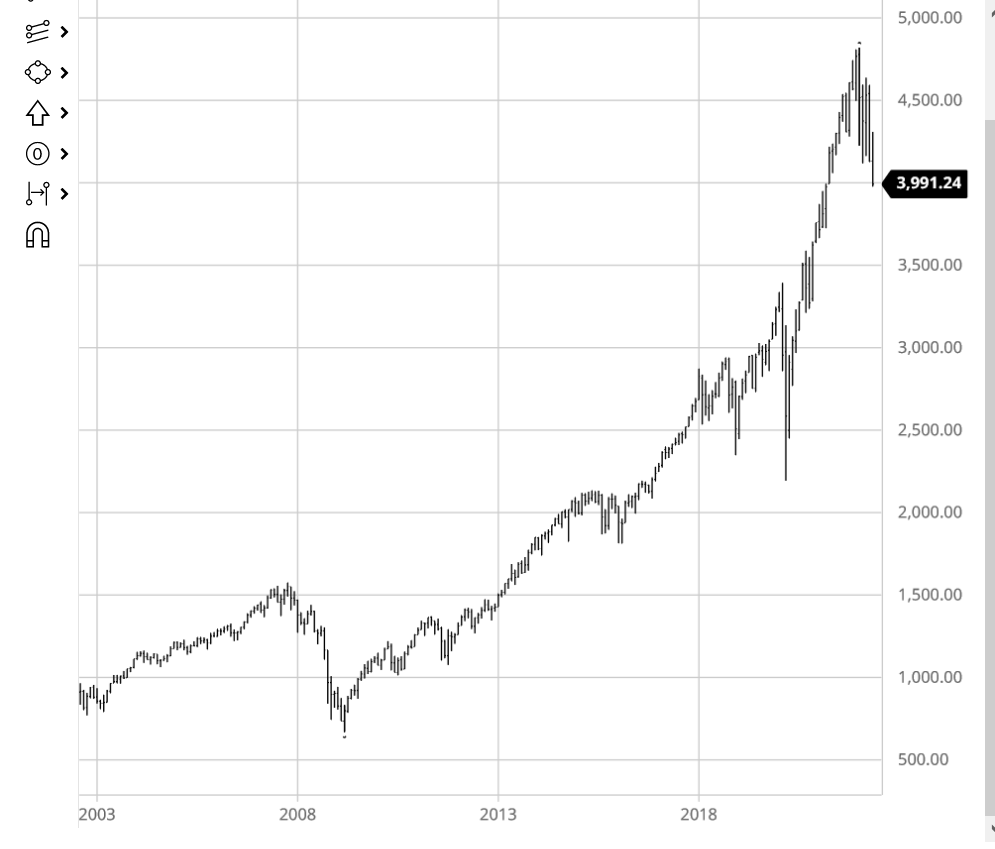
We could bottom short term, but we are going so much lower this year. Before we see new highs, we will see below 3,000 snp
Not giving up on a possible bottom yet, maybe tomorrow ... ?
Again: nobody knows if or when or how long a meaningful bottom will last, ergo: I'm not calling for "the bottom", just some possible long trades in the offing as opposed to the short trades we have been accustomed to for the past six months or so (not complaining about that ...!).
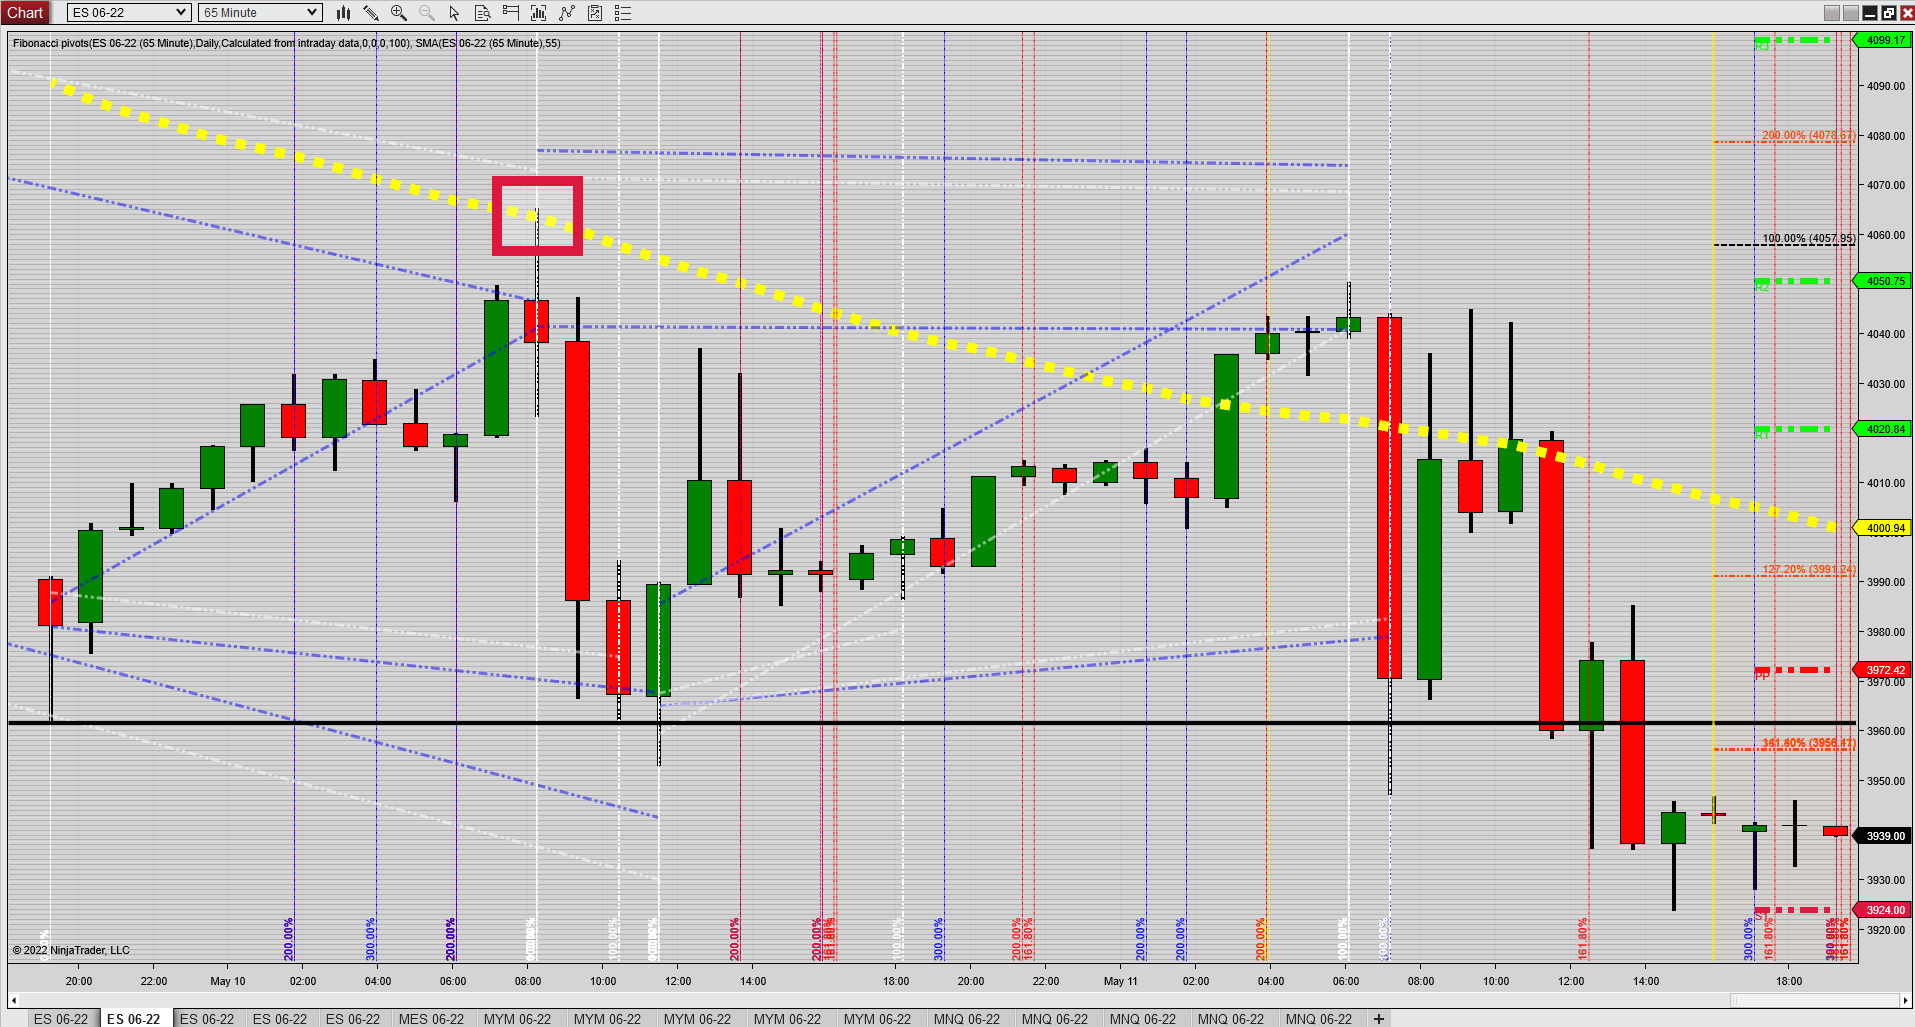
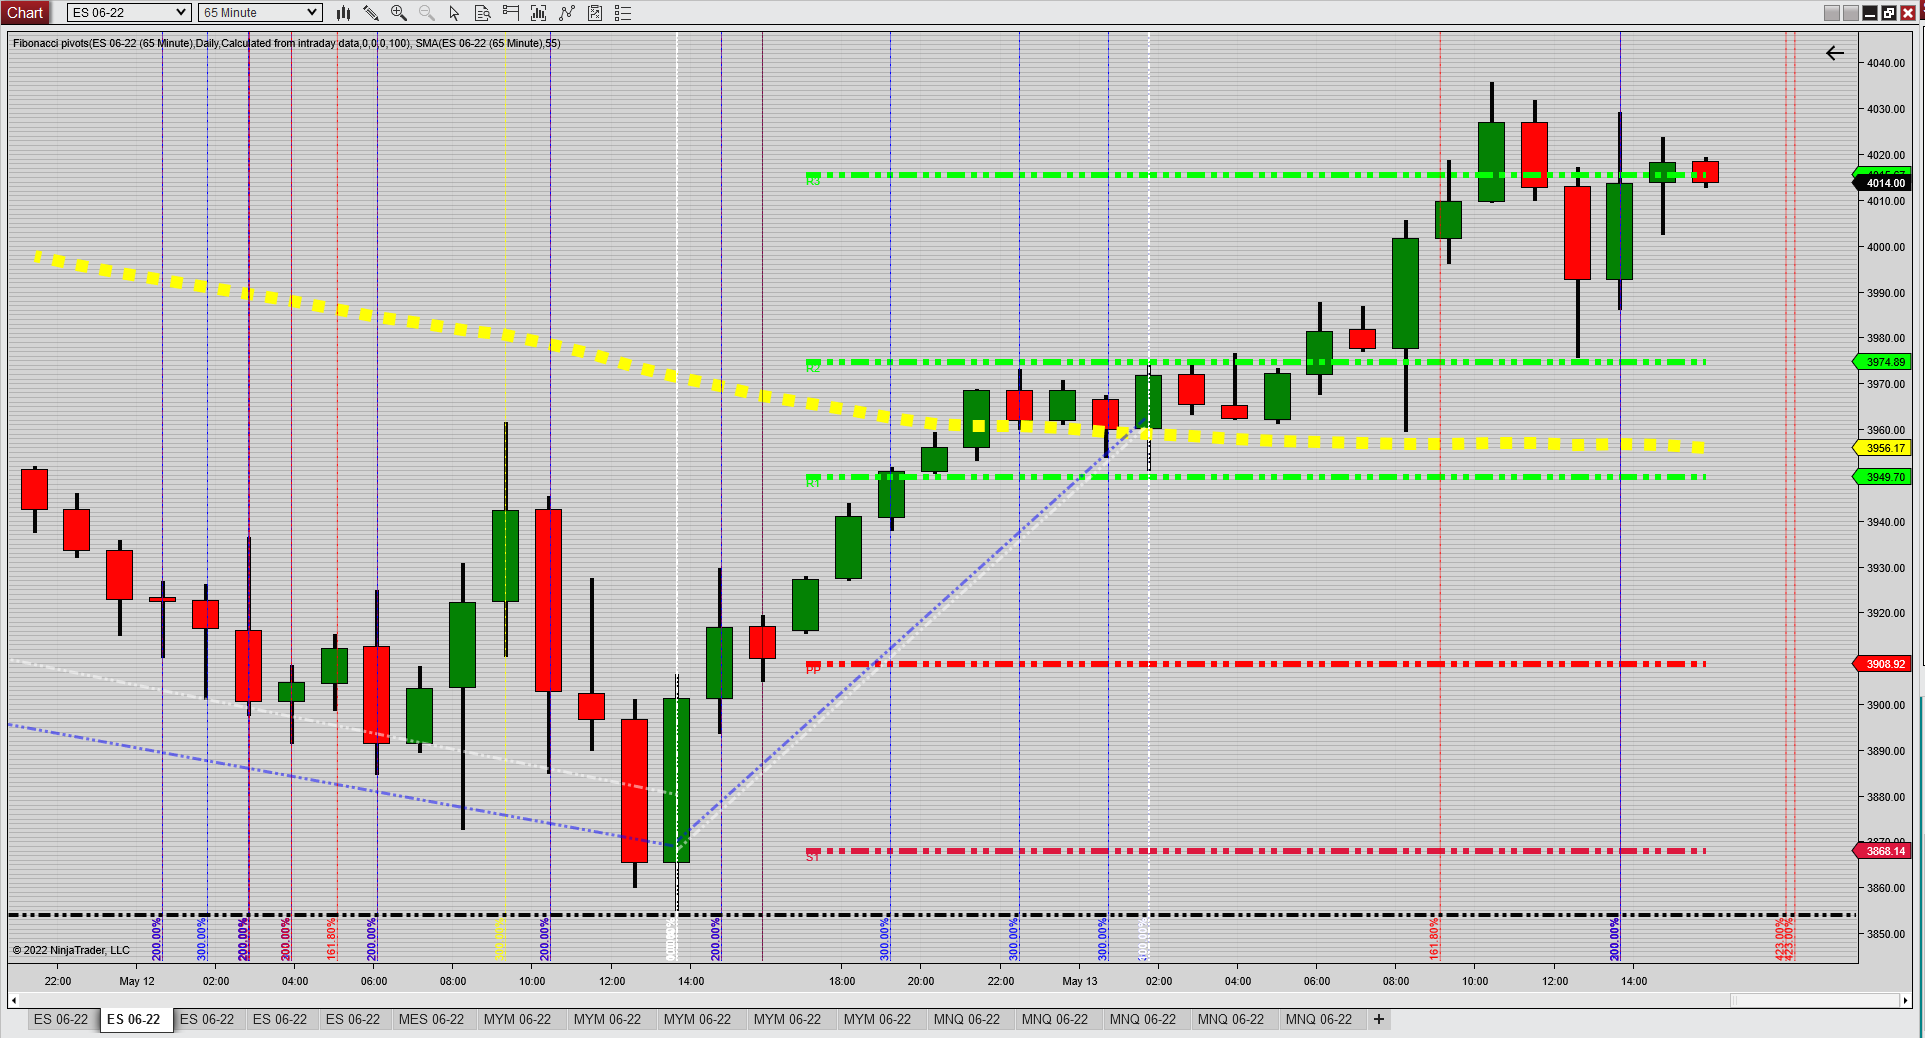
I mentioned on Monday that the trends needed to turn back up, first change would have been the hourly which I define by a 55MA, on Monday, shortly after the open price went right up to the 55MA and was swiftly rejected
(red square on the chart below)
Hmmmm
Thanks
john
The bottom does not come when people are asking the question "Where's the bottom".
And the illusion is that IF one could actually be right about where the bottom was, and IF one were courageous enough to actually commit capital on the long side, how long would such a person actually hold on to that risk? Answer: Not long. This is a comment on human nature, not on the poster of this thread.
I also like looking for such bottoms and tops. The low made in March 2020 was accompanied by a record number of Google searches of "Great Depression". Bingo!
For long term investing (many years), dollar cost averaging/investing a little at a time is a better strategy than trying to pick a bottom imho.
Agreed Wx.
Dollar cost averaging
I don't see signs of true capitulation yet (VIX >>40, plus a major volume spike) that would indicate a major, long-term (as in years) bottom. Having said that, I do believe that this market is toast in the near-term (months), since the Fed is in the process of taking away the punch bowl. But I could be wrong...
"Not giving up on a possible bottom yet, maybe tomorrow ... ?"
That tomorrow was the next day indeed (Thursday) and we did have follow through on Friday.
From an AB=CD (red lines on the chart) perspective it was a close match and I suspect it is close to perfect on the cash chart (haven't checked yet).
Fibonacci lines up again HH = 10 days * .707 = 7 also: LH = 7 days * 0 = 7, longer term May 12 came up as a 1.618 and 200 extension in time.
The hourly trend turned positive and flattened out on Friday providing support (could be tested for sure).
Next week will tell the tale and I'm not discounting a test of a 786 retracement or even a double bottom.
First major resistance = 4068 then 4120
We are still ways away from turning the daily trend up .....
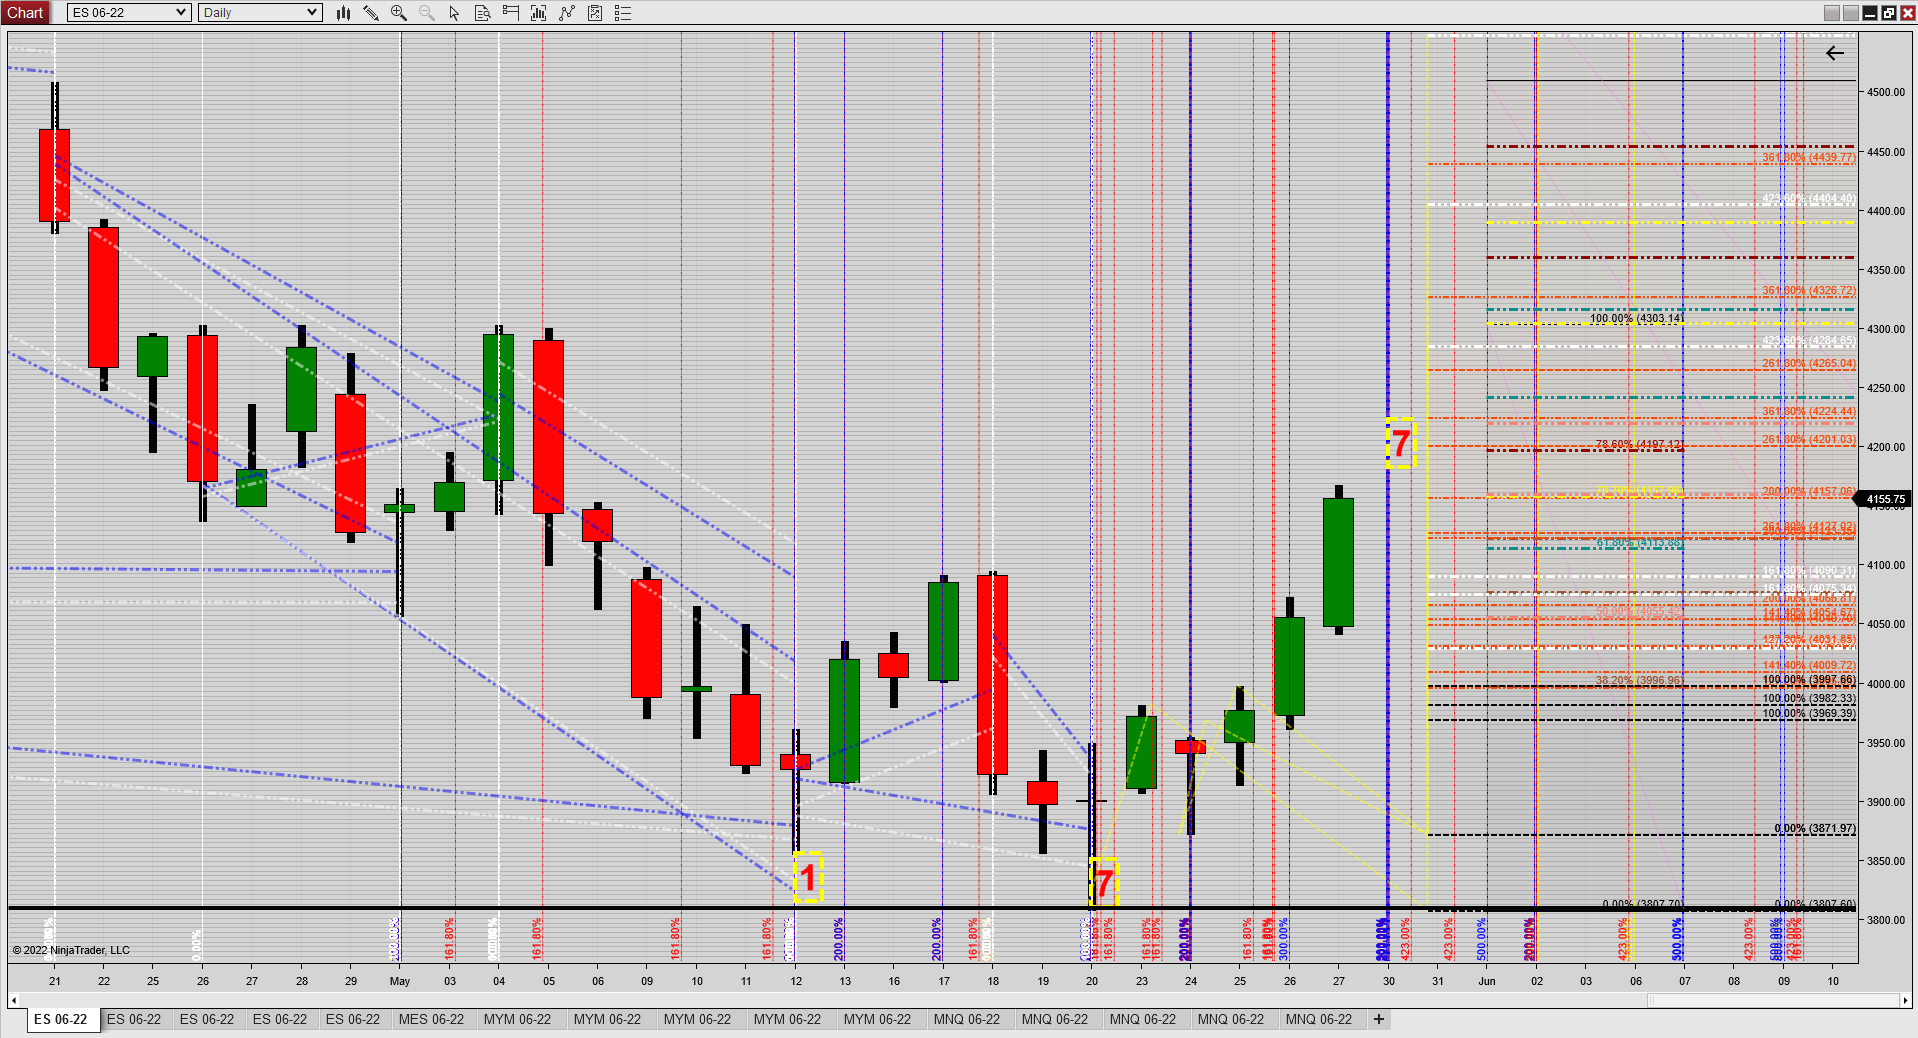
I renew my bottom call based upon the following:
S&P:
from a price perspective we reached 2 fibonacci extensions:
141.4 @ 3801 and 200 @ 3811 (Friday 05/20 low = 3807.5)
from a time perspective we reached 4 fibonacci extensions:
423, 1.618 and 2 @ 200
DJI
from a price perspective we reached the "golden ratio" 1.618 extension @ 30574
(Friday 05/20 low = 30588)
from a time perspective we reached 2 fibonacci extensions @ 200
AB is nearly identical to CD (red lines on the chart)
Wait and see ....
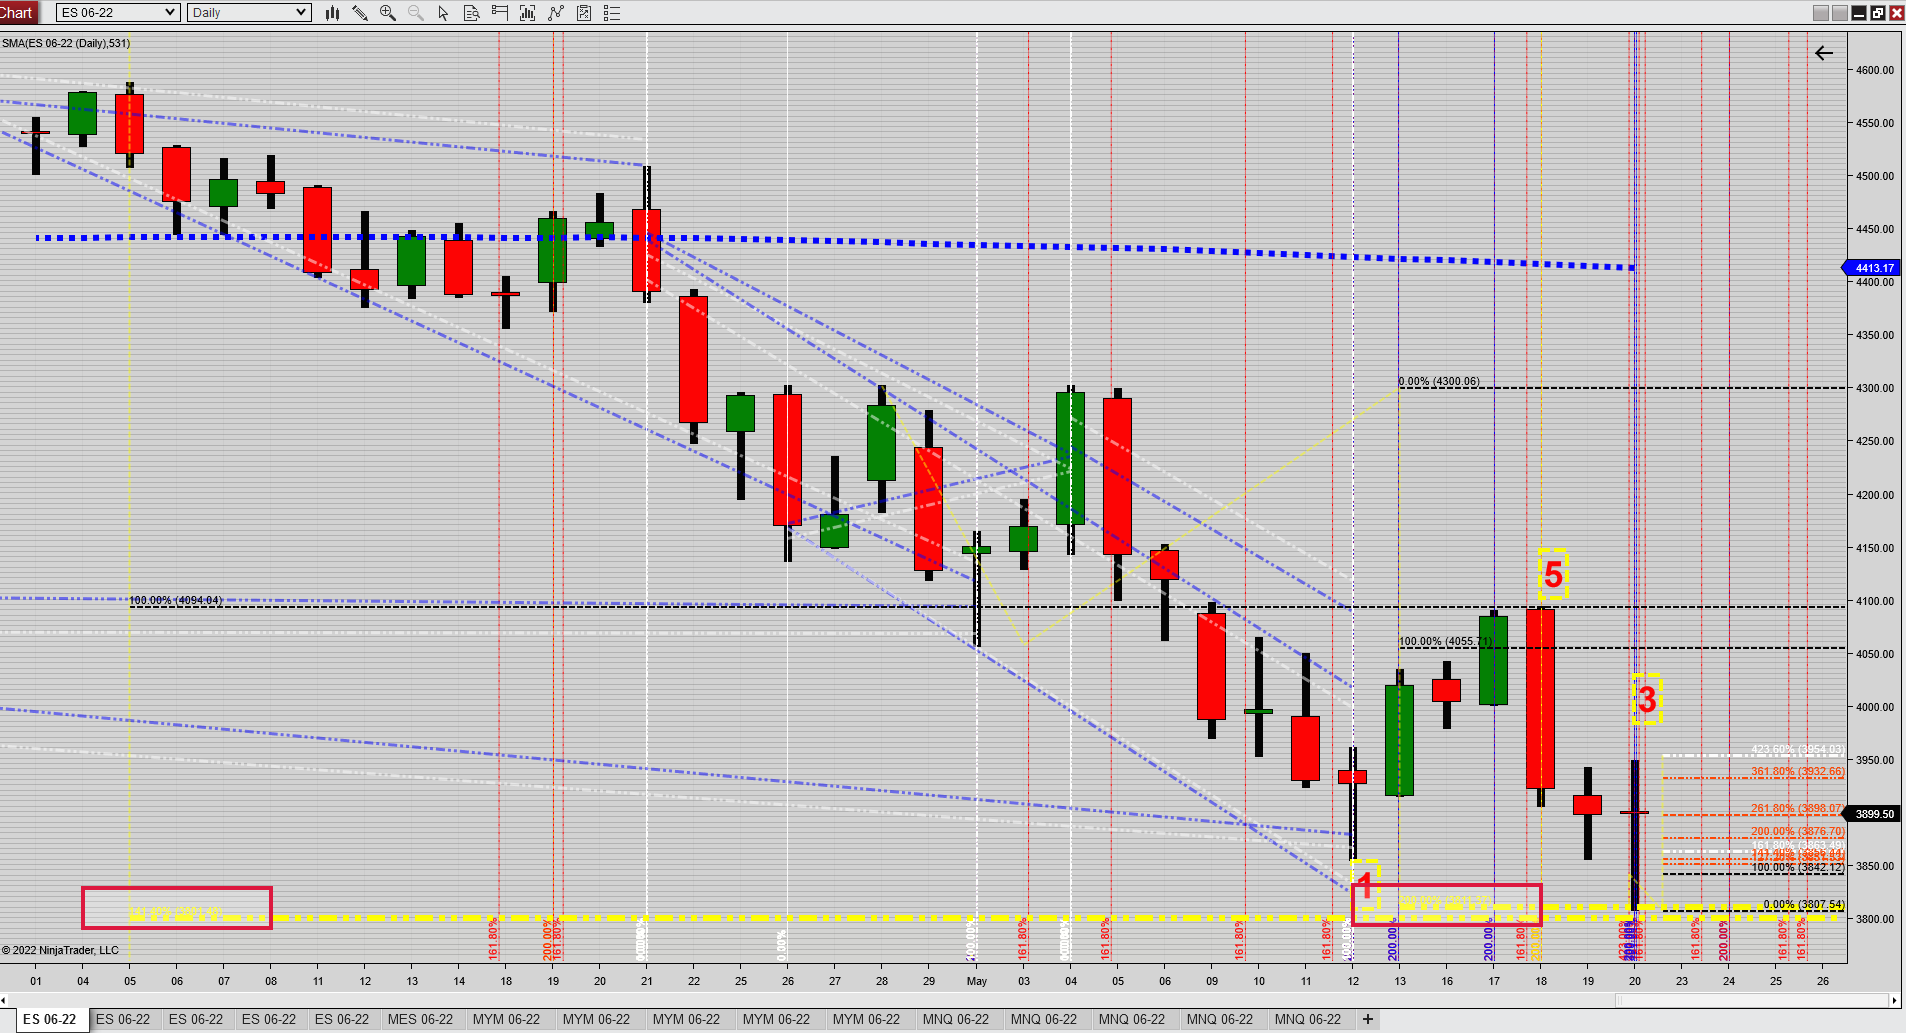

Caveat: if we get daily closes below the 05/20 levels on the big 3 then we're in some serious trouble imho !
S&P first level of resistance coming up @ 3986
Next level of resistance @ 4035
Dow and S&P up a bit more than 2%, NASDAQ is up about 1.81% today
We could see a first reaction to the downside tomorrow (overnight?) from either of the two resistance levels mentioned above.
Trade safe !
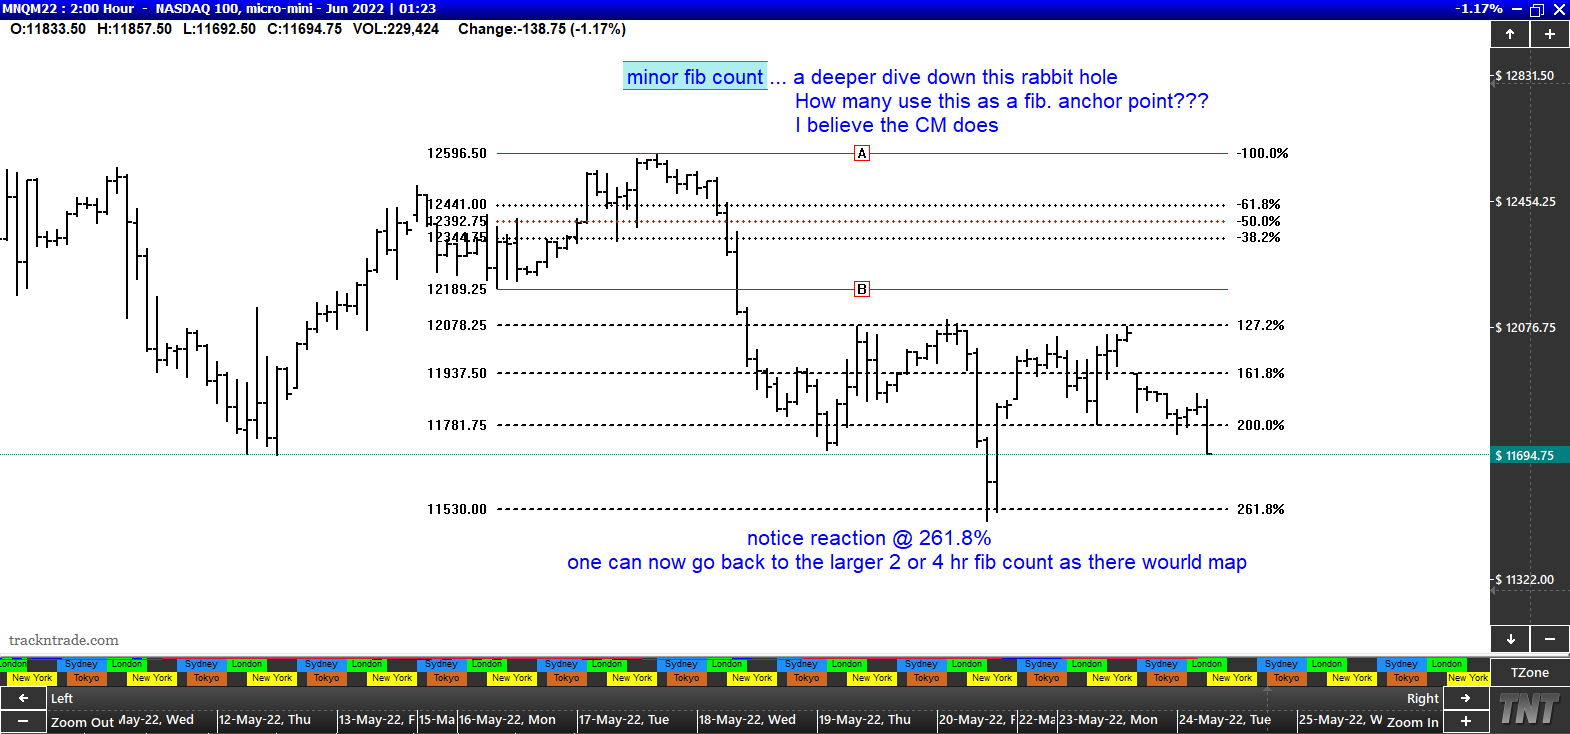
Hi kris,
This may help or completely confuse ya. The NQ market today. Not a typical fib count, notice the reaction @ 261%. I typically use the count as noted in the charts below.
It's like peeling an onion. How deep do ya want to go down this rabbit hole?
It's deep but very rewarding!!
Trade well!!
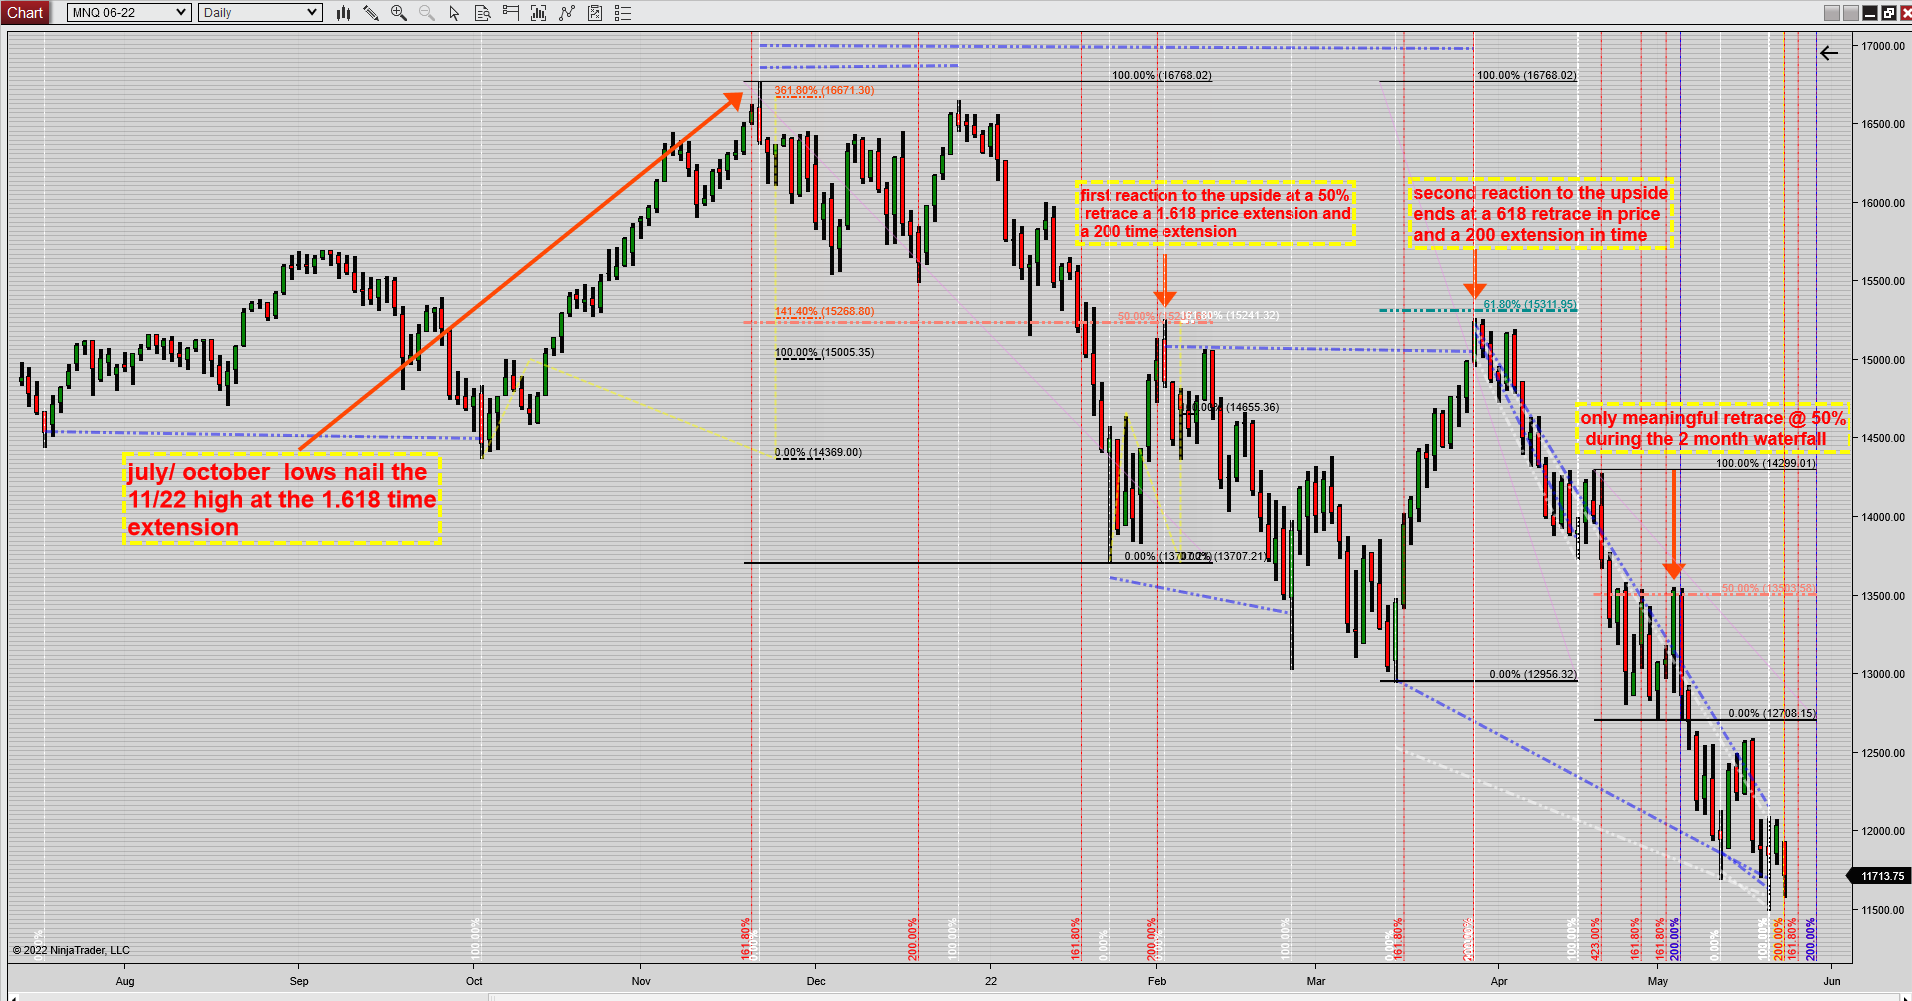
A review of how we got here... A change in trend
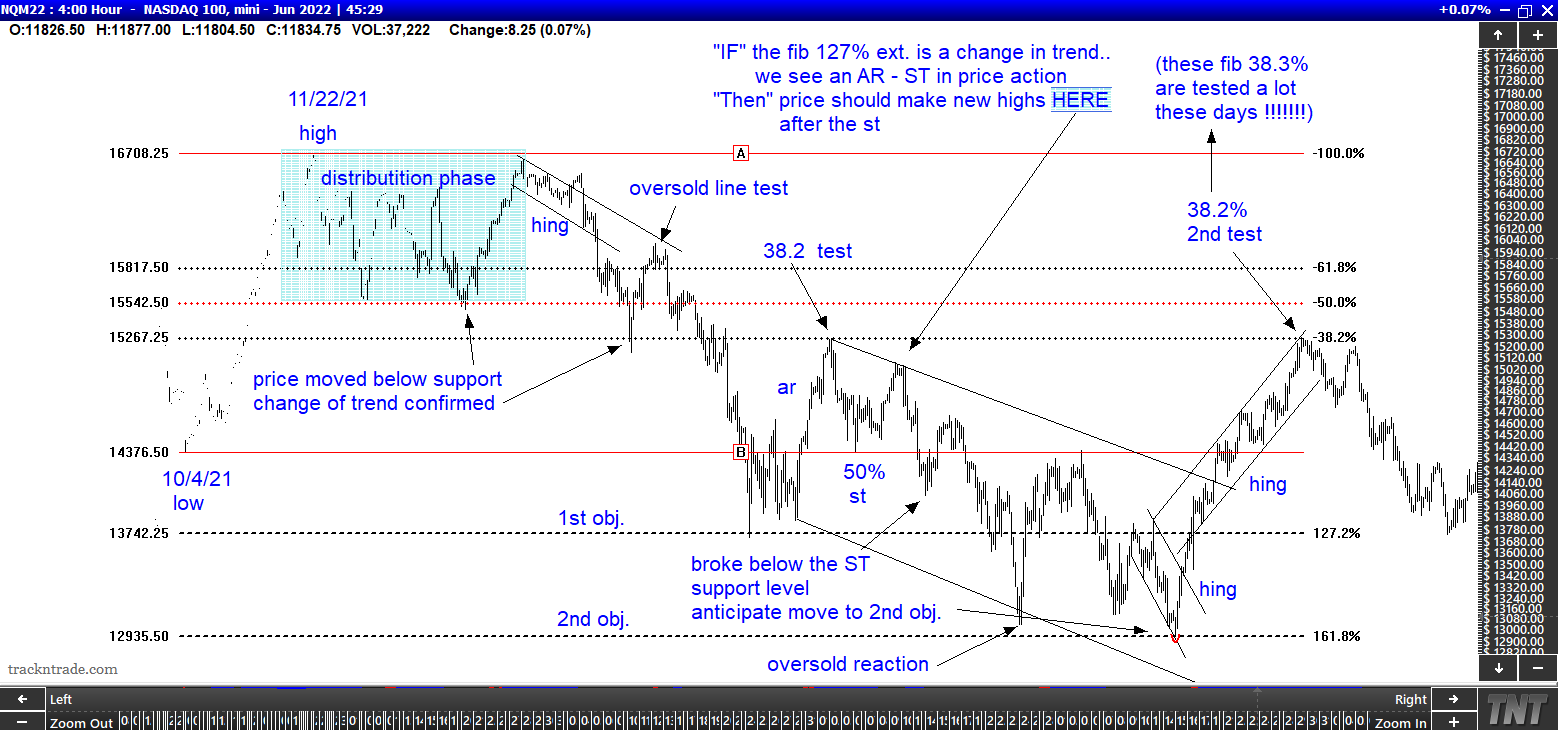
New market fib. count...
When the next JOBS report comes out on Friday in early June, we will see that the JOBS Market is STRONG and the Fed will be raising interest rates by another 0.50% and stocks and stuff will crash into the FED meeting in Mid June. Sell all rallies!
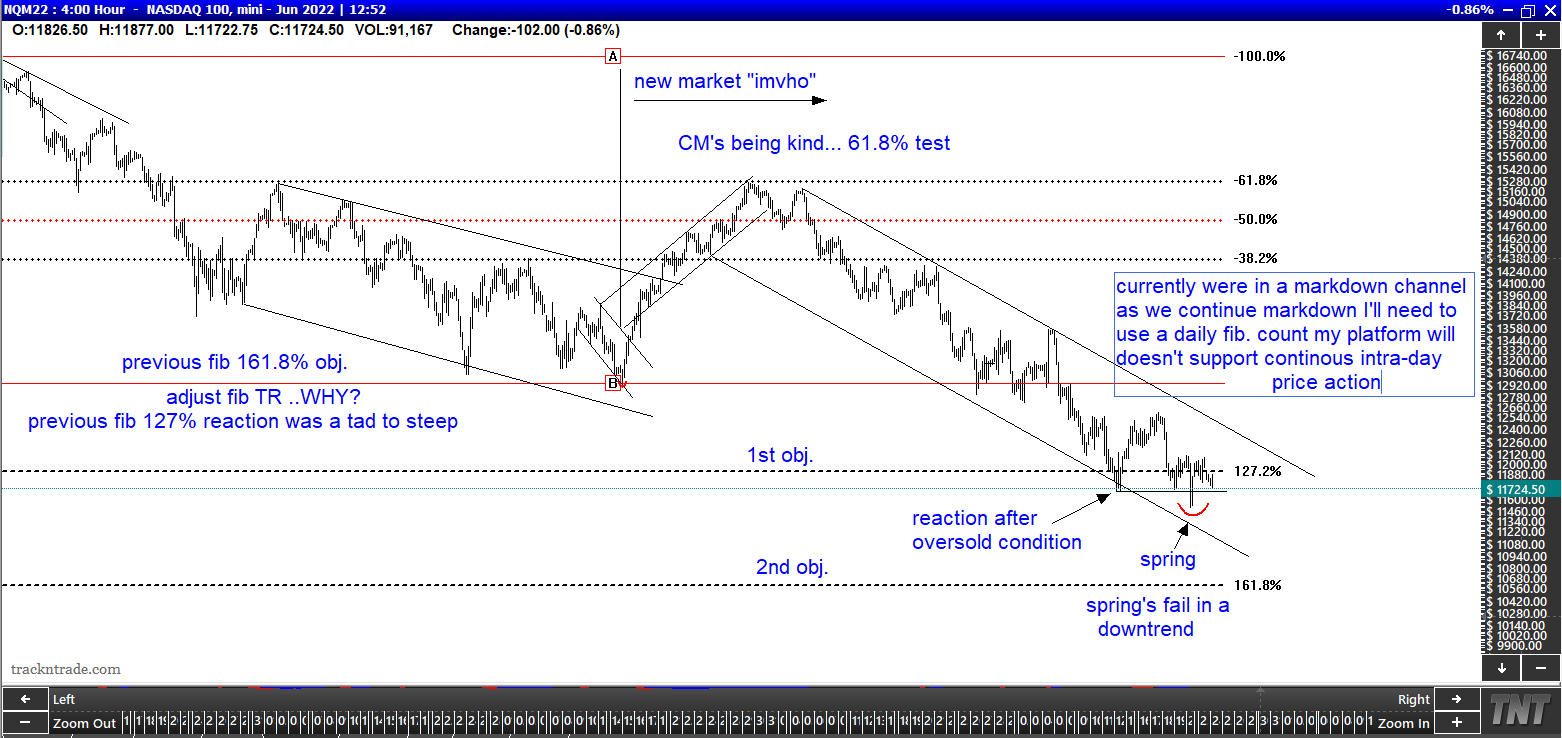
No confusion here and thank you for the insightful charts gedigan, my take on the NASDAQ in the below chart.
Certainly we may not be done with the current 2 month "waterfall" , caution is in order !
Trade safe and be well !
Sell all rallies is still the order of the day Richard, no argument here and yes: June will be a very interesting month!
gedigan(survive/endure),
Extremely impressive analysis, thanks much!
And others making great contributions to this discussion.
I bought a little bit of Apple today with some of the cash I have in an IRA. This is the first individual stock bought in many years and the first time I ever bought Apple. I already own other individual stocks as well as stock mutual funds there and elsewhere.
More a gut feel than anything else, but the market action of the last week or two tells me equities are looking for a bottom, and may have already found it. I fully expect a strong rally before year end, and it may come sooner than later
State Street Investors Confidence metric appears to agree with me as the latest, reported yesterday, showed a 5+% jump.
I have held a lot more cash than usual so far this year. I will be changing that over the next few weeks.
If you add money to the market in June you will be crying in July and August.
Entirely possible Richard, and I have a history of reentering too early. But I am pretty sure I'll be happy by years end.
S&P currently at resistance @4158 and we'll need a close above this level or just plain blow through it to reach the next resistance @ 4200
Monday is a short hours trading day but I expect a reaction to the downside either tomorrow or Tuesday
The Nasdaq has MAJOR resistance at 12940 which is an area I'll watch closely !!!
Much appreciated kris!
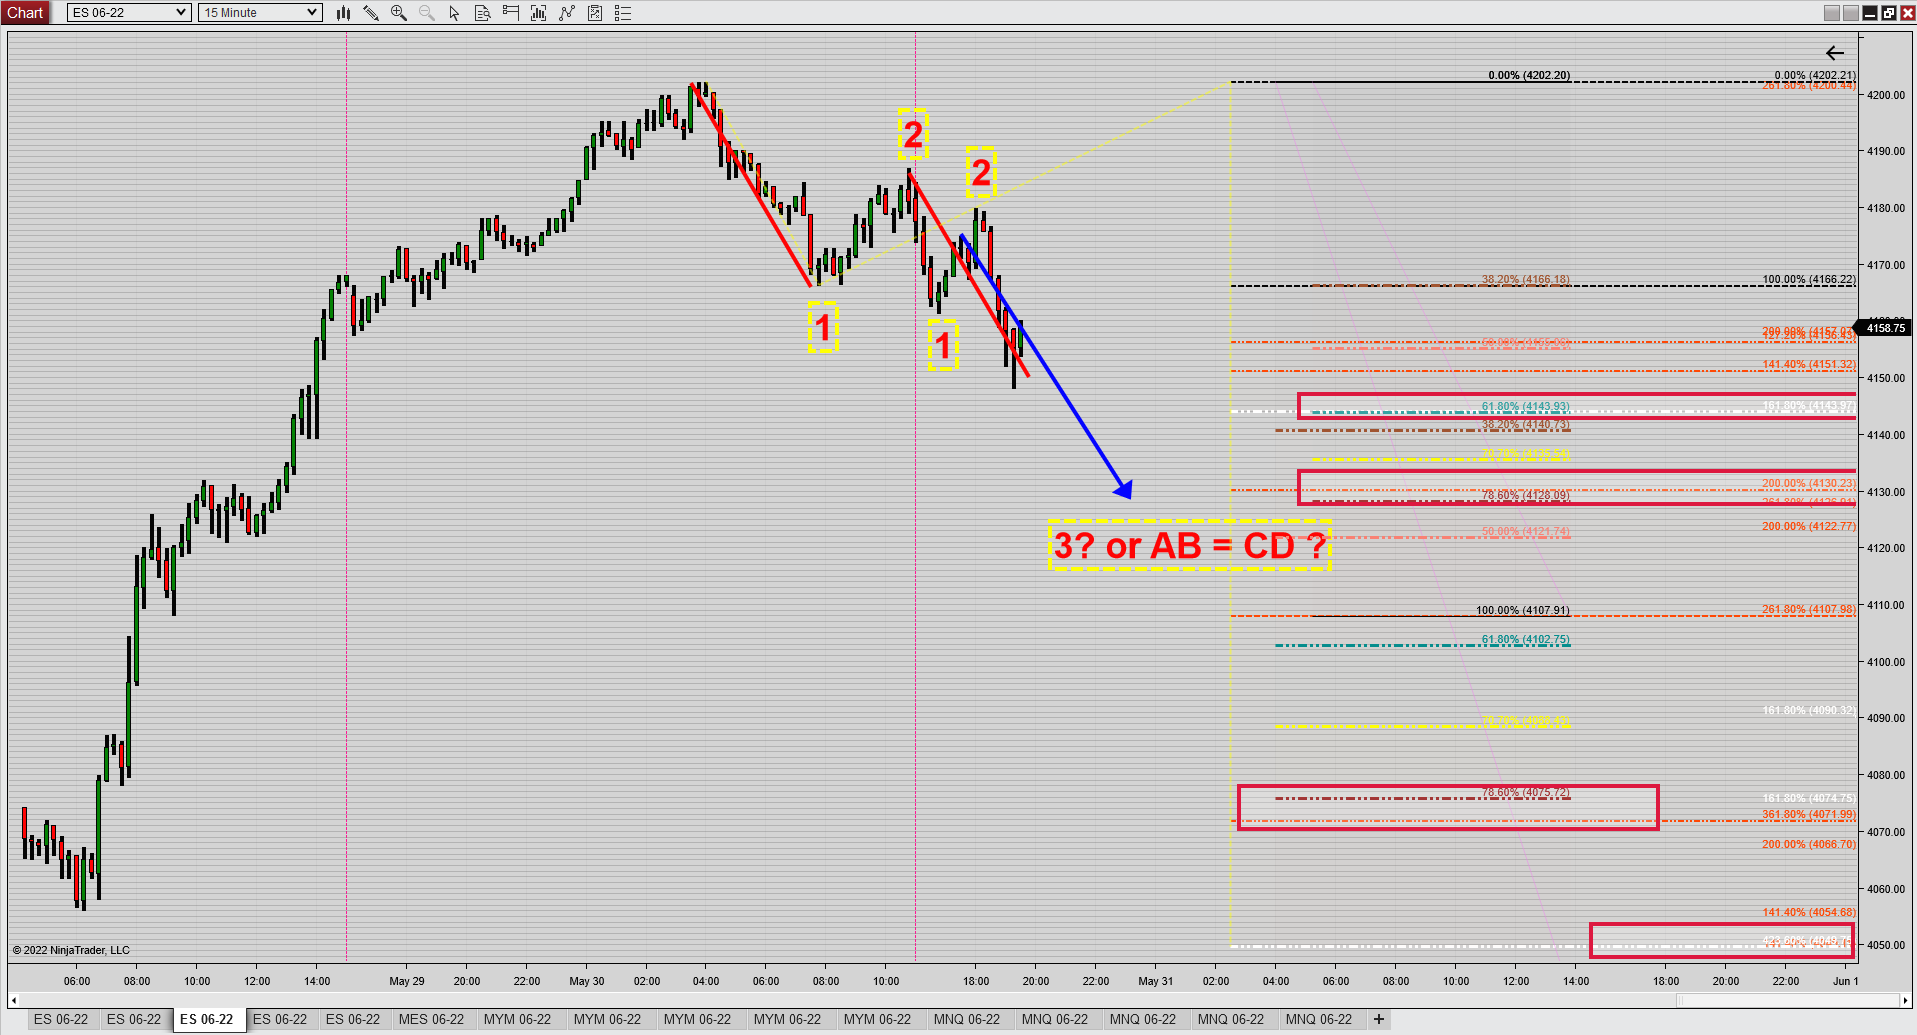
4200 resistance level mentioned in a previous post got "bagged and tagged", now we just wait and see how deep of a retracement we'll get, 15 min chart below showing the possible targets.
The hourly chart shows the pitchfork mid line resistance ... !
Trade safe everybody.

From my previous post the S&P declined from the 4200 resistance level in an unidentified (for me at least) wave structure to the786 retracement level @ 4075, tested that level twice and rose substantially from that level to a 200 ABC price extension high of 4189, chart (15 mins):
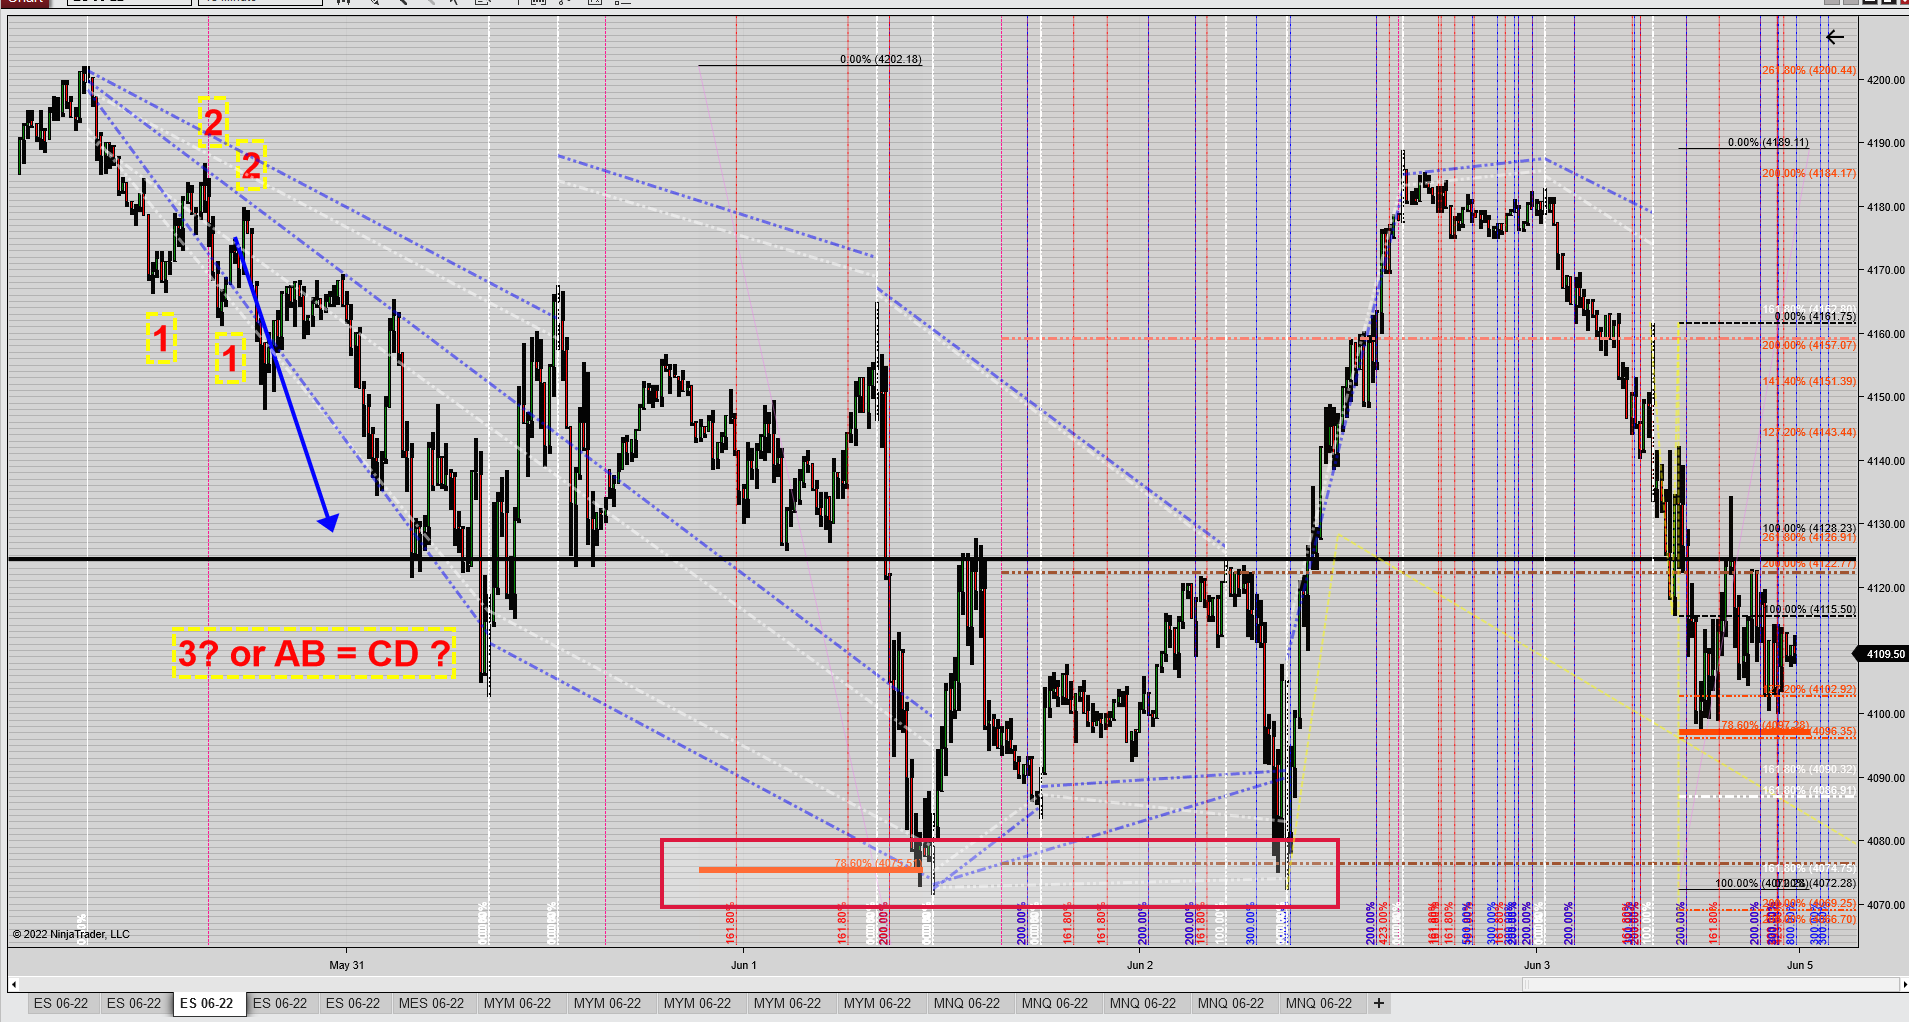
The NASDAQ had risen as well, precisely to the major resistance @ 12940 I mentioned in a previous post which caused the ensuing waterfall in all three majors, chart (daily):

I mentioned the 786 retracement level on the S&P chart above, the 786 is one of my faves (423 and 1.618 among my top 5). These levels work on any time frame and sometimes to absolute perfection as was the case twice on the DJI today, (remarkable symmetry as well H/L/H = 9 to 9 bars, H/H/L = 12 to 12 bars chart (15 mins):

Overall I see the markets decline more, Tuesday or Wednesday is when I expect the upside to resume (if that comes to pass), no telling yet but the markets will let us know for sure !
Trade safe !
kris,
Thanks so much for sharing your expert views as a trader/skilled analyst!
As long as NQ stays weaker than ES (she's always the leader), my work suggests...
ES - 1,461
NQ - 2,868
Thought a great deal about this overnight. Decided to edit and add the following. I've literally followed/observed this chart for years. Lines you see haven't been altered in all that time.
What I find interesting... last month, support was found at fib. ext. 261% and managed to close upper end of the bar. Is it telling us something?
I simply don't know at the moment. Food for thought, huh.
Trade well everyone!!

Great chart Gedigan, much appreciated !
Hey Kris, It looks like you might be a pretty good TA person, so I thought I would make a suggestion for a system that has been around for a very long time and IMHO one of the best ways to read the charts, that is maybe you have already studied/heard of it?
Wycoff Method
Dr. Gary Dayton...He has a website
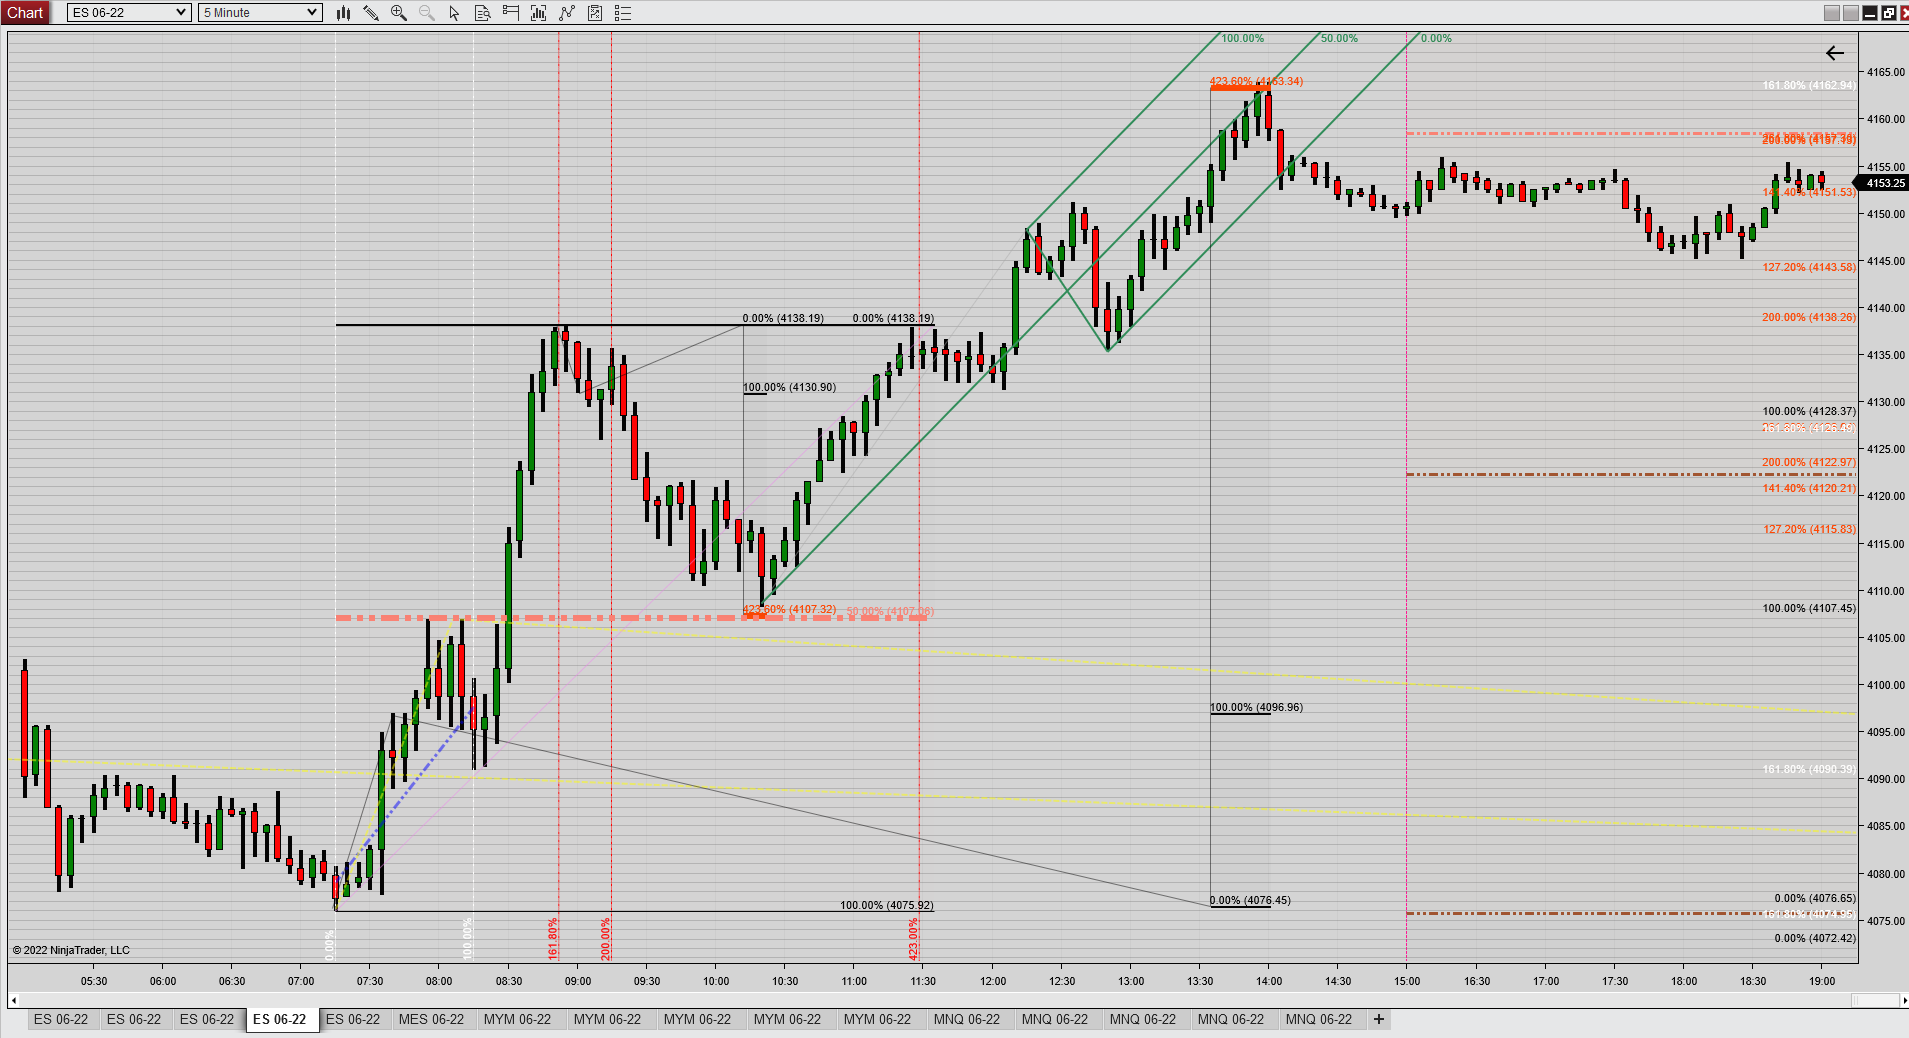
Today's action in the S&P became fairly predictable as I was anticipating a resumption of the uptrend (today or tomorrow) per my previous post. We had a sizeable upthrust right after the open, we retraced down from the L/L/H 1.618 time extension to an ABC 423 low price extension coupled with a 50% retracement of the advance, from there we made a high at the 423 price extension out of the initial ABC low which was the high for the day and 423 proved once again terminal for now.
Major resistance on the DOW @ 33231 which we will need to clear sooner rather than later if the uptrend wants to remain intact.
Major resistance on the NASDAQ @ 13128
S&P will need to clear current resistance @ 4157
May all your trades be profitable !
Hey Kris, It looks like you might be a pretty good TA person, so I thought I would make a suggestion for a system that has been around for a very long time and IMHO one of the best ways to read the charts
"Strength is the fundament(al) of all life.
The one who would like to collect strength must go ON HIS VERY OWN WAY."
Klaus Ferdinand Hempfling
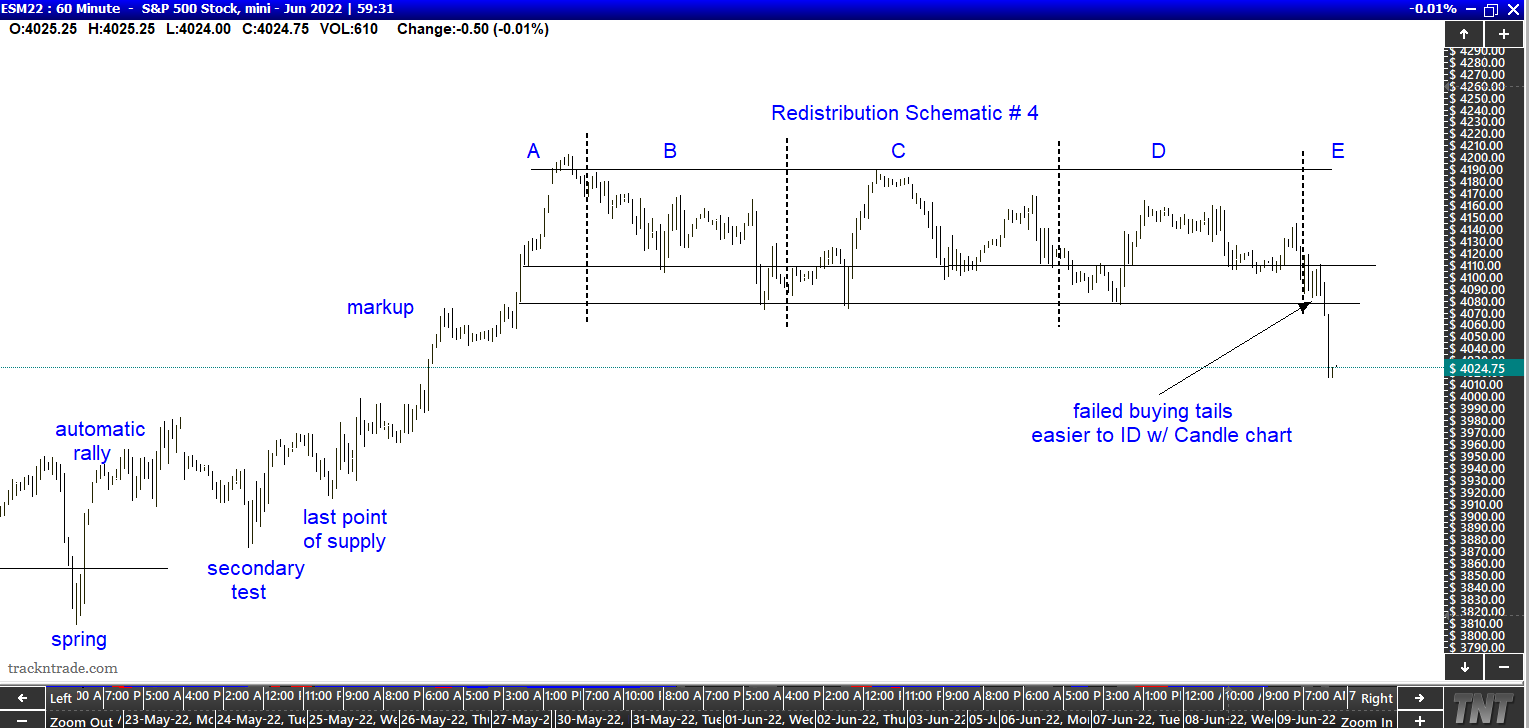
For the Wyckoff students who follow this topic. Do you pay attention to Wyckoff schematics?
The monthly chart I posted a few days ago. Told me I needed to watch for reaccumulation OR redistribution on a lower time frame. Thankfully price action (although not text book) was close enough to the schematic below.

60 min. example...