It's so easy a caveman can do it ... :
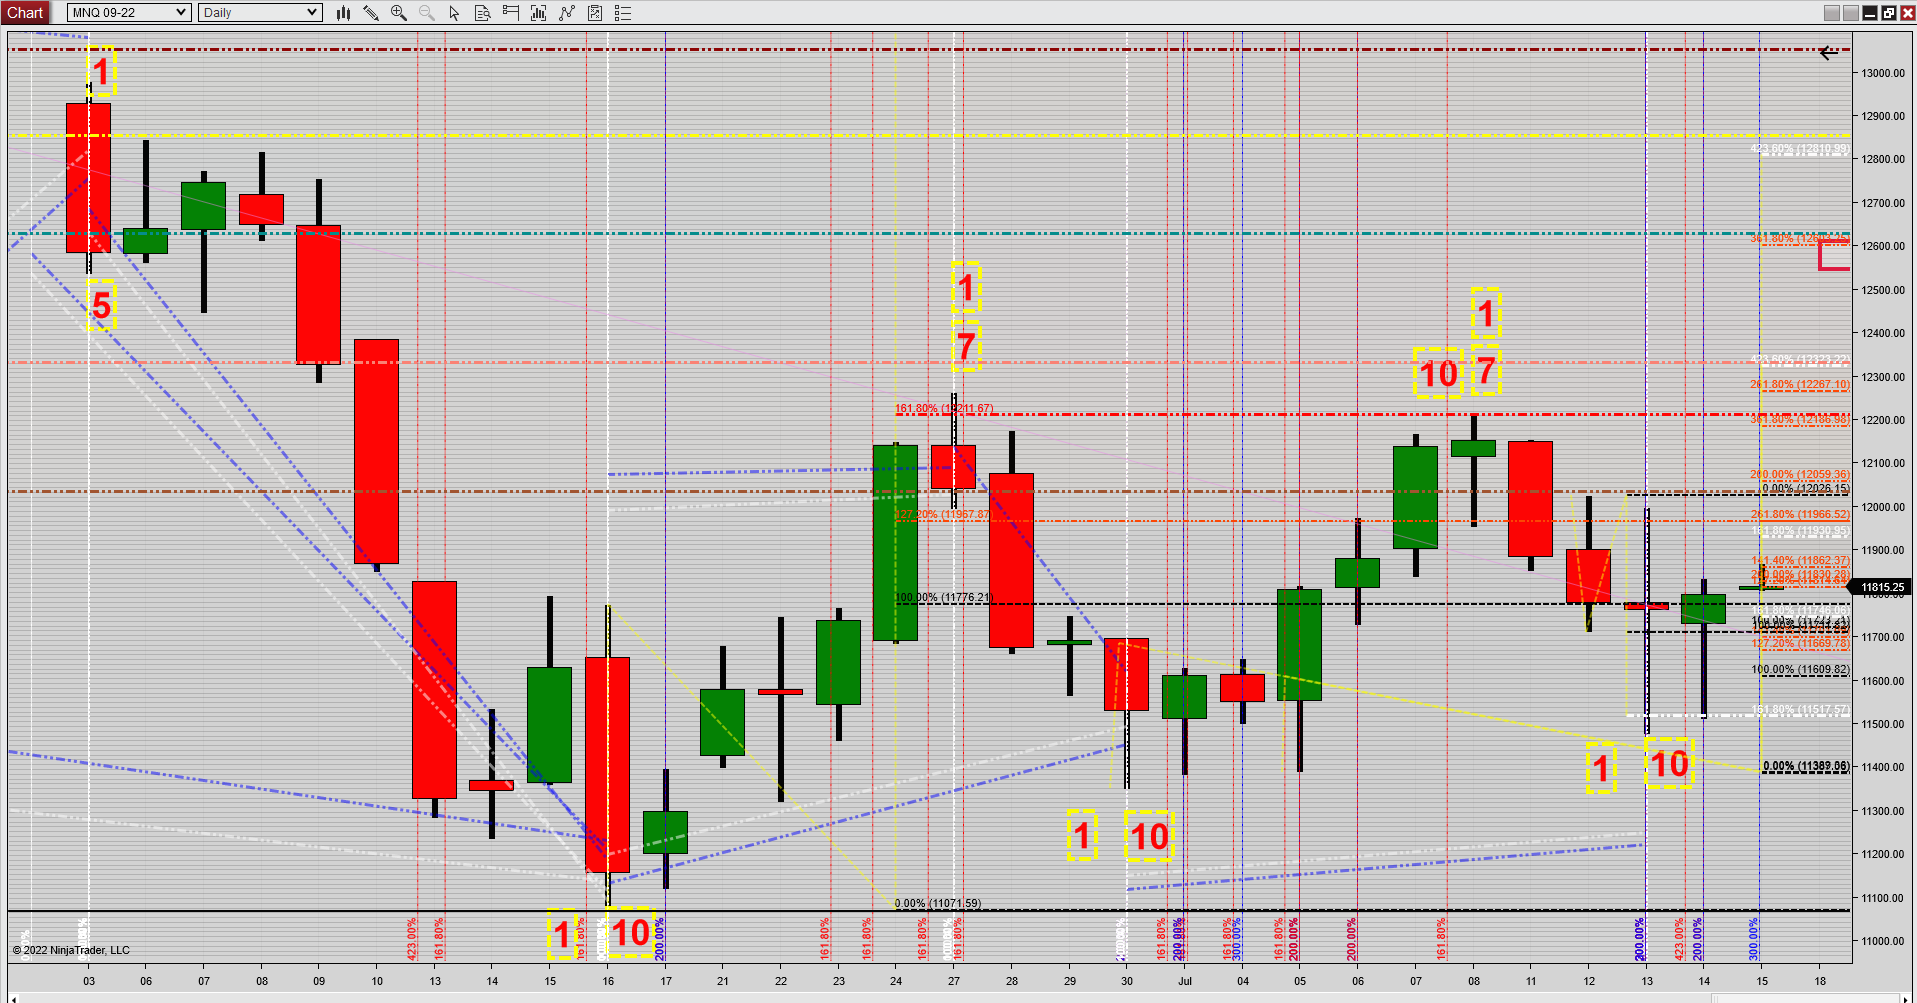
The symmetry in the NAS has been uncanny, will it continue? More on that below.
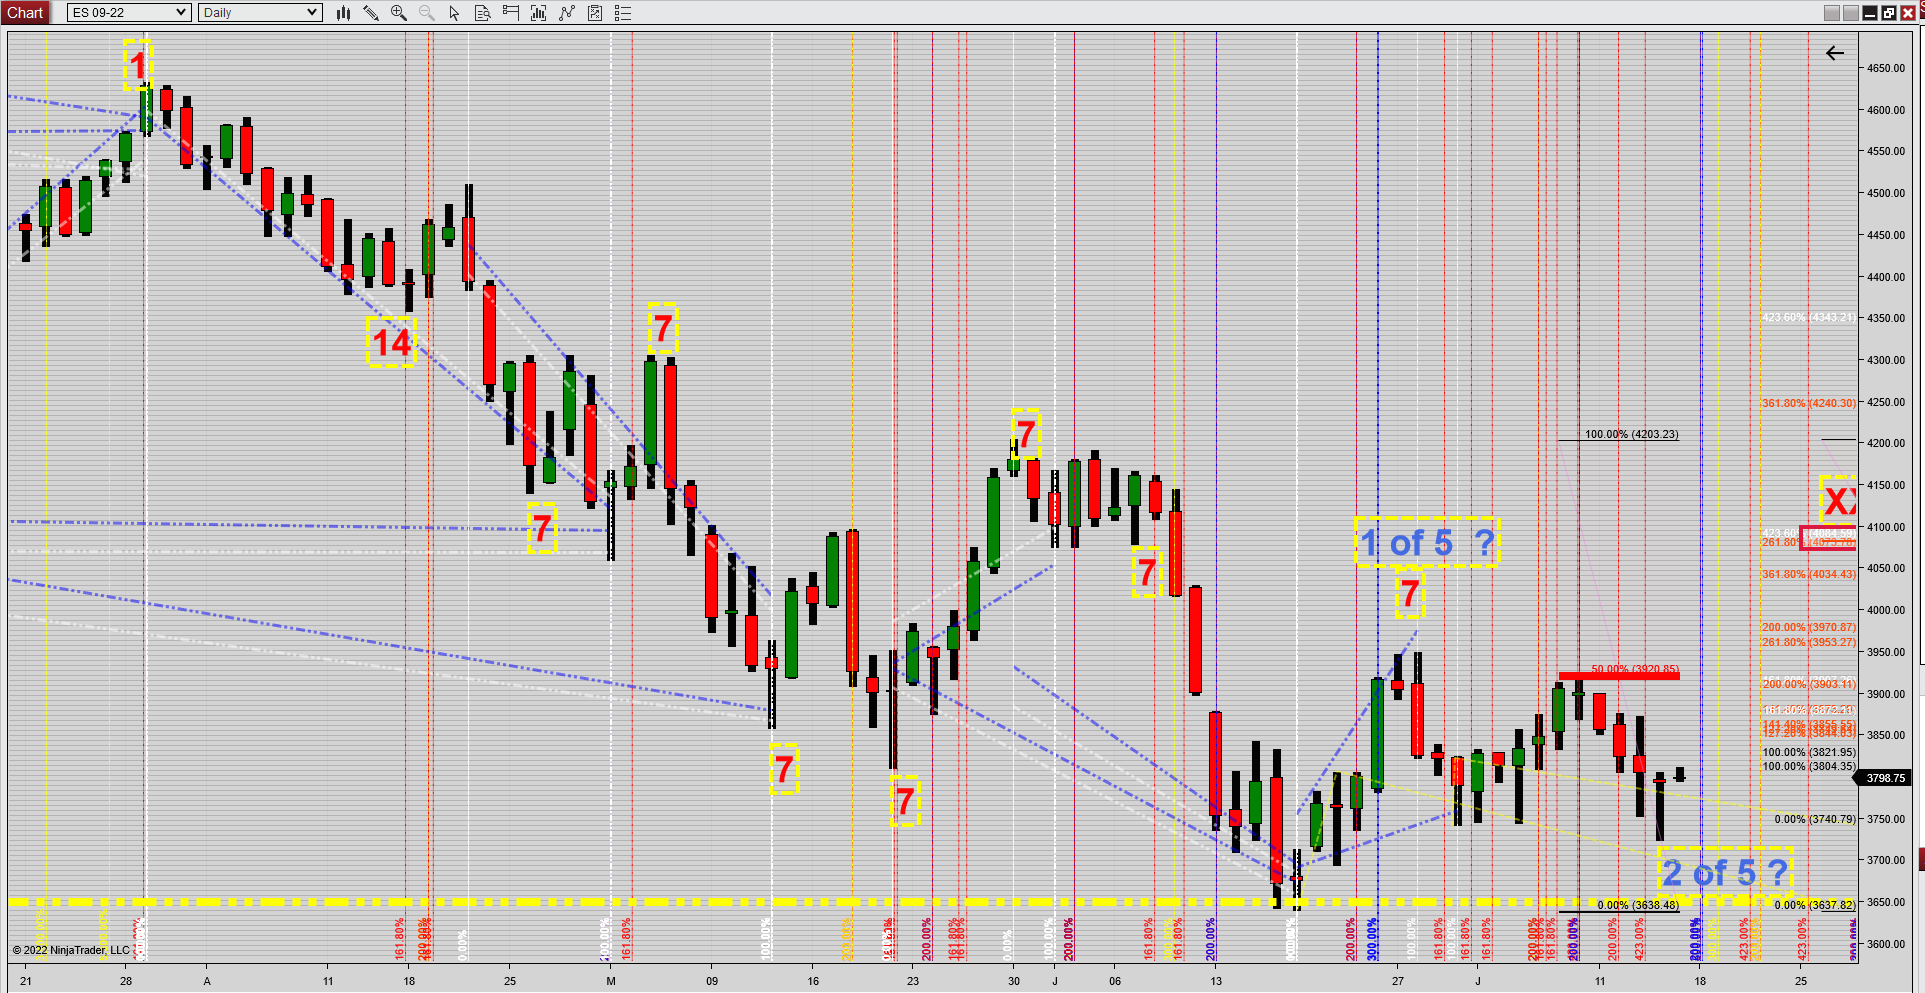
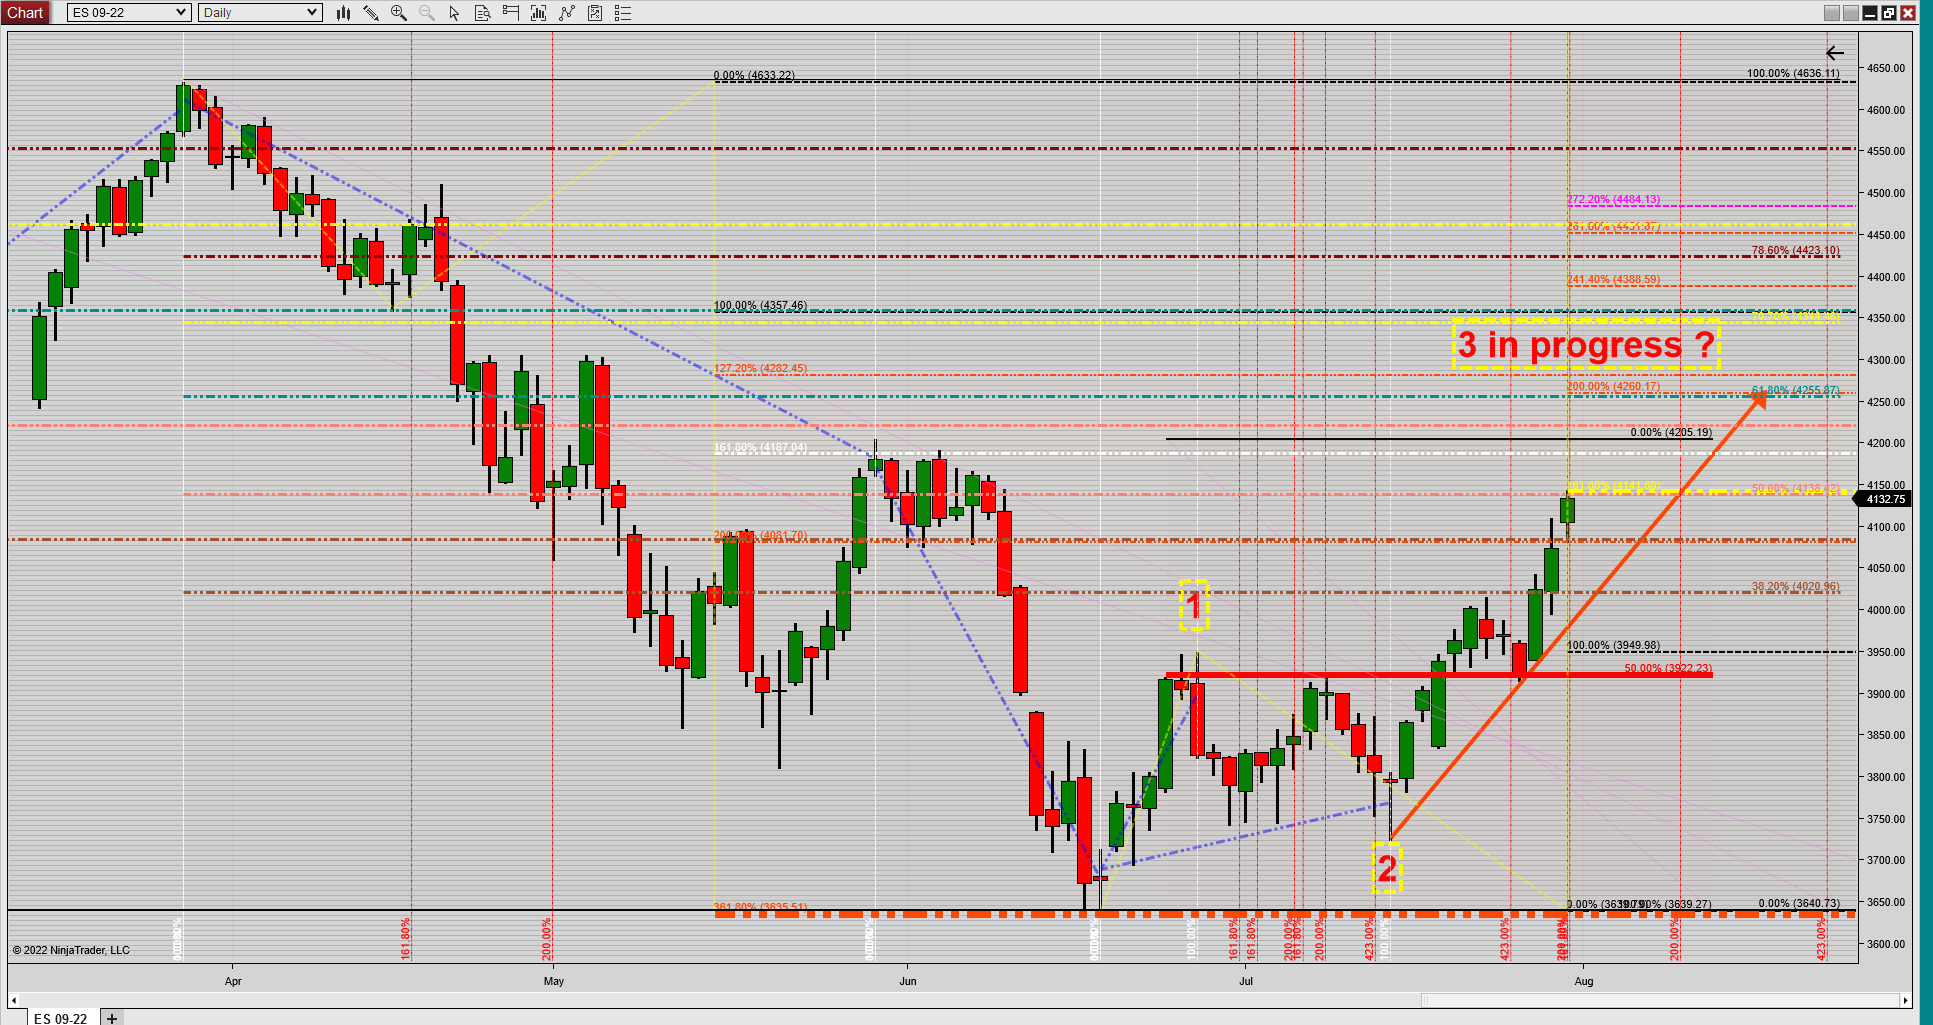
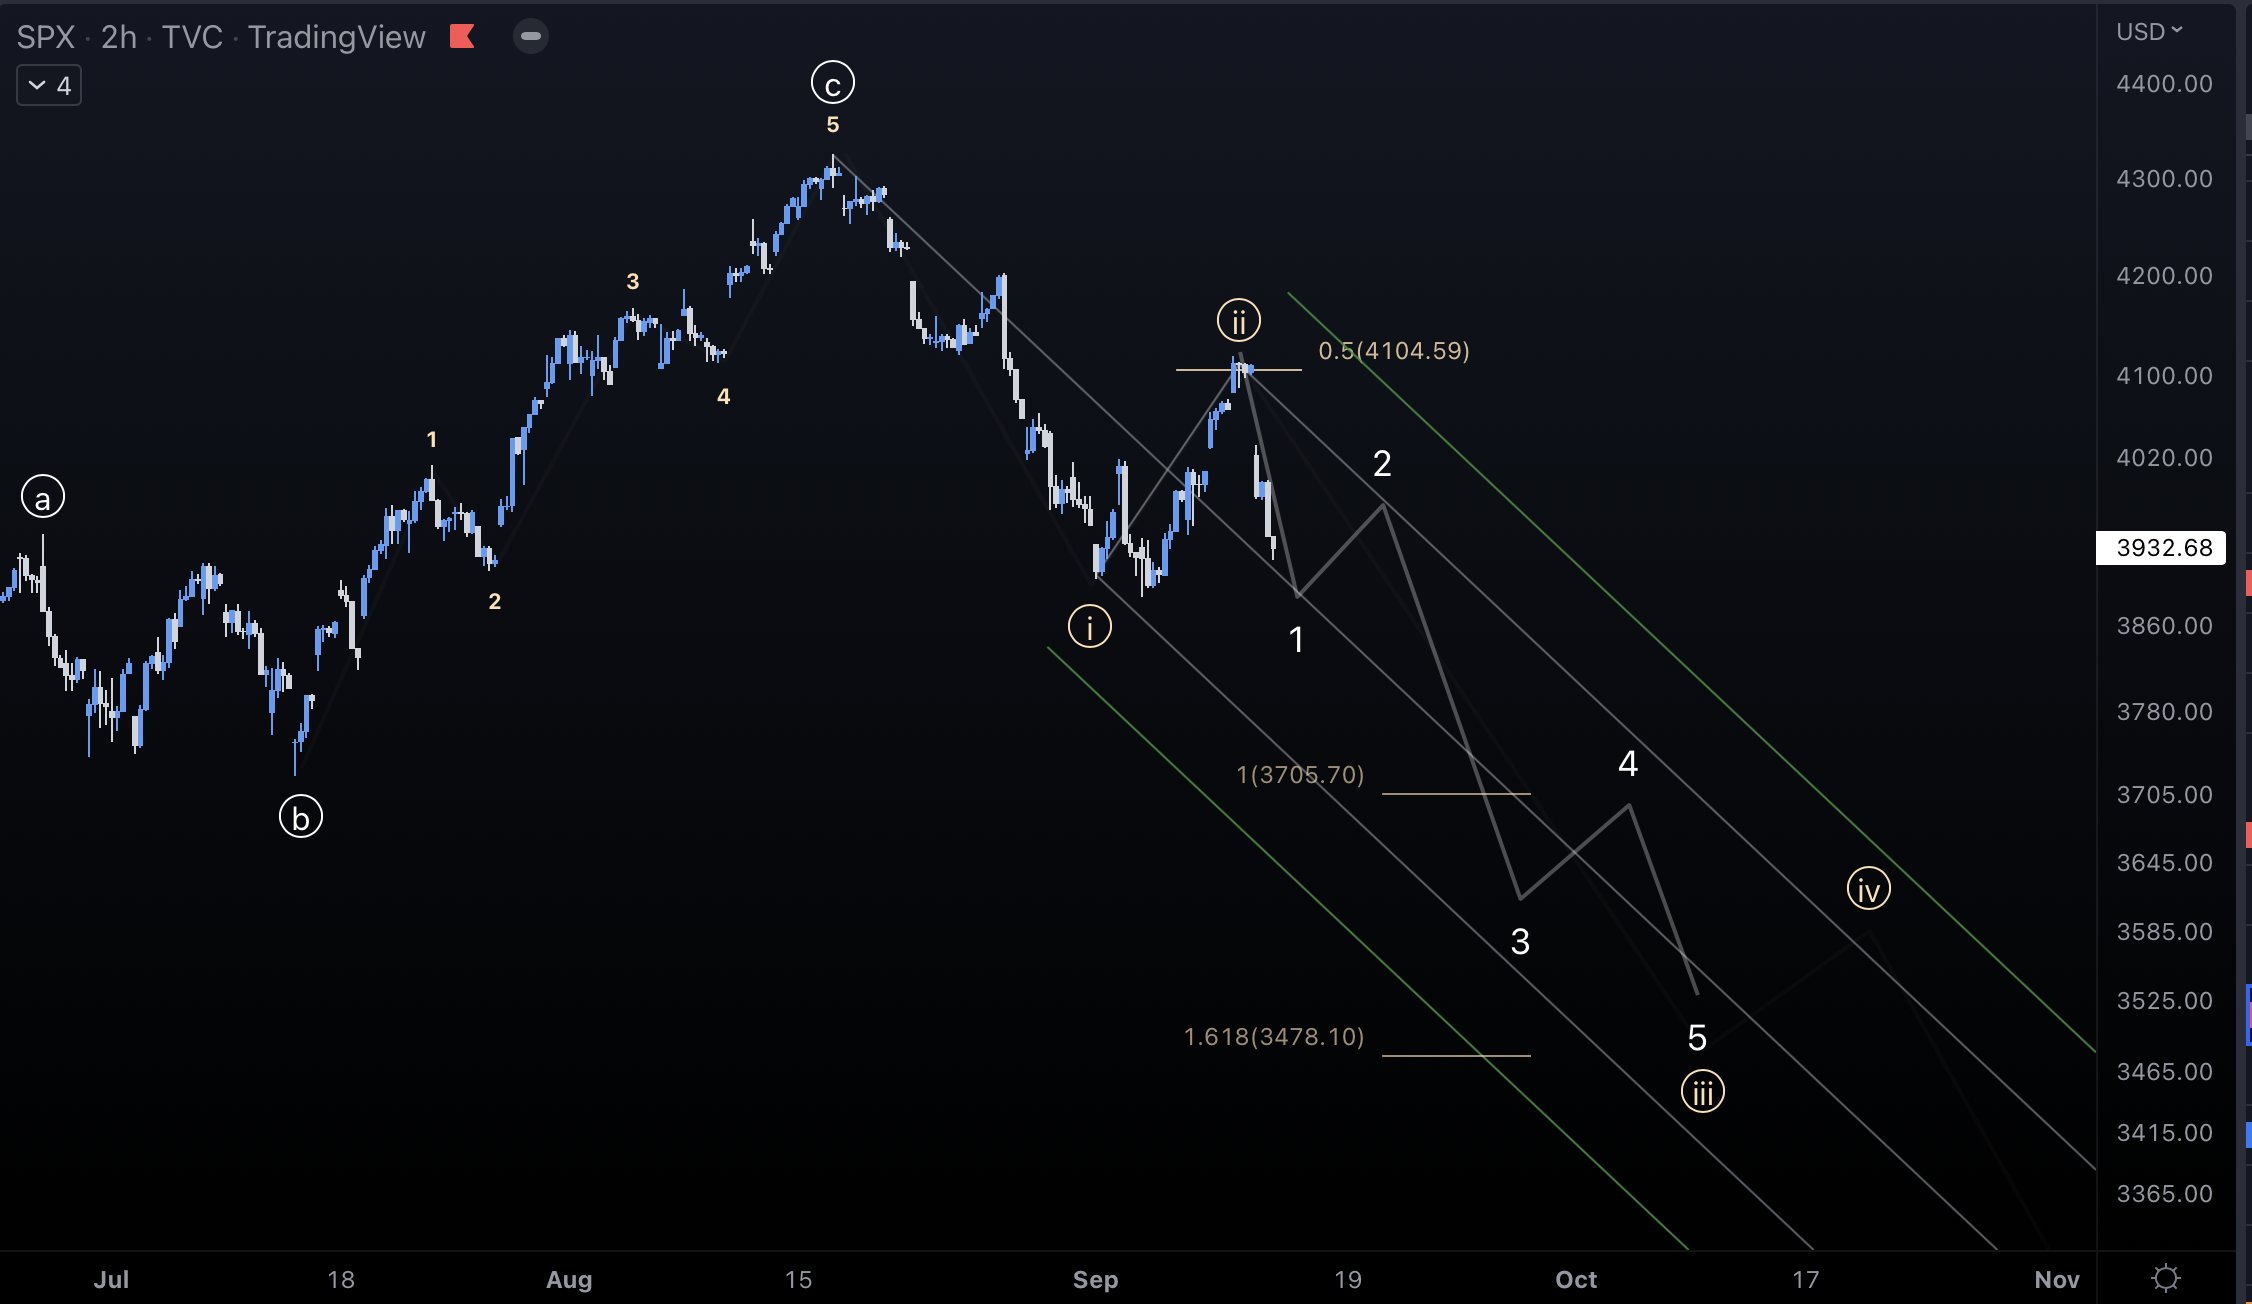
Not to be outdone, the symmetry here in the S&P has been a thing of beauty as well
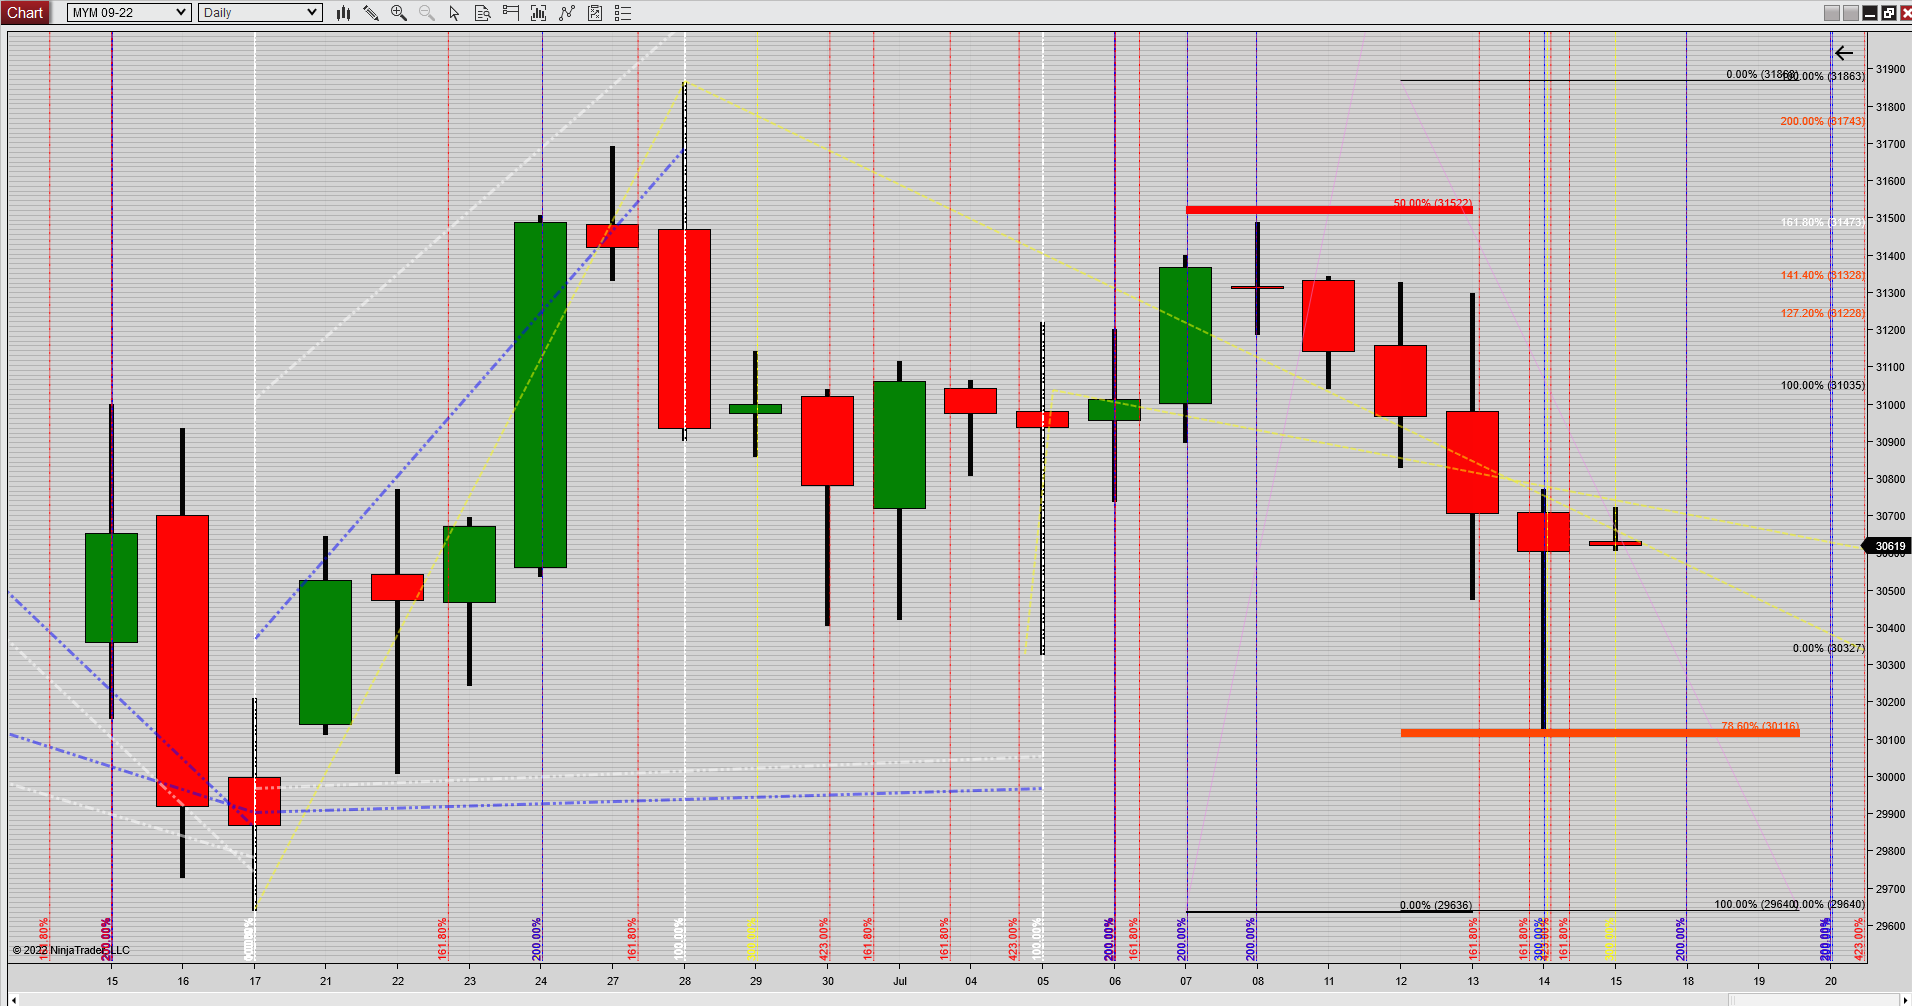
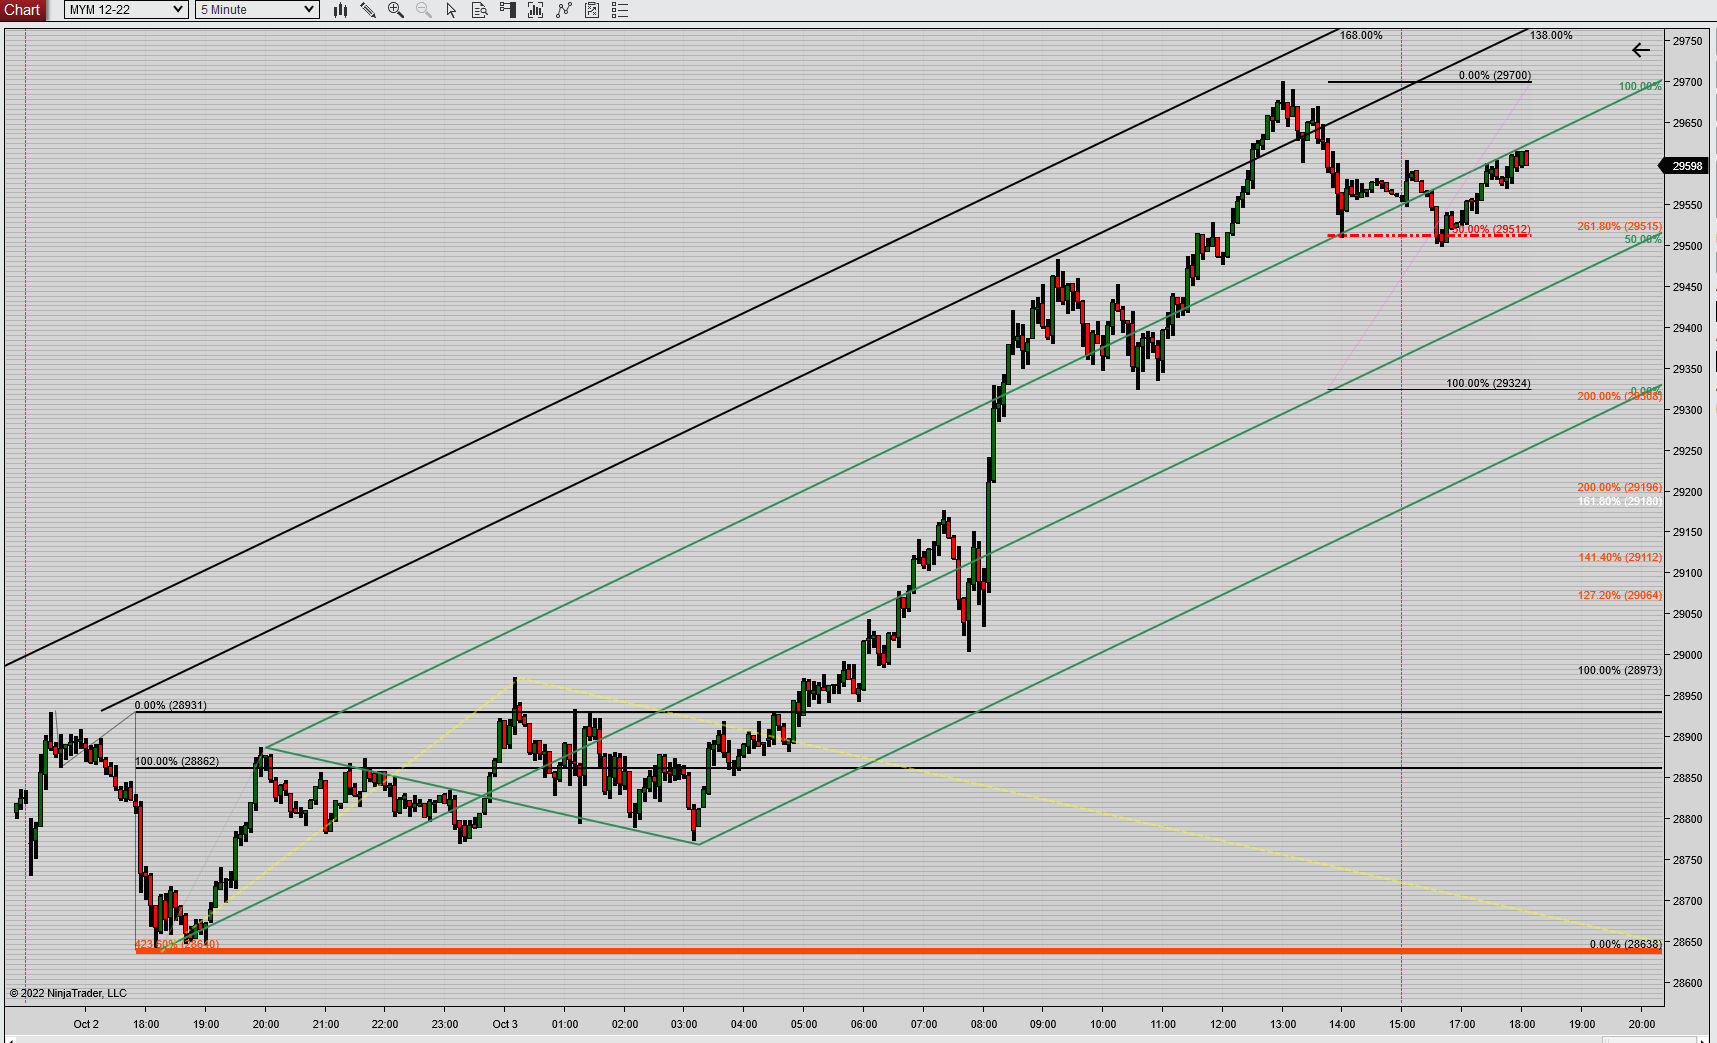
The Dow went from the 50 retrace high to a 786 retrace low, almost to the penny. The 786 often marks the end of a move be it up or down. Which leads me to believe that:
* the indexes may have completed a wave 2 of 5 as indicated on the ES chart (no I'm not an e-waver but I look for structure in the markets)
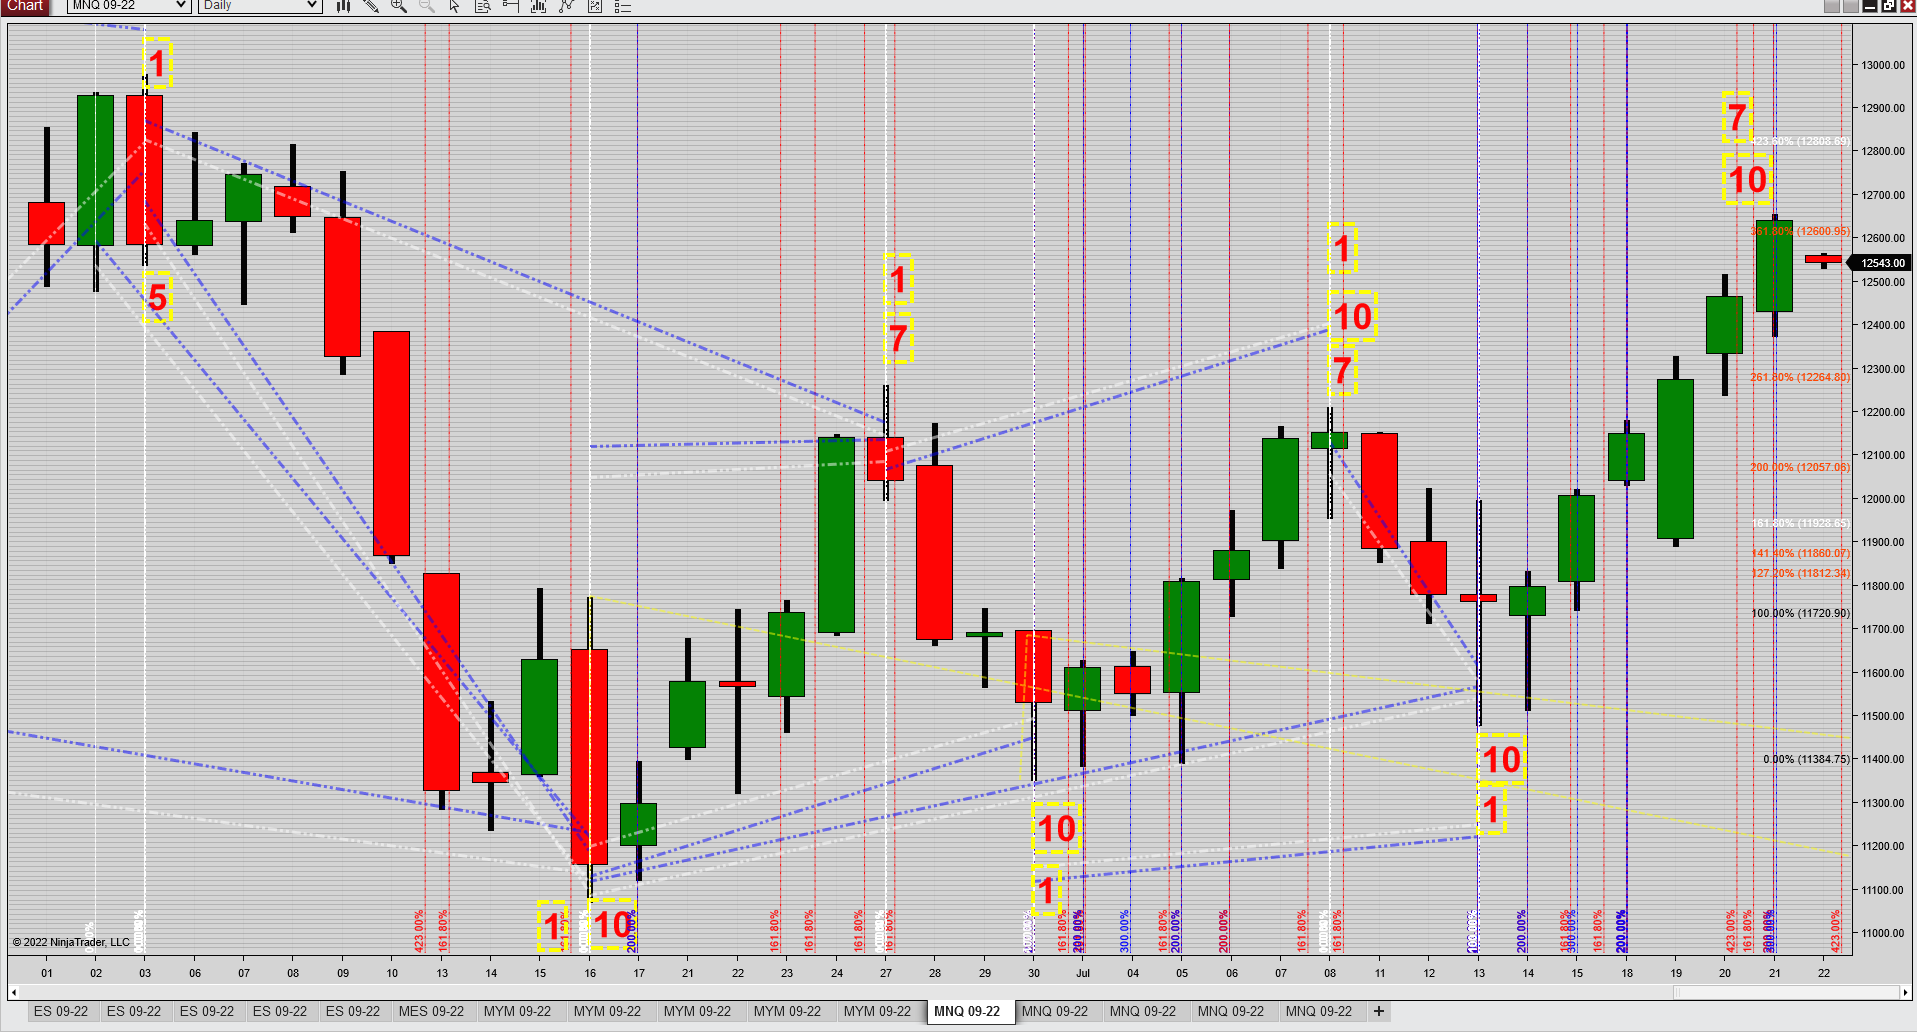
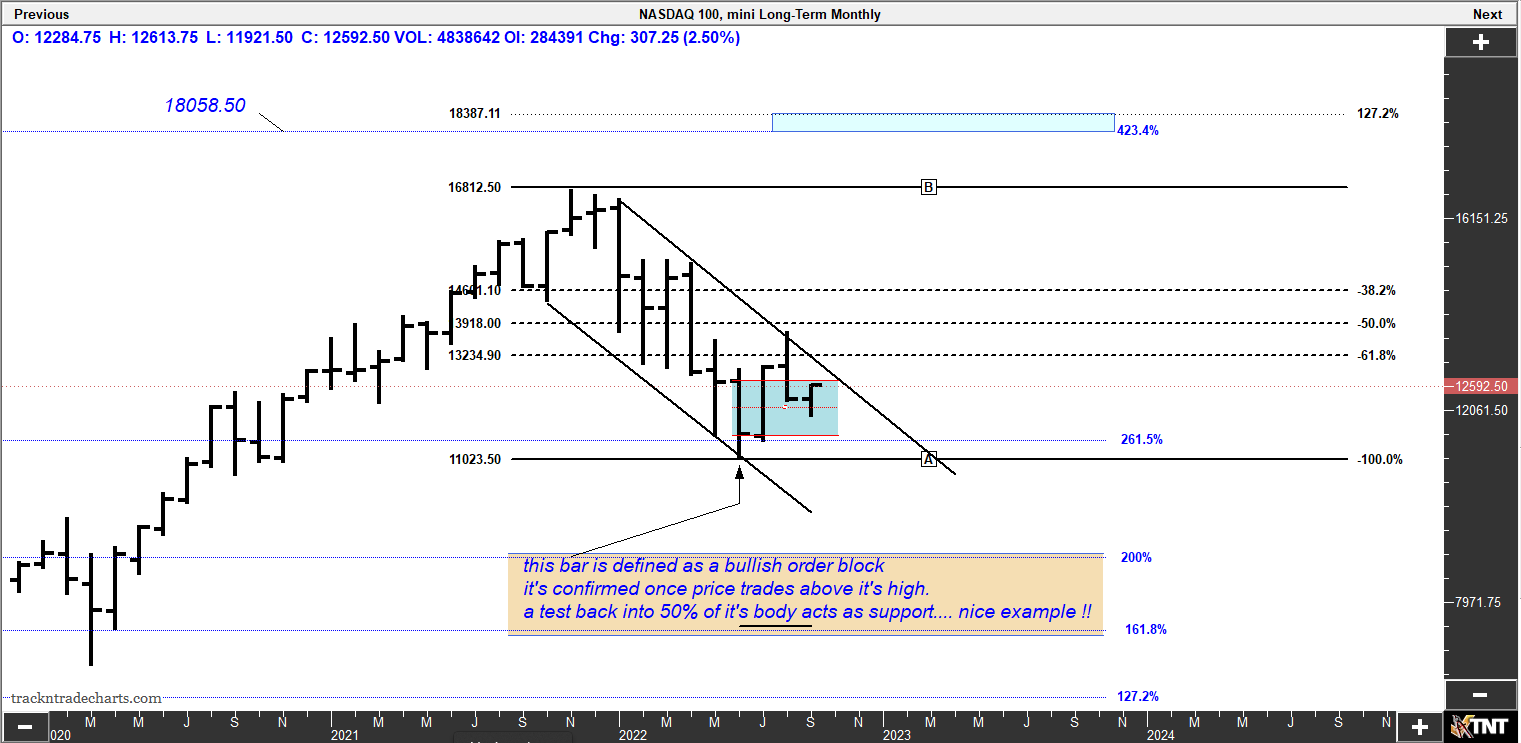
* if the 2 of 5 has completed then the 07/13 NAS low has to hold (last # 10 on the NAS chart)
* if a wave 3 were to start we will know soon, wave 3s are fast, furious and relentless
* if no wave 3 then we may see an AB/CD reaction to the upside
* for these scenarios to come to fruition the 07/13-14 lows have to hold and we need to clear the 07/08 highs sooner rather than later
If any of the above scenario(s) come to play out I'll look for (initial?) resistance levels as follows:
NAS = 12585
S&P = 4086
Trade safe everybody !
Thanks much kris!
Still on schedule ... !?!!!
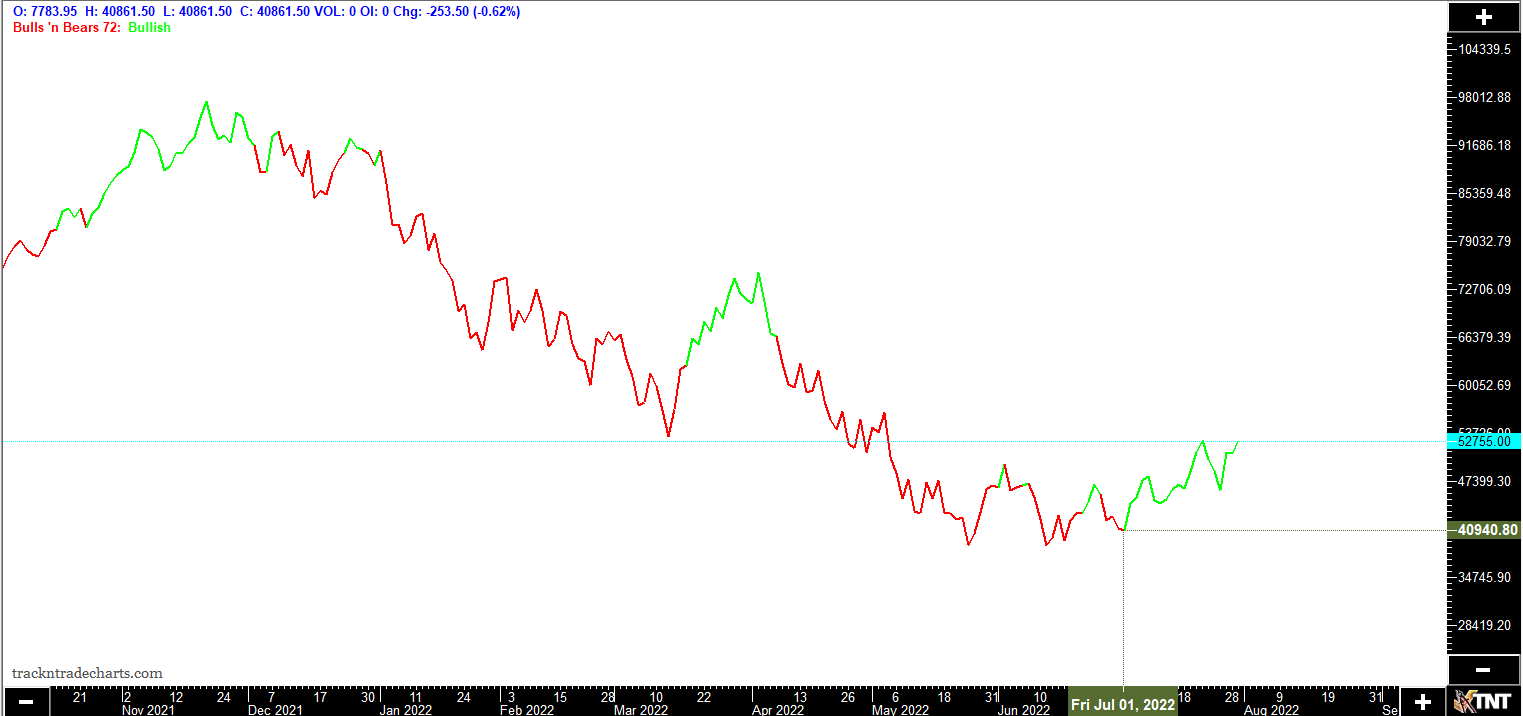
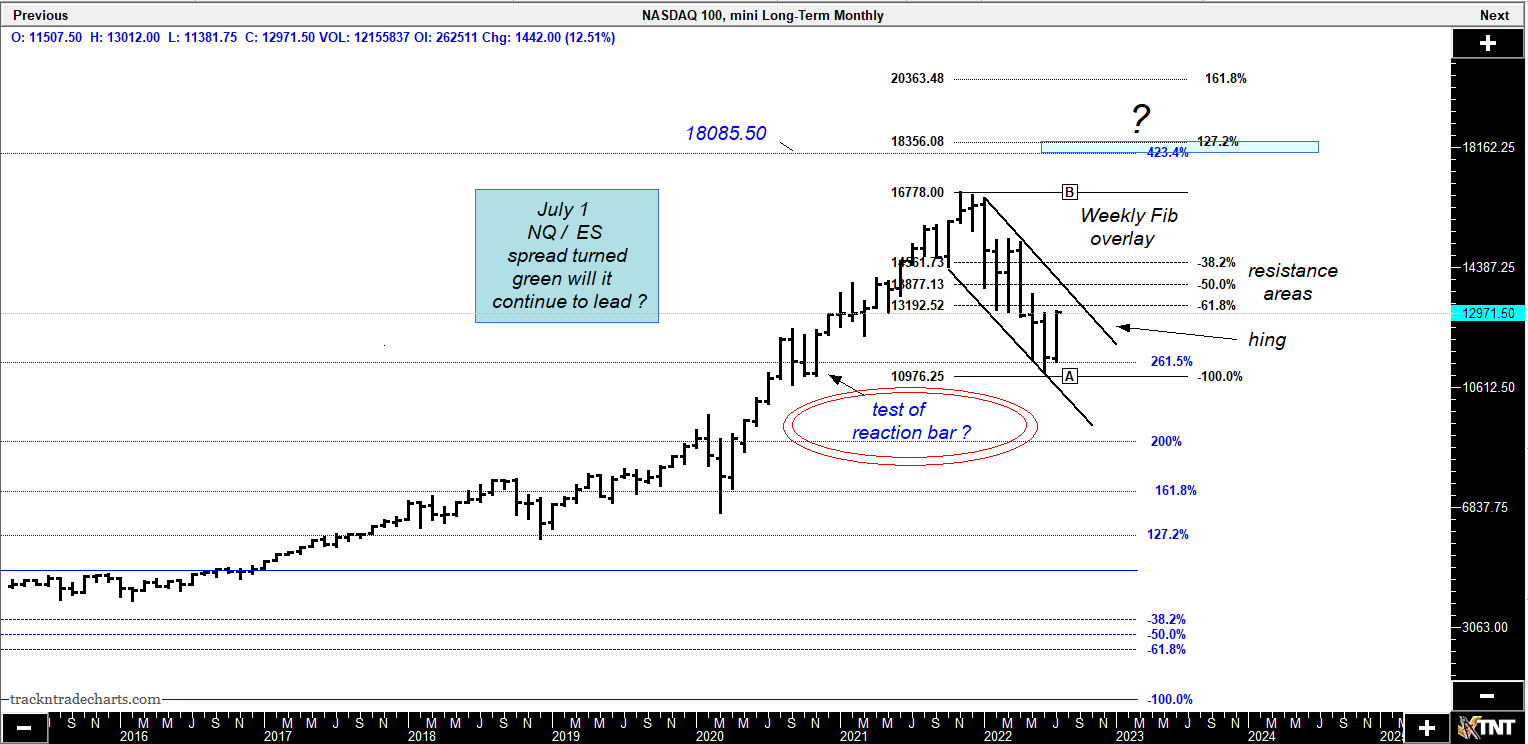
Kris, I know absolutely nothing about e-waves. In an earlier post I mentioned NQ / ES spread (as opposed ES / NQ). Below my Spread & Monthly update w/ weekly fib overlay. Typically a hing fib 127% we'll get a correction.
Trade well everyone !!
NQ Monthly
thanks much gedigan!
your welcome Mike
as always, trade what you see NOT what you hear over the news. Fear sales
"The market always tells you what to do. It tells you: Get in. Get out. Move your stop. Close out. Stay neutral. Wait for a better chance. All these things the market is continually impressing upon you, and you must get into the frame of mind where you are in reality taking your orders from the action of the market itself--- from the tape" ... Richard D. Wyckoff
Be kind, Always.
Thanks for the charts Gedigan, very informative as always. I don't do ewaves either but I do look for structure in the markets, i.e,; 3 waves/5 waves/ AB=CD etcetera. I do look for inflection points though, if you look for some of my earlier posts you'll know what I mean by that.
Like you I expect a reaction to the downside here since we have reached the first objective of the 1-2-3 low at the 1.618 extension on the ES and the other two majors. It shouldn't be a big reaction if indeed we are in a wave3 to the upside (which I think we are). Time will tell ....
My ideal scenario is that the current up wave will constitute a wave 2 reaction and will lead to a wave 3 down this fall, one can salivate at that scenario ....
I have resistance on the ES @ 4259 and then (gulp) 4465 .... ?!?
Be well and trade safe !
Your Welcome kris, it's time for an update.
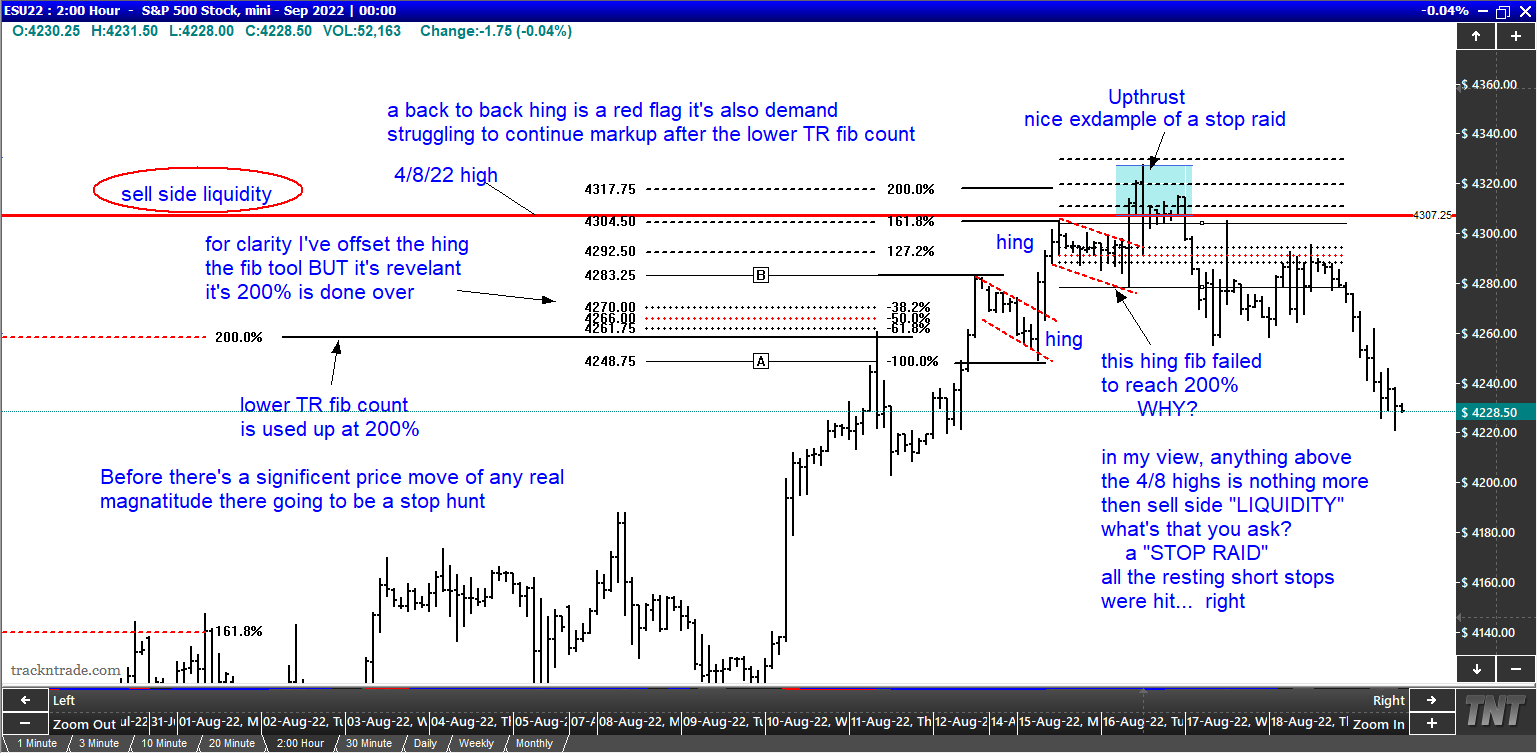
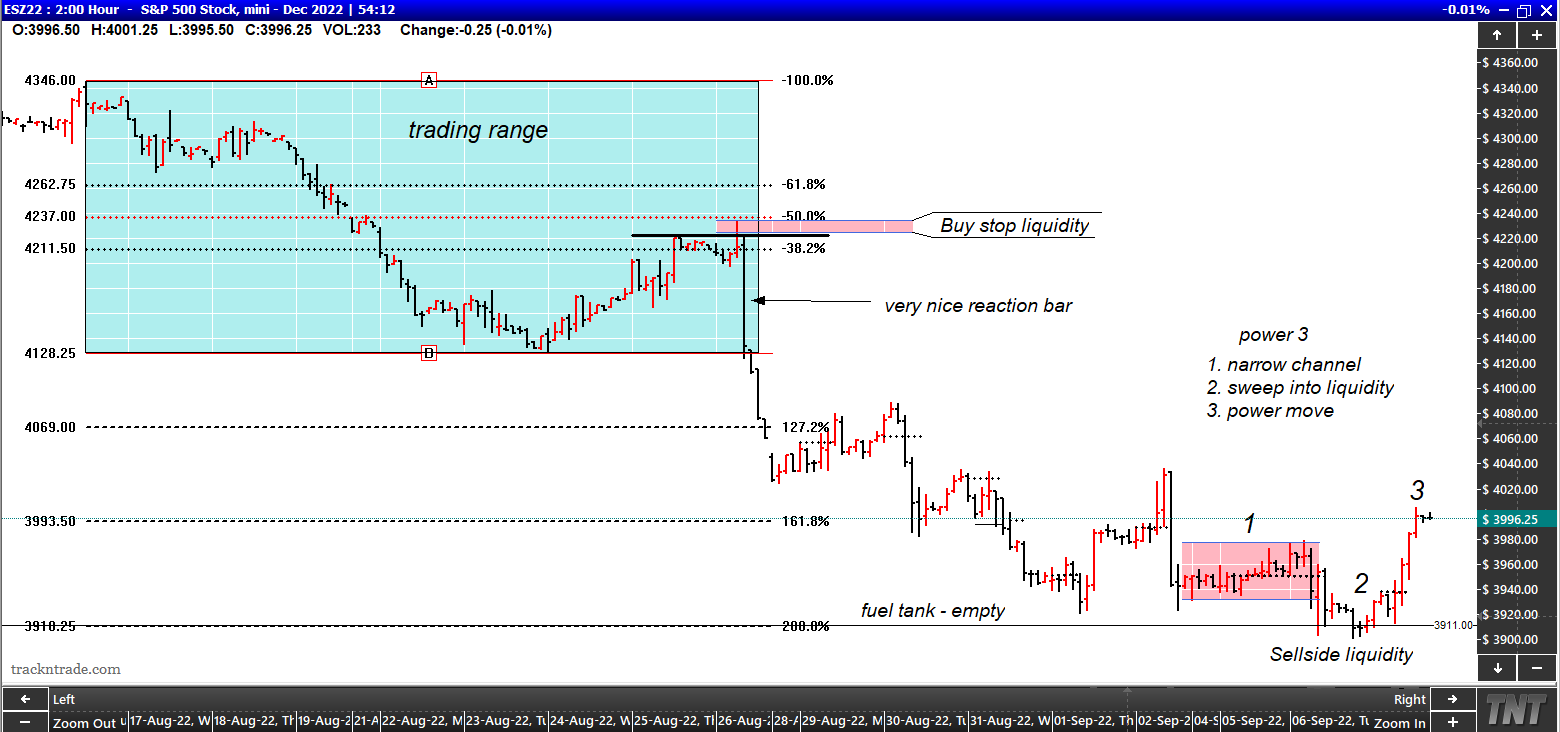
Today I'd like to show everyone how and why a Wyckoff upthrust was recently used in the ES market.
Before we look at the charts, let's talk about the fib tool I use. I know the argument - its only relevant with proper anchor points. I'll agree 1000%!! It means a lot, has great value, when it's in the proper context. So please don't throw rocks because I use it. Your goanna see proof of my personal belief in the charts below.
Best of trades to everyone
Be kind. Always
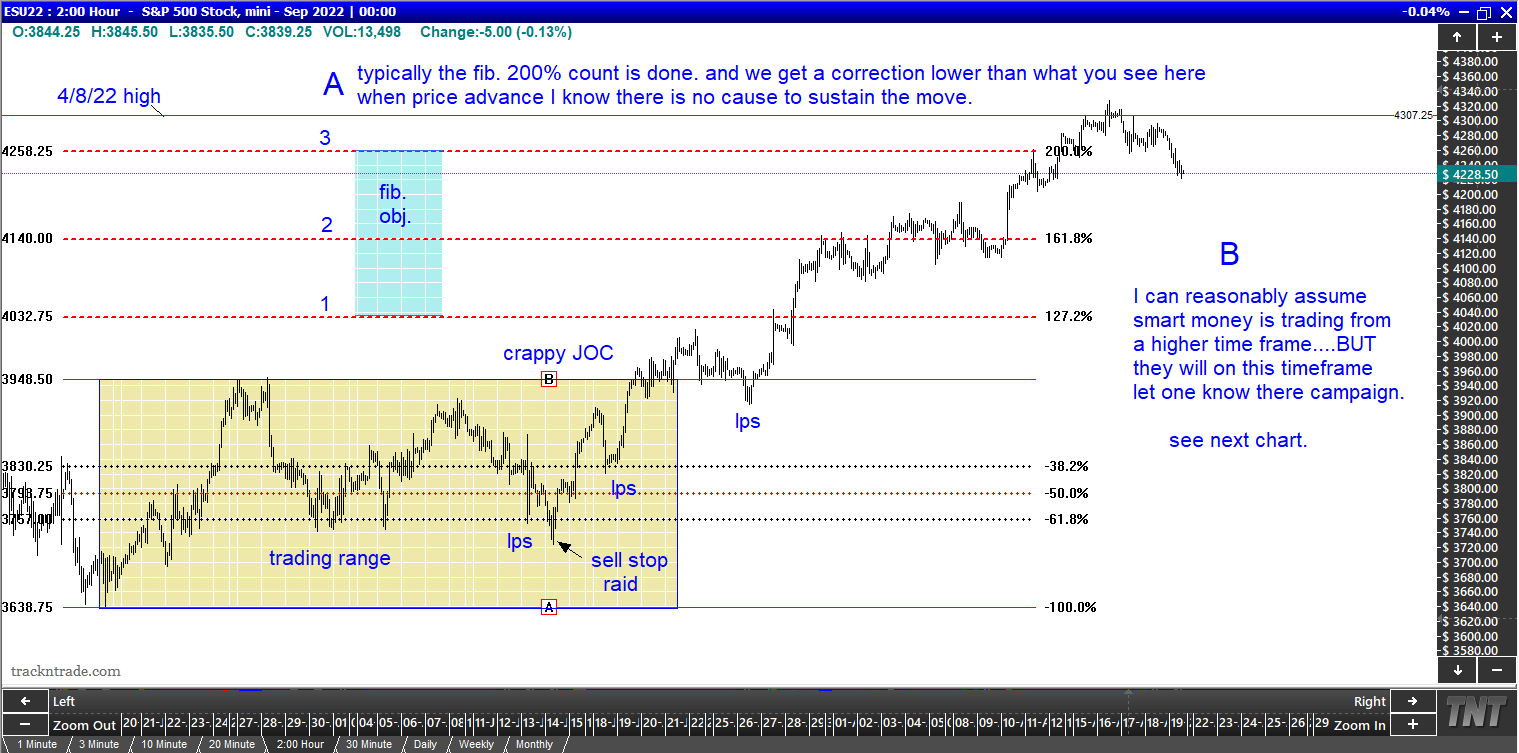
The mechanics & example of sell side liquidity. I believe last month's high end close was a setup. Smart money set this up with that move for two reasons. First frustrate retail longs who took the bait, held on until there stop was hit. Second they know where stops are hiding. This was nothing more than a stop hunt!!
After Labor day weekend the Hamptons will empty out again and all the Wall Street desks will be fully staffed following their summer break.
Will post some charts next week when I get back to my desk as well, fireworks in the making for sure, still anticipating a "short of the decade" event unfolding ...
For now though, still my only worry in the world: "is the tide gonna reach my chair ?" ....
Cheers all !
Thanks much guys. Keep it coming!
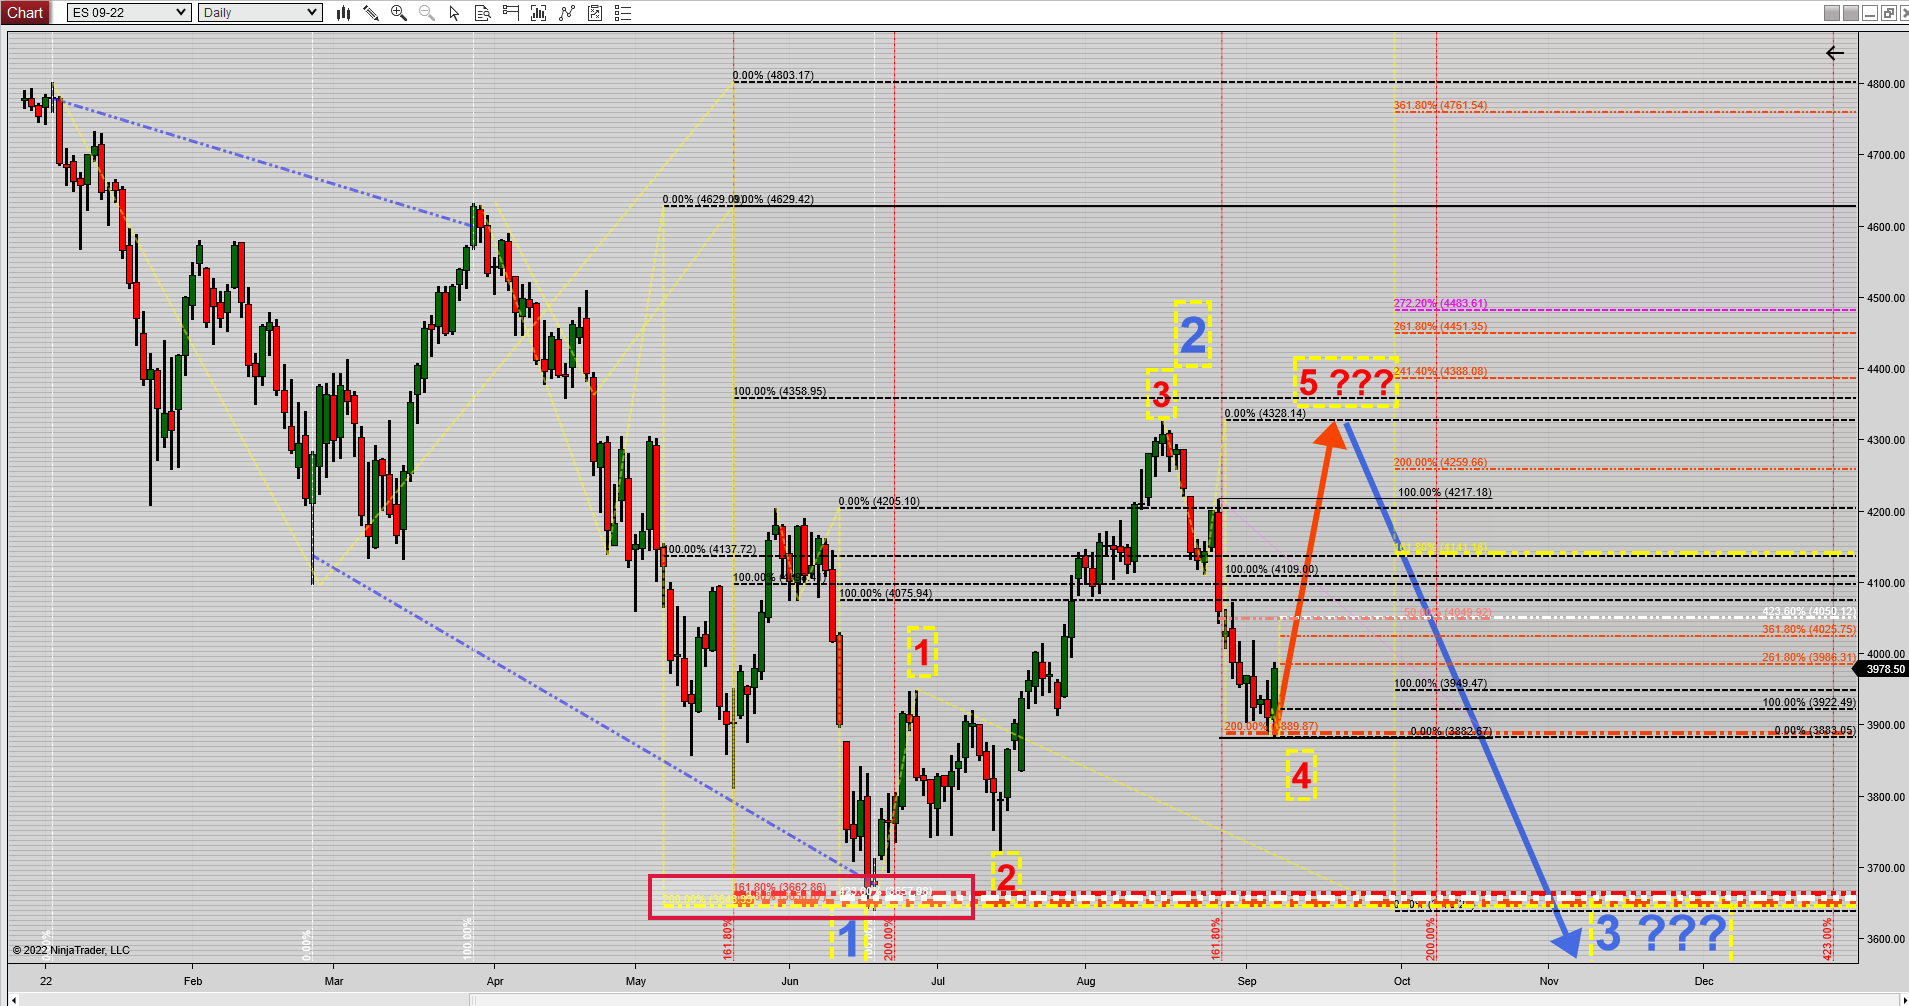
The June low occurred at a confluence of 4 fibo extensions and we have seen a sizeable rebound into 08/18 which I will consider (until further notice) a wave 2 following the jan/jun wave 1 down. If that count gets confirmed we could soon see a wave 3 to the downside, 3s are fast, furious and unrelenting hence my "short of the decade" scenario I alluded to in a previous post.
Today we had a nice 100+ point upthrust marking what I label as a wave 4 low and no: I'm not an ewaver (purists will tell you that a 4 can't overlap the 1), I just look for "structure", be that 3 or 5 waves or an AB-CD etcetera.
If this initial thrust develops into a wave 5 then we shall see whether it'll be an extended 5 (equaling or exceeding the 08/18 high) or a truncated 5 (short of the 08/18 high)
First level of resistance on the S&P comes in at 4050
The weekly Dow:
We all have different eyes, as it should be.
My view..
Update: first resistance on the S&P is at 4070 per the December contract .
Forum
Time to get fully LONG indexes. June low, retrace in August, now explosive rally to year end. New all time highs.
Near term, interest rates have topped, commodities, especially energy have topped.
Safest place to park money is indexes.
Been quite the week: 3 white knights (as opposed to 3 black crows) ... !
The Nasdaq has reached the 38.2 retracement level of the mid august highs (almost to the penny), we could see the first reaction to the down side from this level, probably fairly shallow and it could offer a chance to "reload":
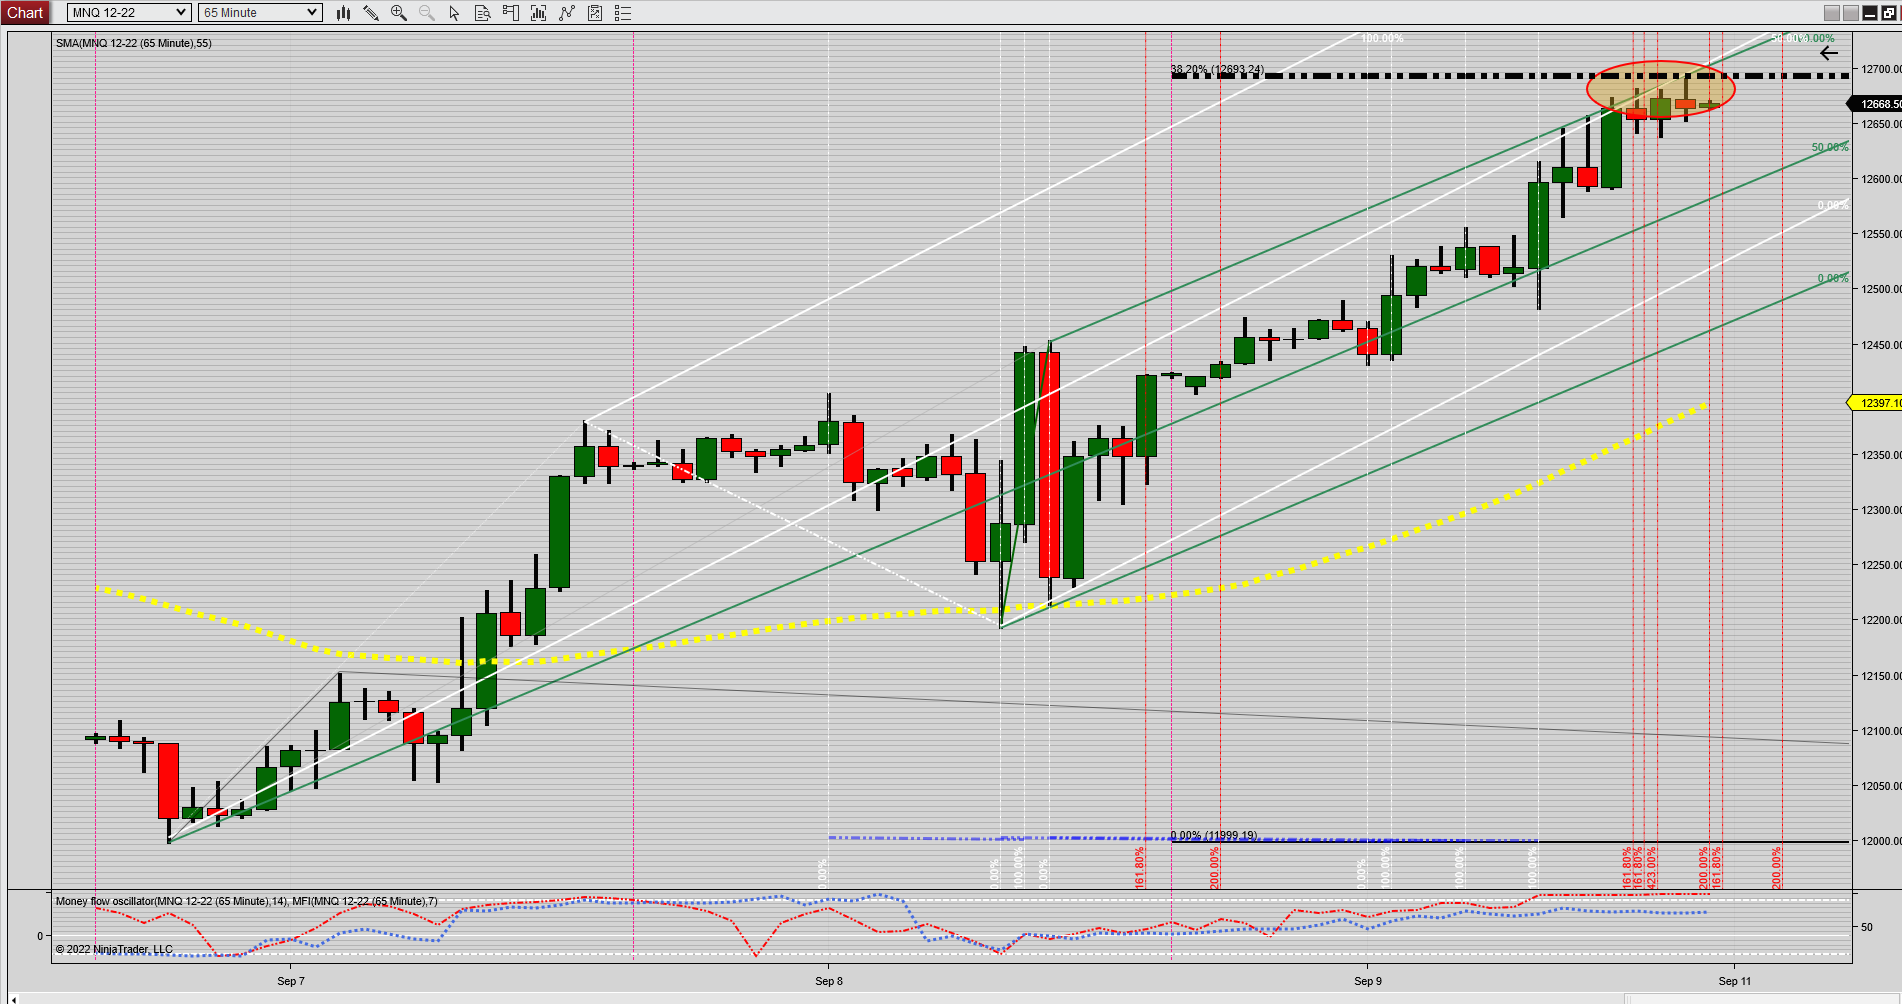
Looking at the hourly makes it even more interesting, two forks of which the median and outer bank intersect:
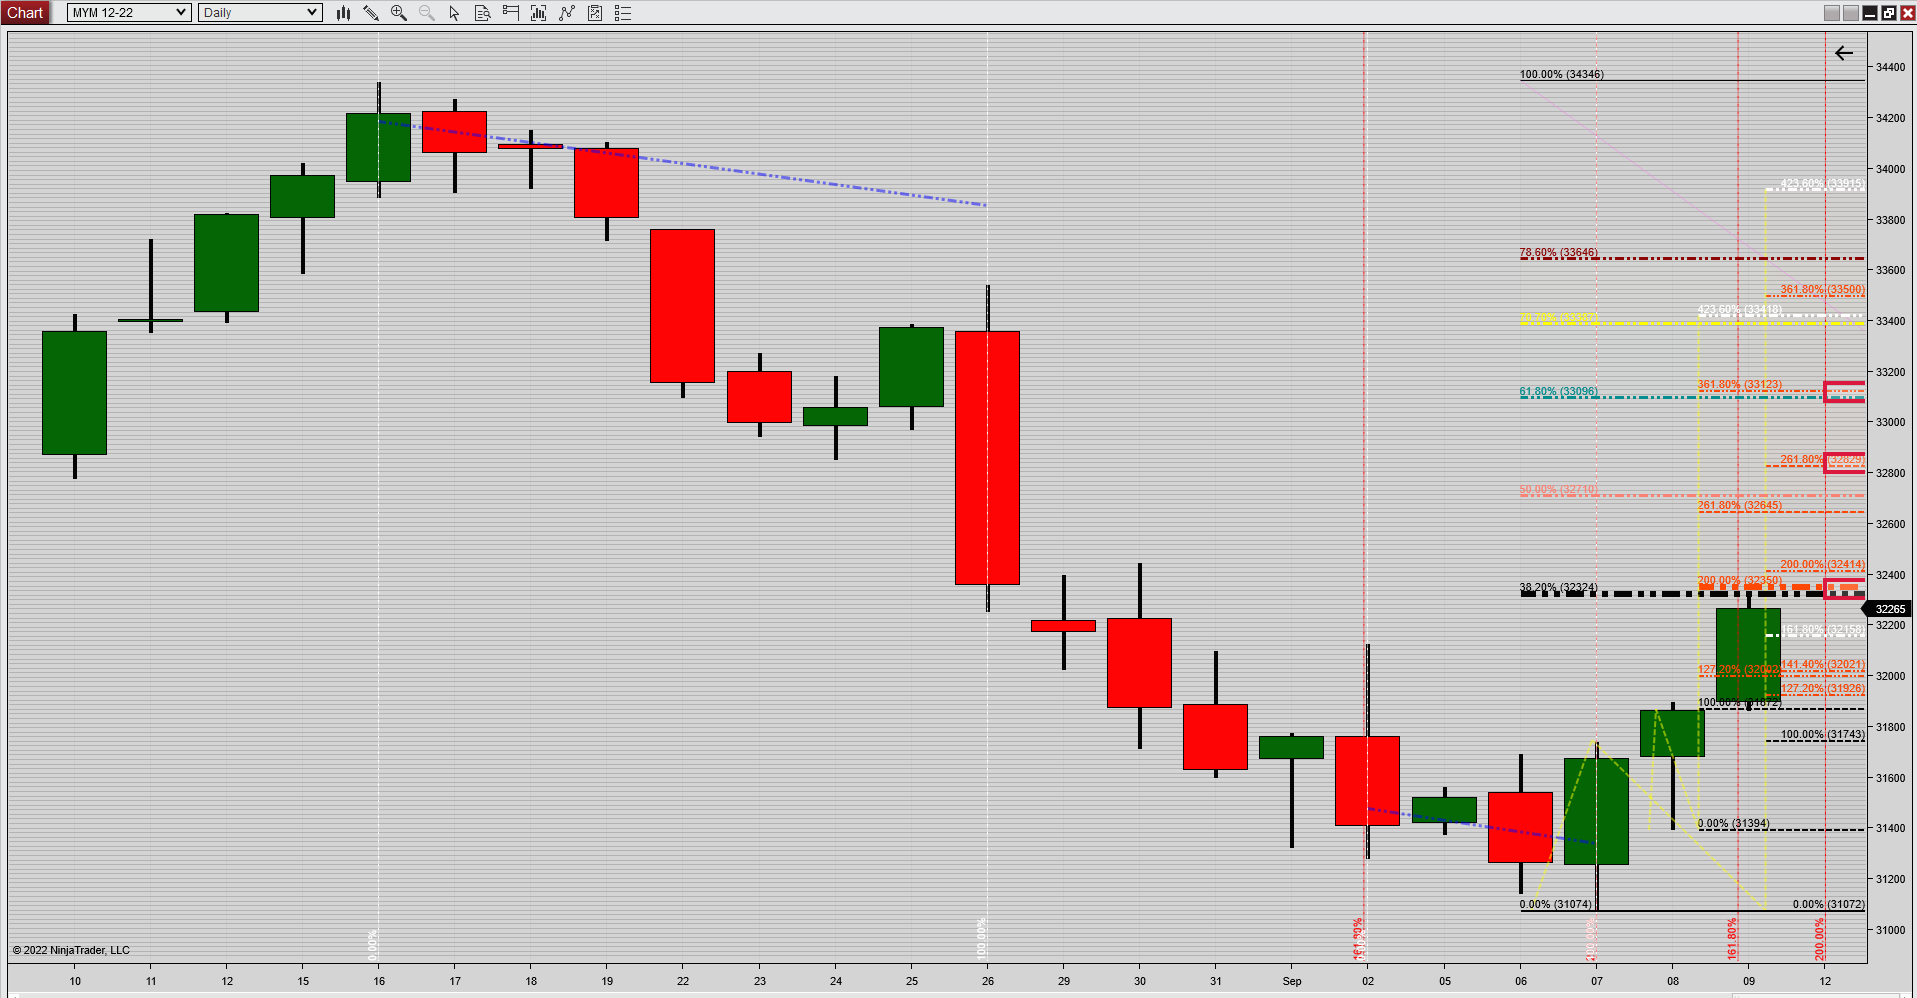
The Dow is in "lock step" with the Nasdaq at the 38.2 almost to the penny as well:
Trade safe everybody !
Hmm .... ?!?

Appreciate everyone's comments!
Monthly NQ chart updated a tad early. I anticipate a move out of the channel. As David Weis once said, "Prove Me Wrong" . RIP David, you are missed!
Trade well
Yesterday sure was a warning shot (across the bow?), we shall closely monitor the ongoing developments. My count in the previous posts was somewhat similar to what the experts nail down, see chart below:
This chart doesn't see the 1 down as finished and calls for a possible slightly lower low on the ES before the 2 up starts, interesting times for sure, we'll be watching closely !
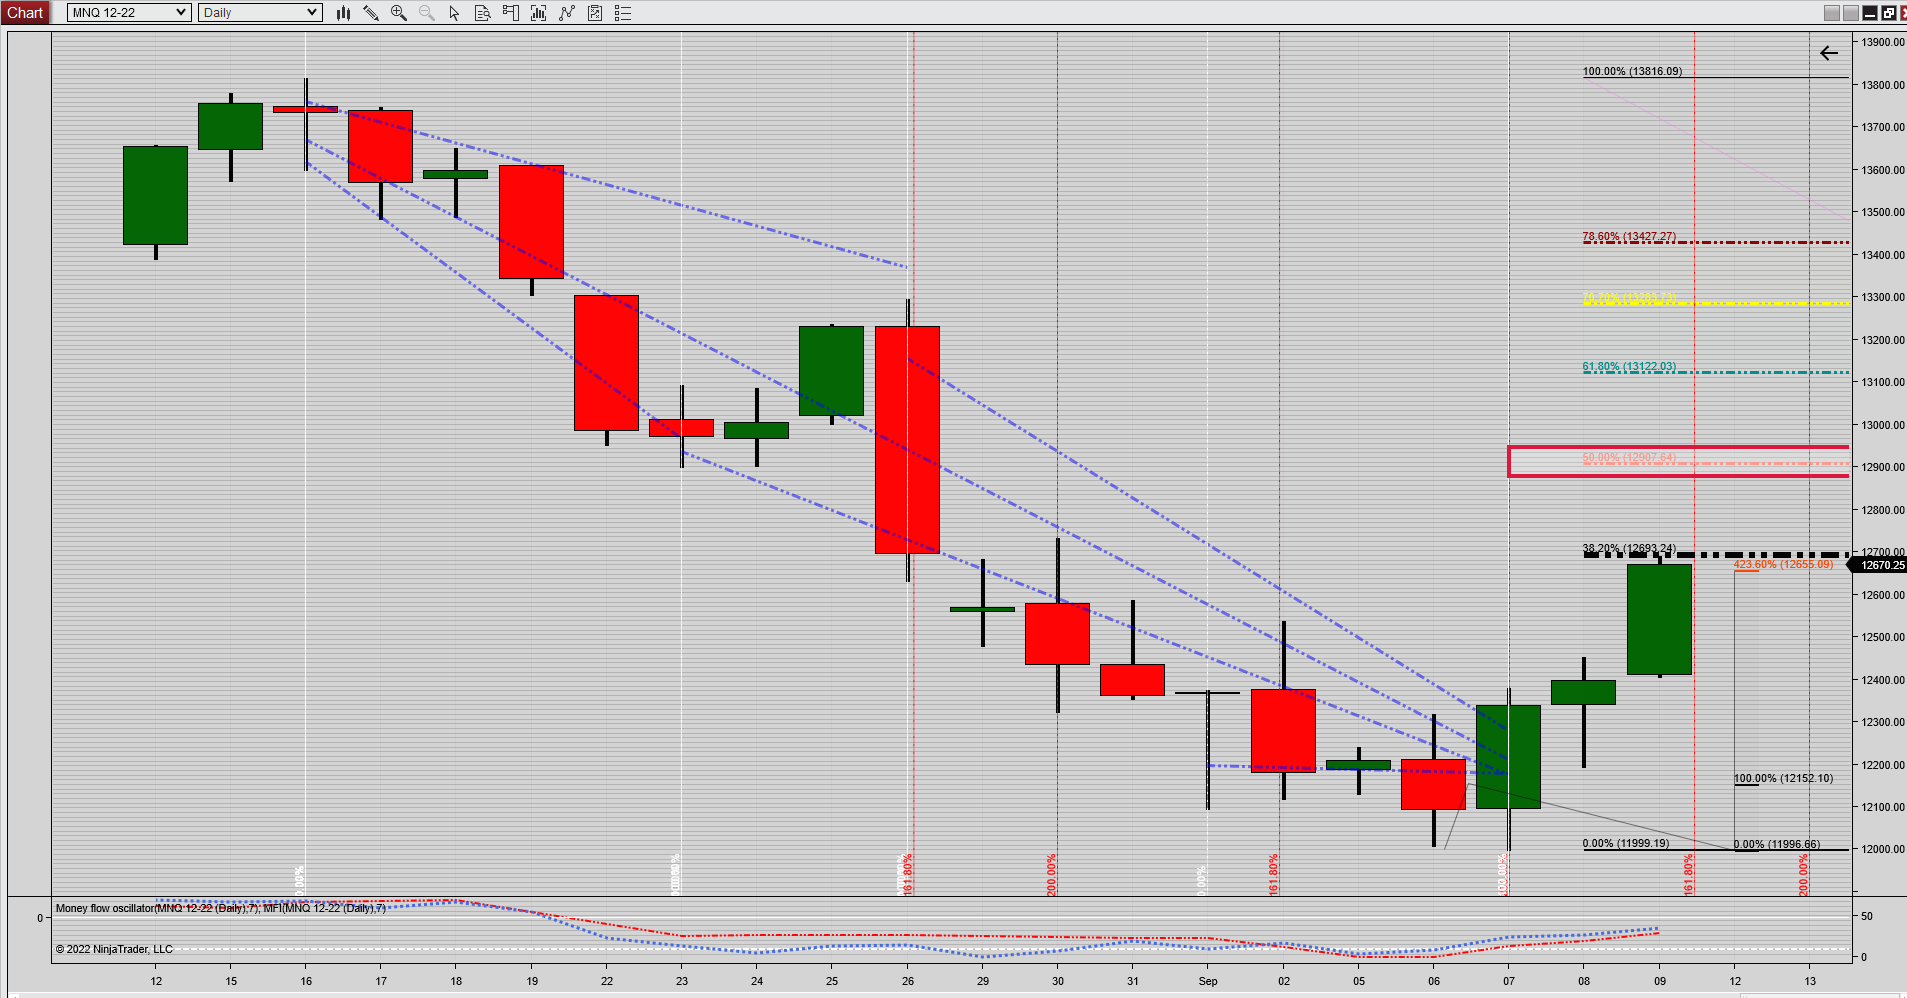
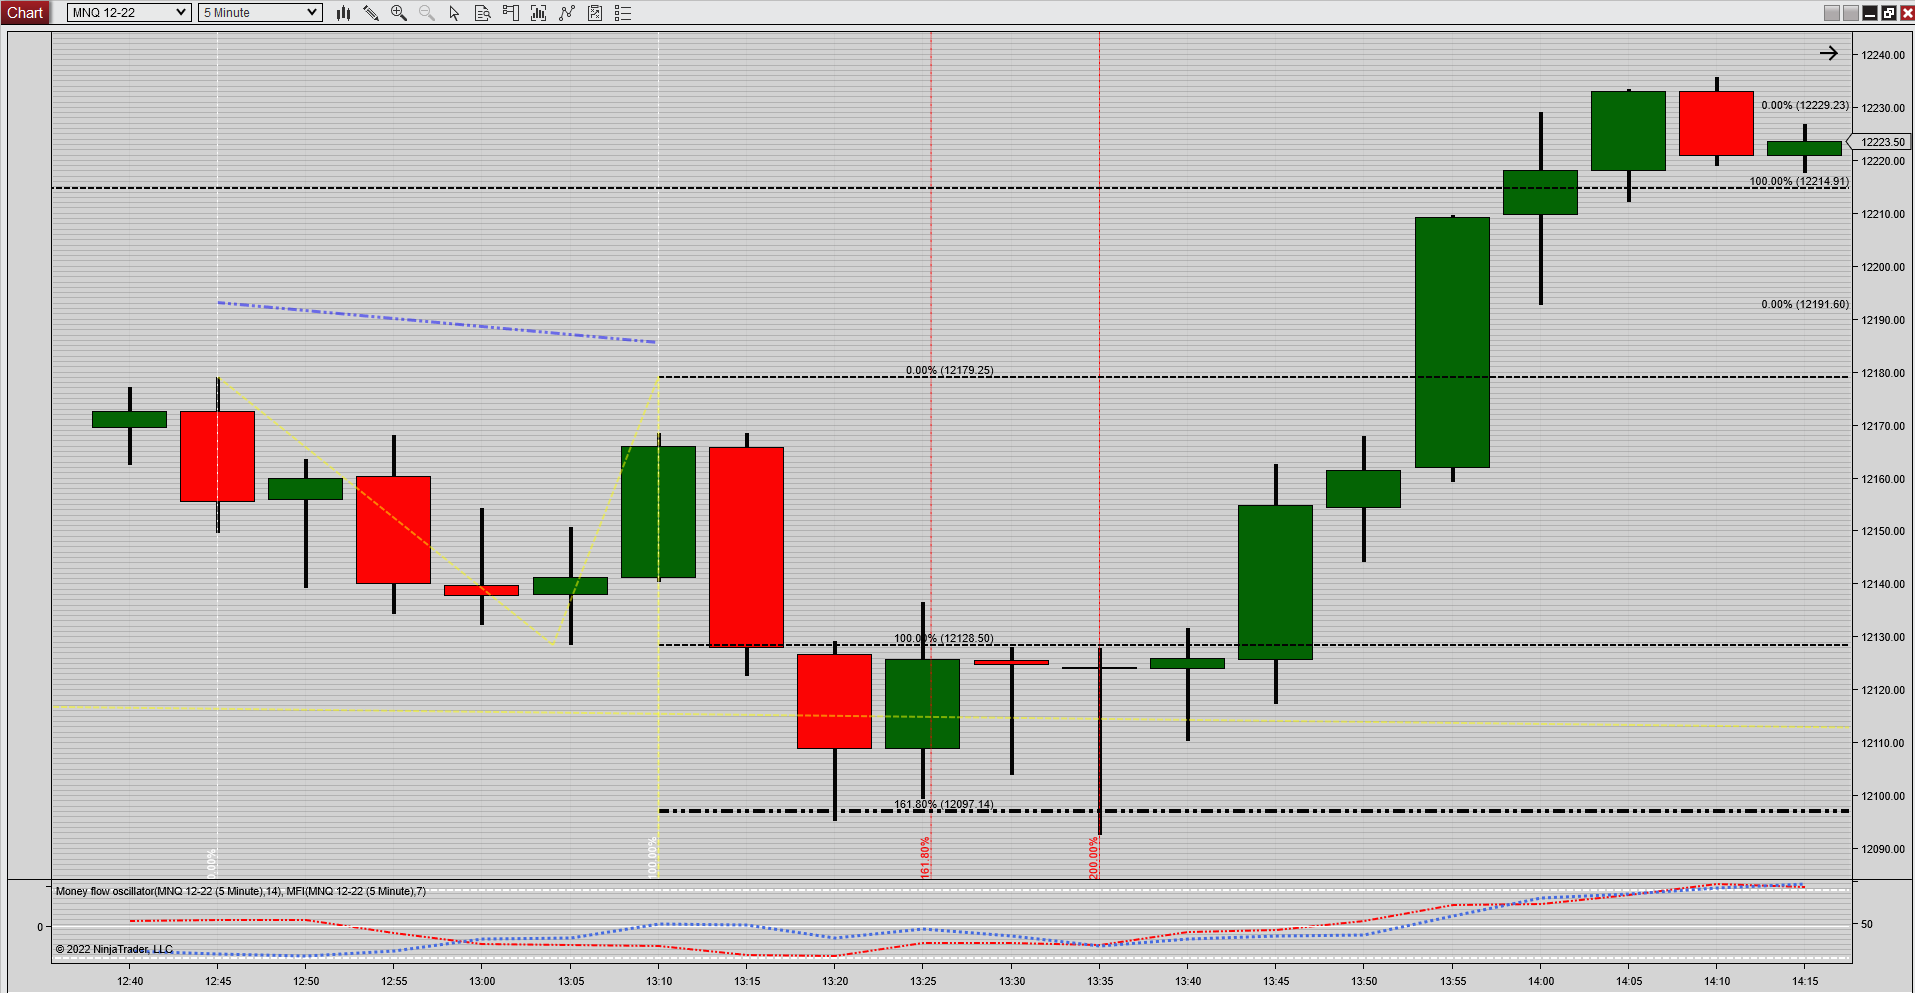
In previous posts I have mentioned price being the ultimate indicator. Price alone isn't enough of course so I tend to look for "points of inflection" where time and price converge. The below chart gives a great example.
The .618 price extension (@12097) met with a time extension of 200 based on the highs of the ABC (or 123). The 1.618 time extension nailed the high of that down move and the 200 nailed the low and subsequent reaction.
This technique works on any market in any time frame, it's a matter of being patient and finding these inflection points while they develop which isn't all that hard but it requires "work".
Does it work this well all of the time? Of course not but it allows for one to be wrong right away which is a major component of capital preservation !
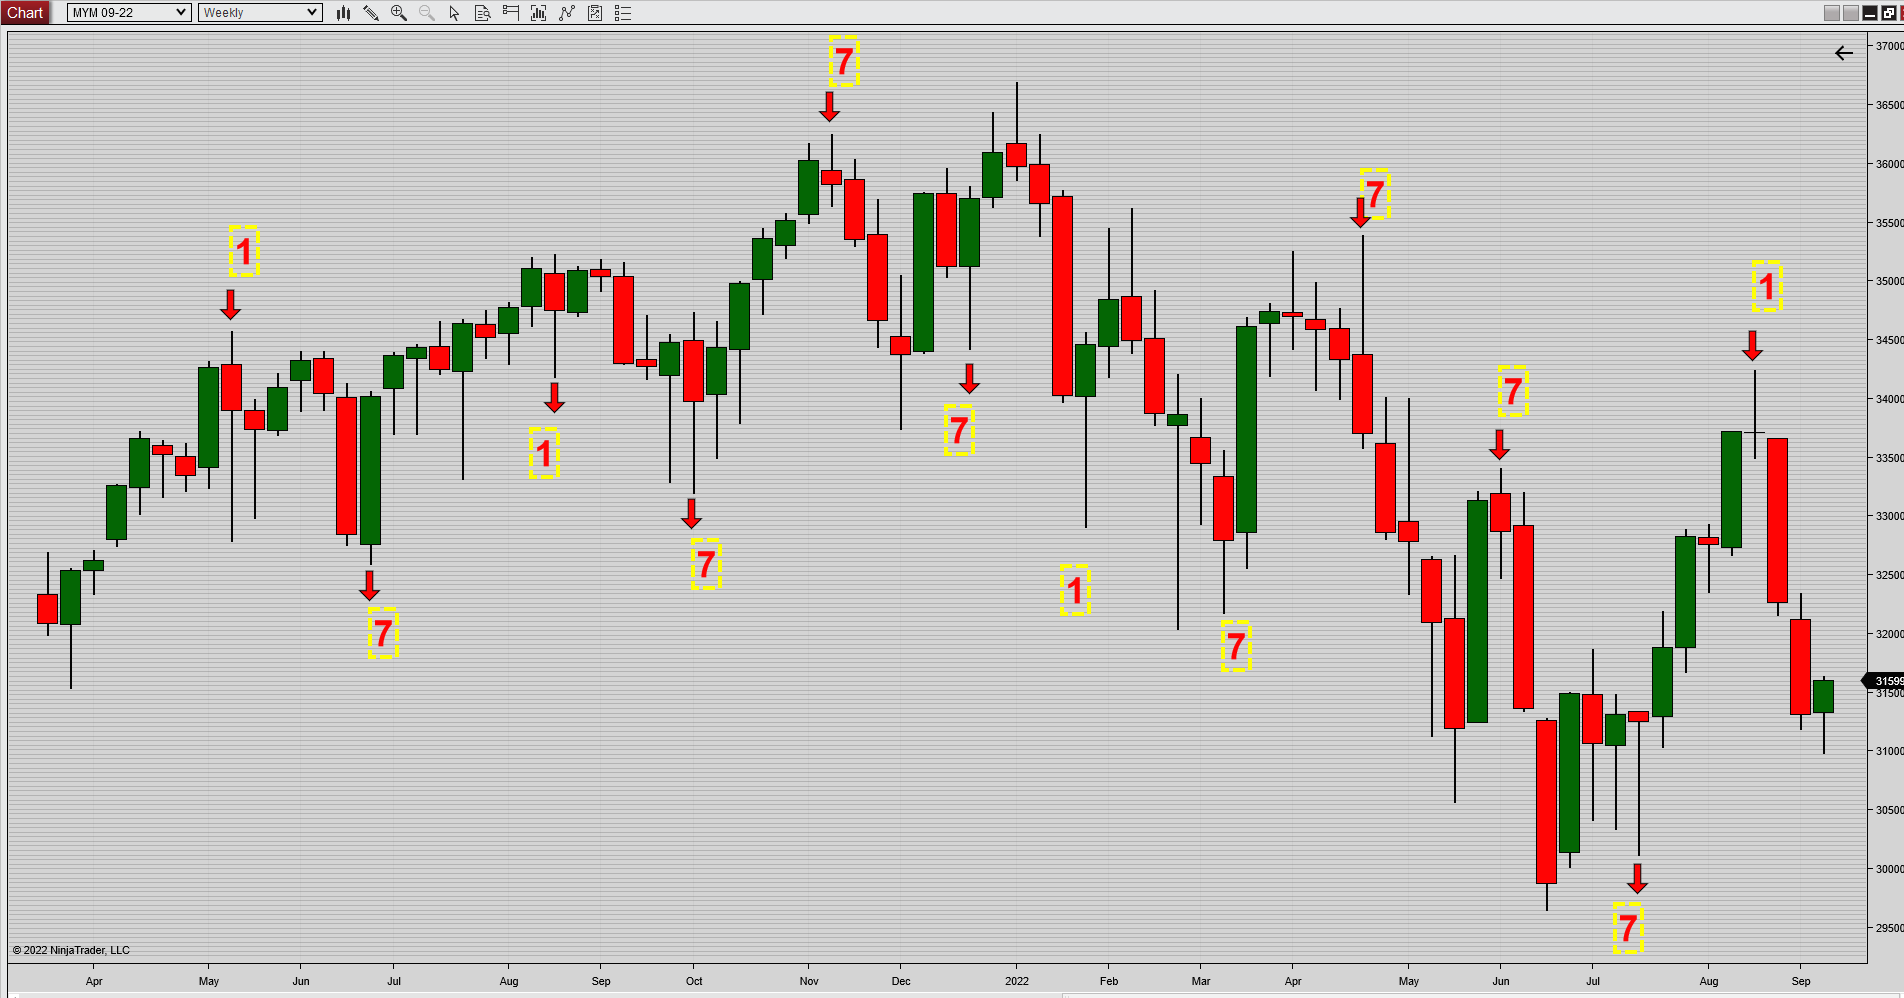
Dow Jones weekly, another 7 week cycle comes in at the 423 time extension after testing the June lows, the Nasdaq also tested the June lows but never went below it, the S&P has a similar test but a bit lower than the Nasdaq, not as low as the Dow.
We'll see a counter trend move to the upside lasting a few weeks, maybe test the August highs (I doubt it) ?
As always: price will tell ...
Trade safe everybody !
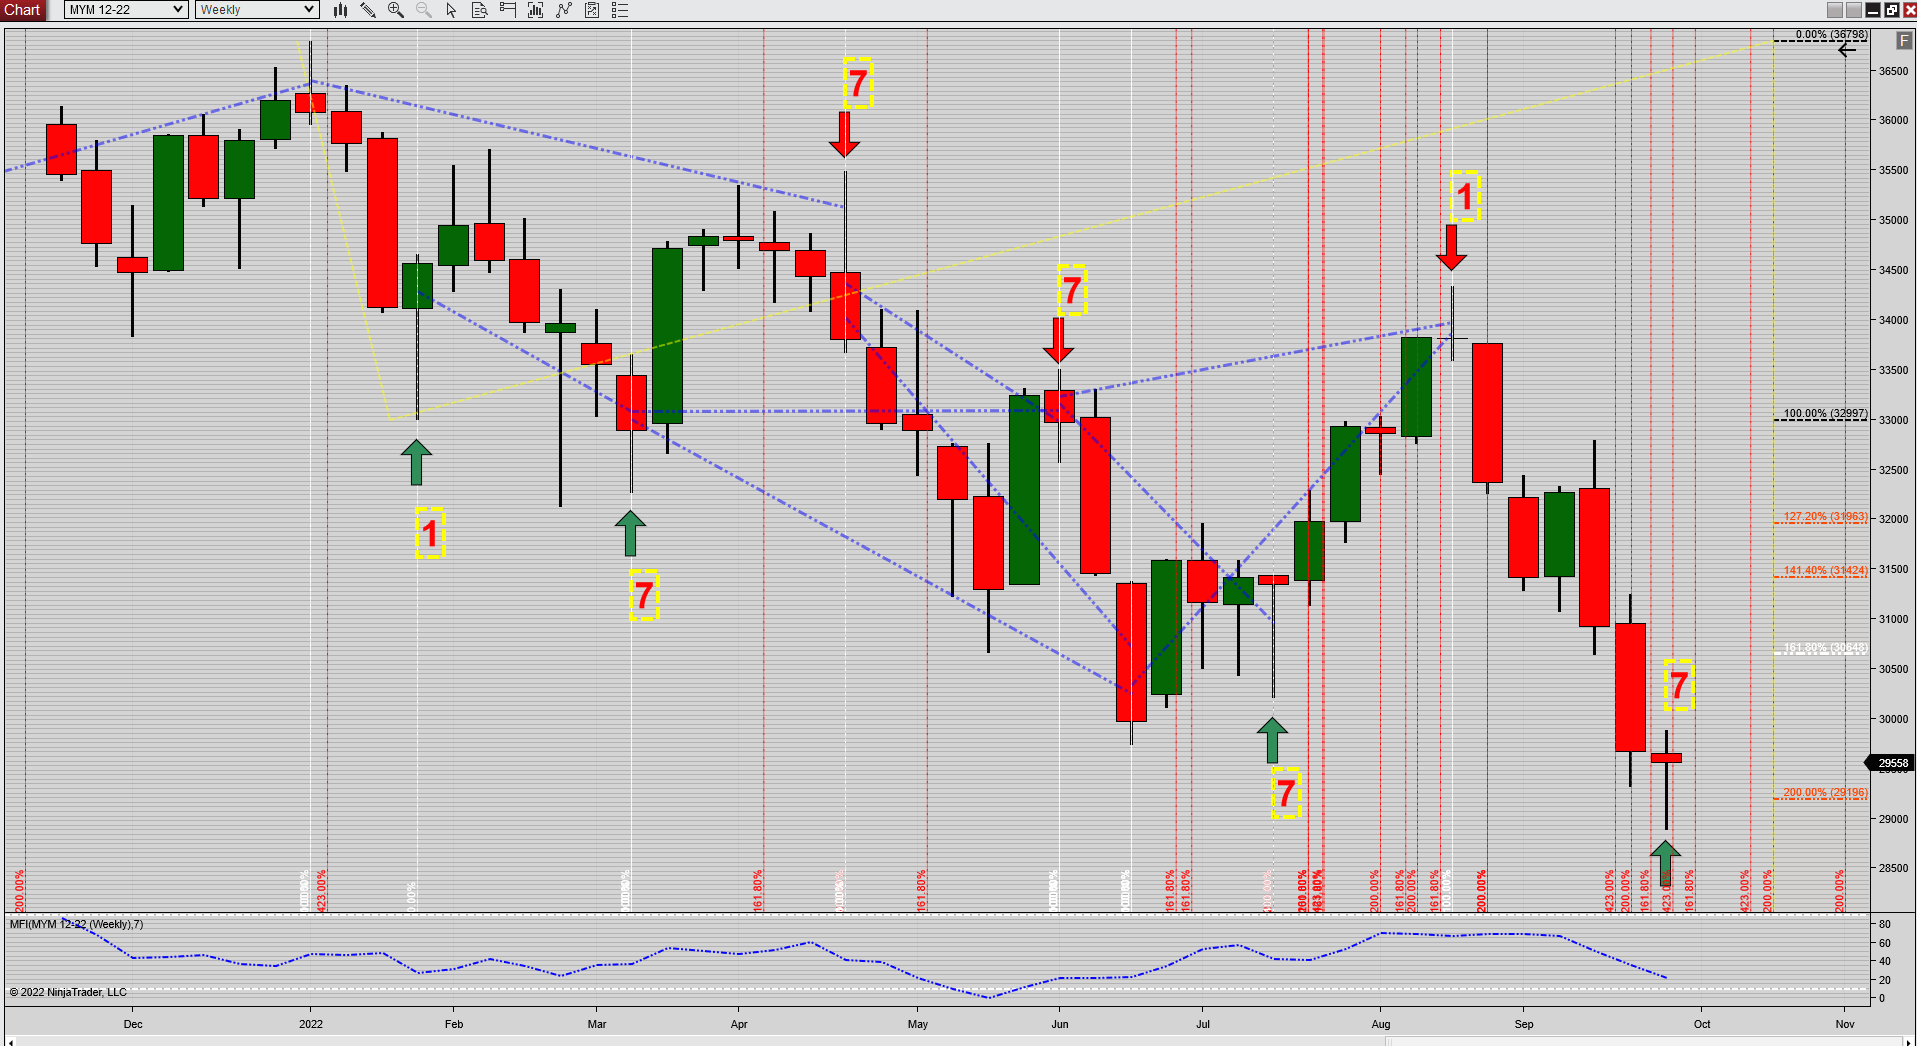
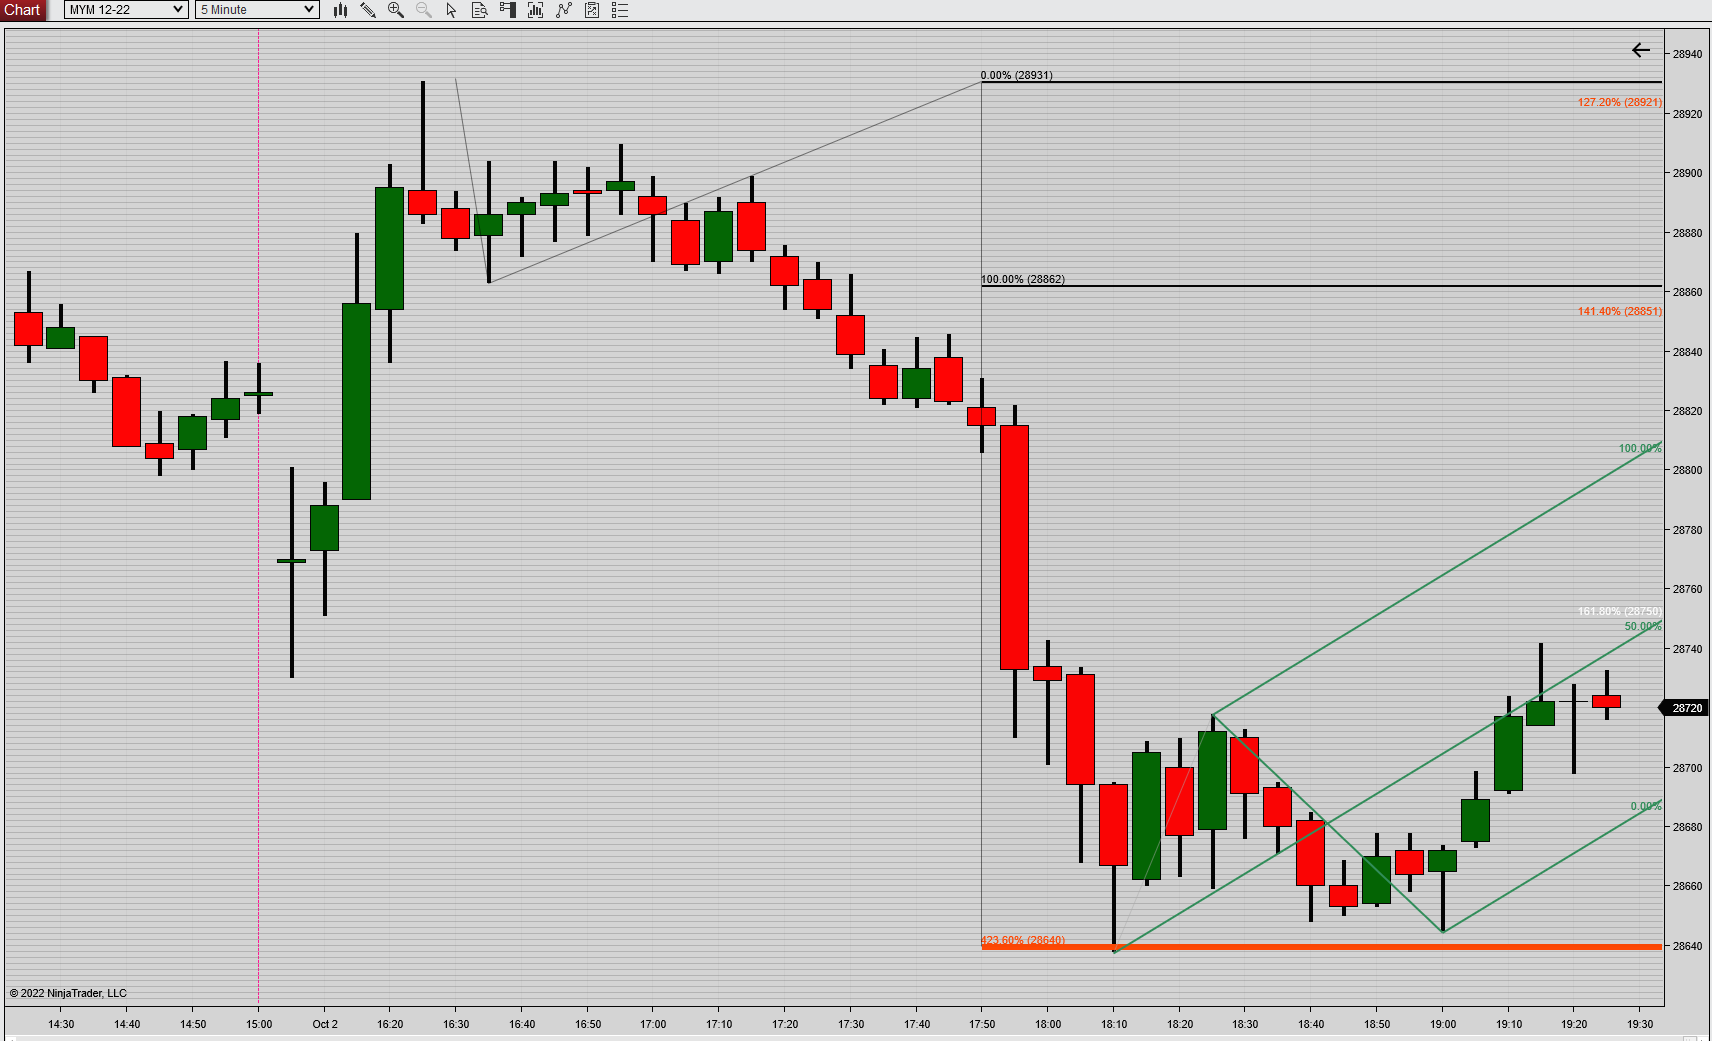
The week 7 count I referenced in my previous post did not hold (at least in the current night session, it may prove to hold at the day session open tomorrow), the Dow went straight to the 423 extension of the opening range in the current night session (I deem the 423 as being THE terminal extension)
Time will tell if it holds up ...
Color me impressed beyond expectations :