The Monday, 4pm ET USDA crop condition rating is always a huge one for the grains:
This was the latest one released this past Monday, July 11, 2022
https://www.marketforum.com/forum/topic/86945/
I'll take a wild first guess and say crop ratings drops a bit based on the lack of rain the past 7 days:
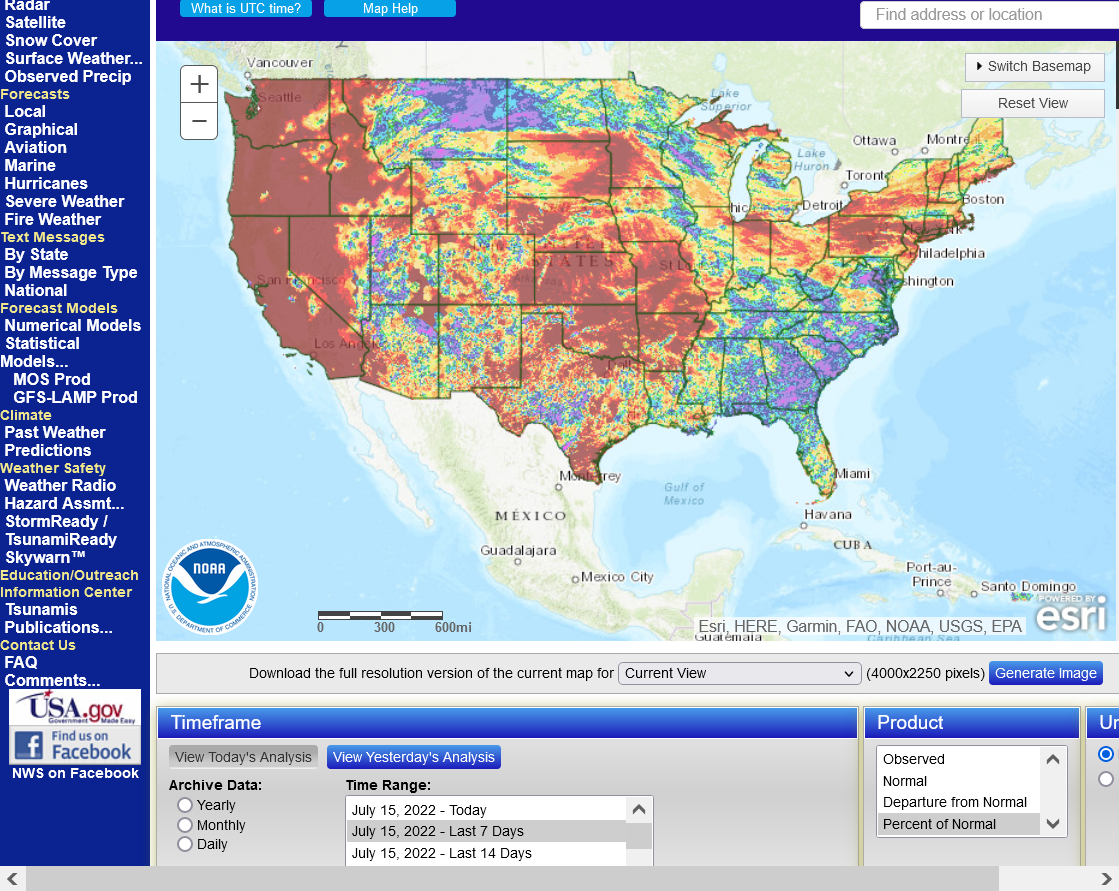
https://water.weather.gov/precip/
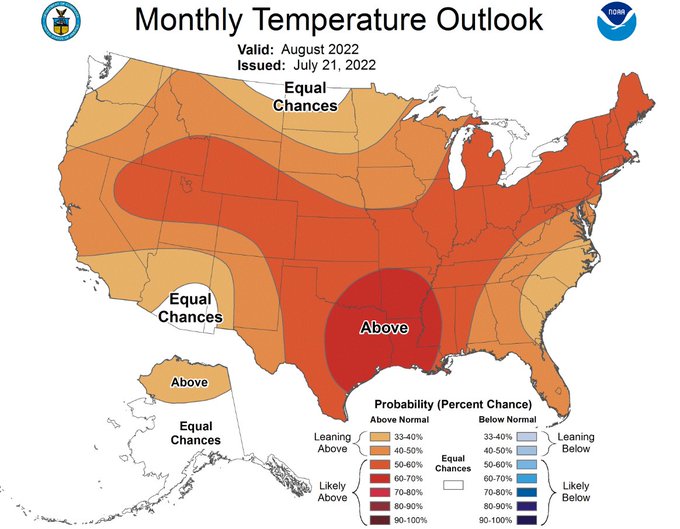
Temps were hot in the Plains but pleasant in the ECB!
https://www.cpc.ncep.noaa.gov/products/tanal/temp_analyses.php
More coming up later if I get the chance. All comments are very welcome, especially producers giving us what their backyard looks like.
Thanks in advance!
No rain and near record heat for Texas coming up was a likely factor in the limit up for cotton!
All the weather:
NE Ohio, I havent cut my grass in a month. On the upside, its easier to find a golfball in the rough at the local muni because the grass is dead. We have gotten a little rain, but it doesn't stop the smaller corns leaves from rolling up during the day.
Thanks Jim!
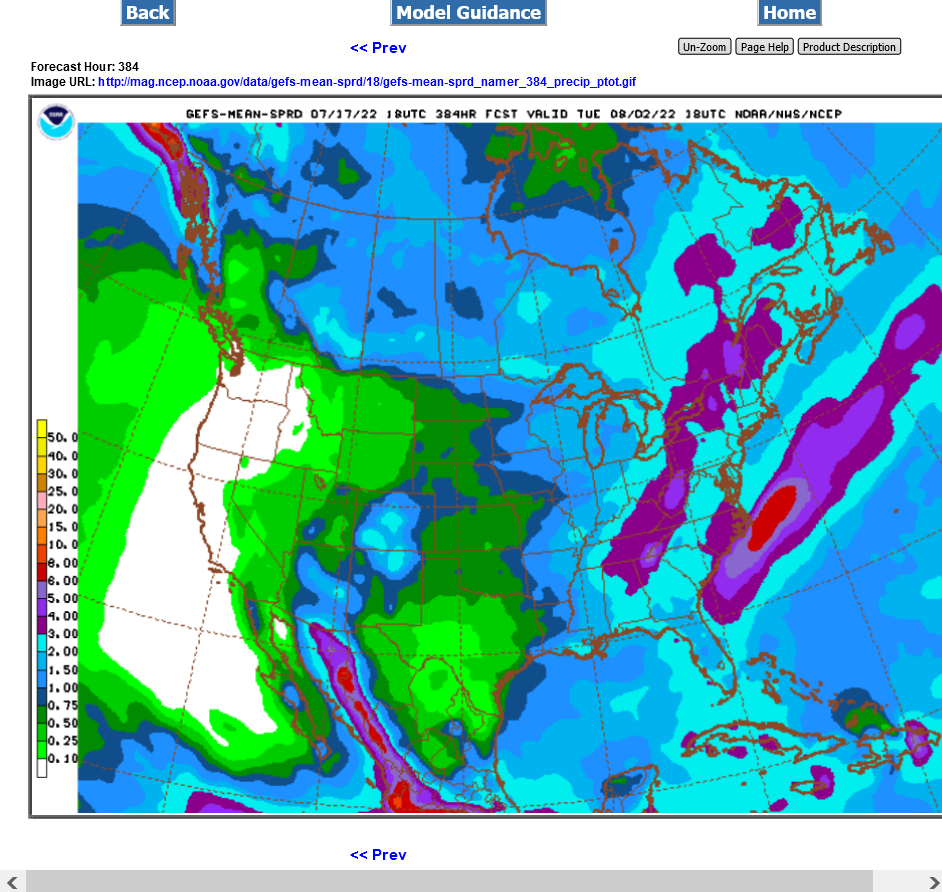
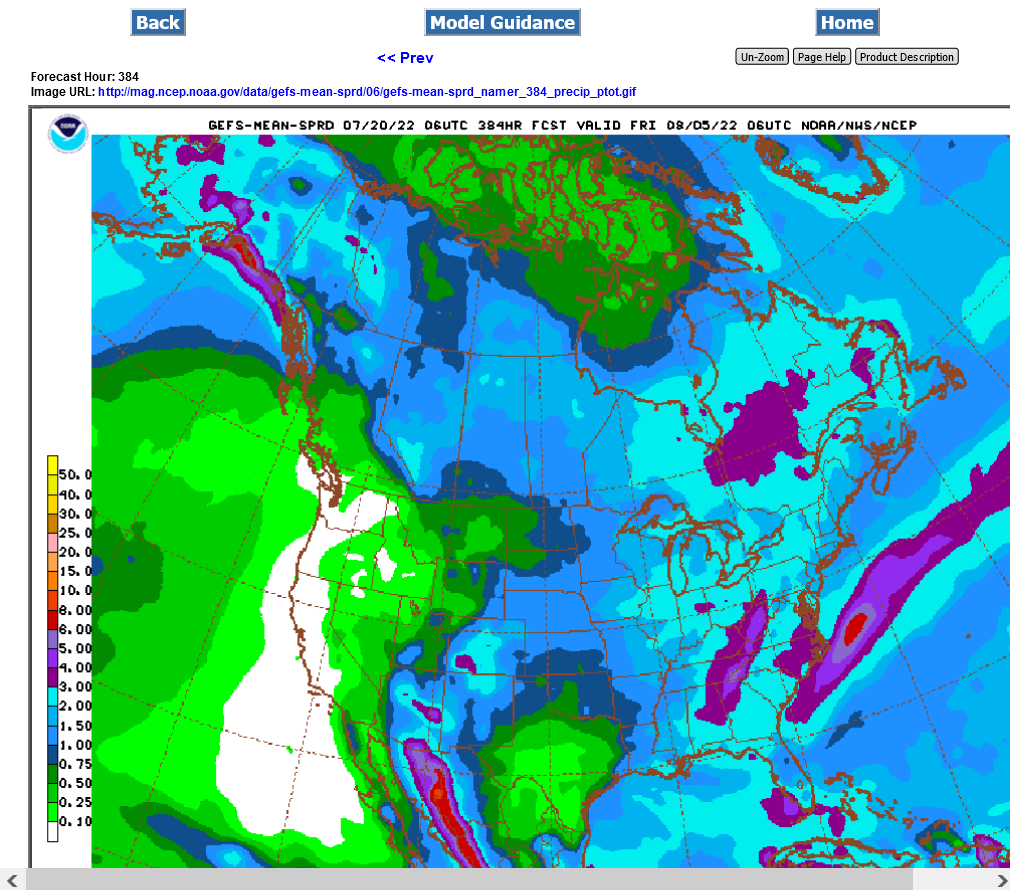
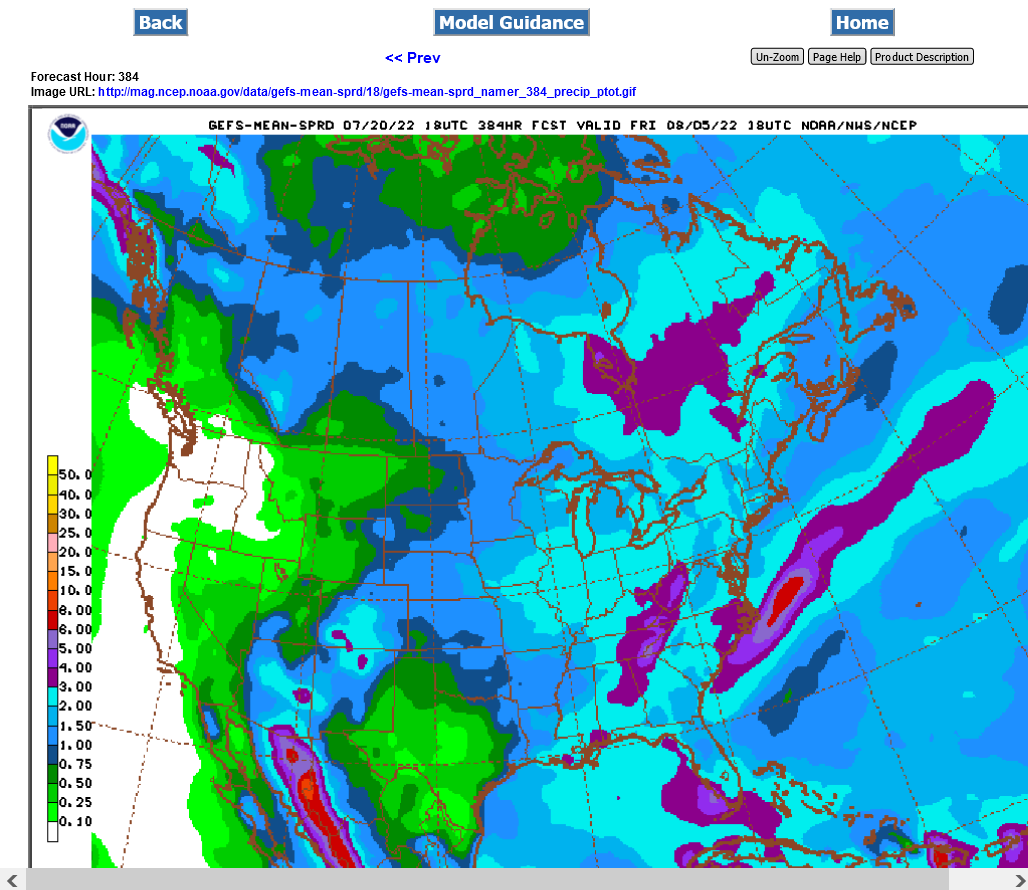
Here's the last GFS ensemble 2 week rain forecast. OK rains for the ECB.
However, WCB and Plains will be hurt without much rain and the most heat.
https://mag.ncep.noaa.gov/Image.php
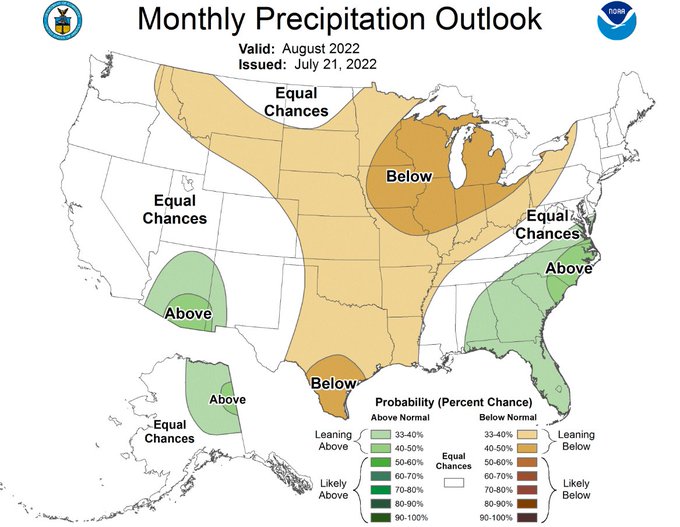
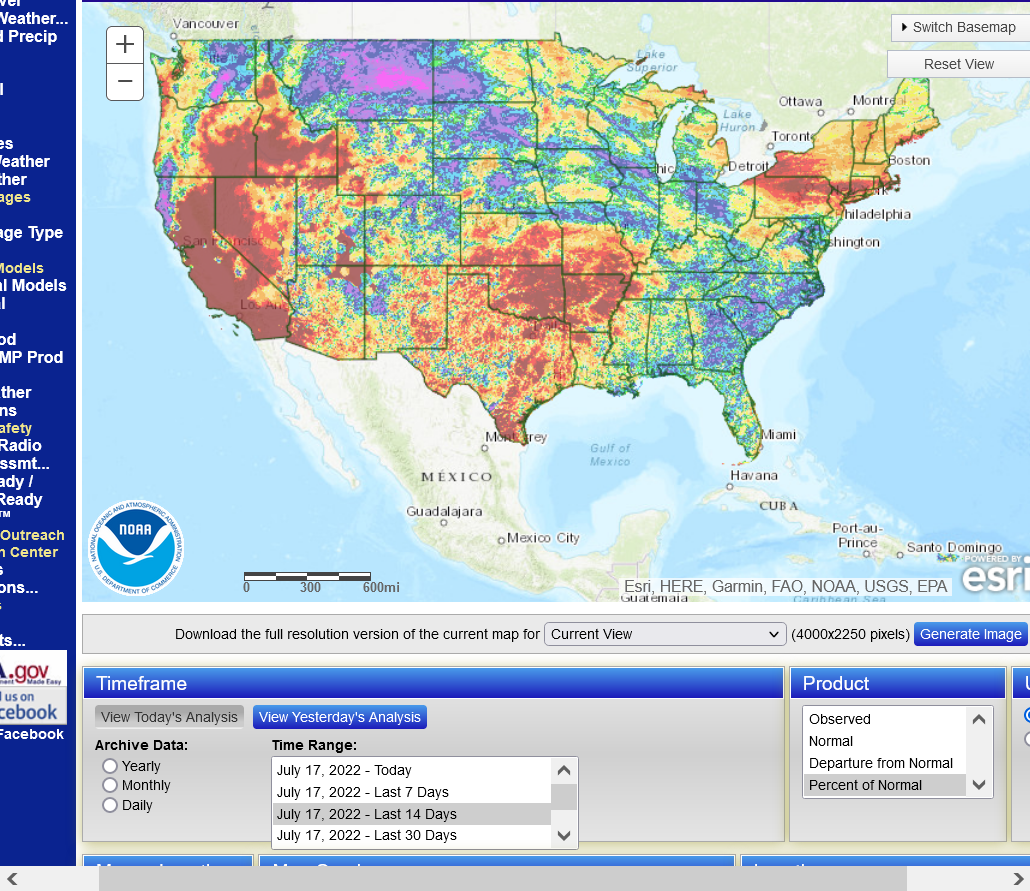
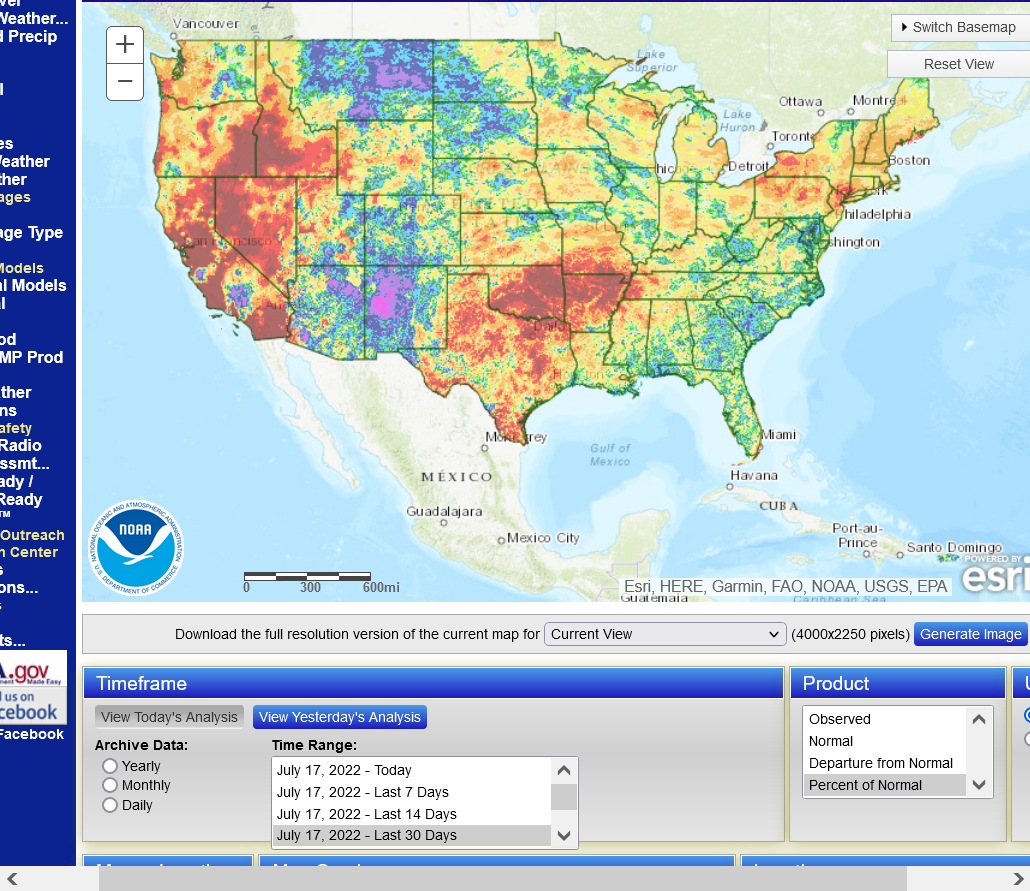
Rain maps below. The southwest Cornbelt to the S.Plains have not had much rain and will see another drop in the ratings on Monday. Other places will be mixed.
Rain % of normal the past 7 days.
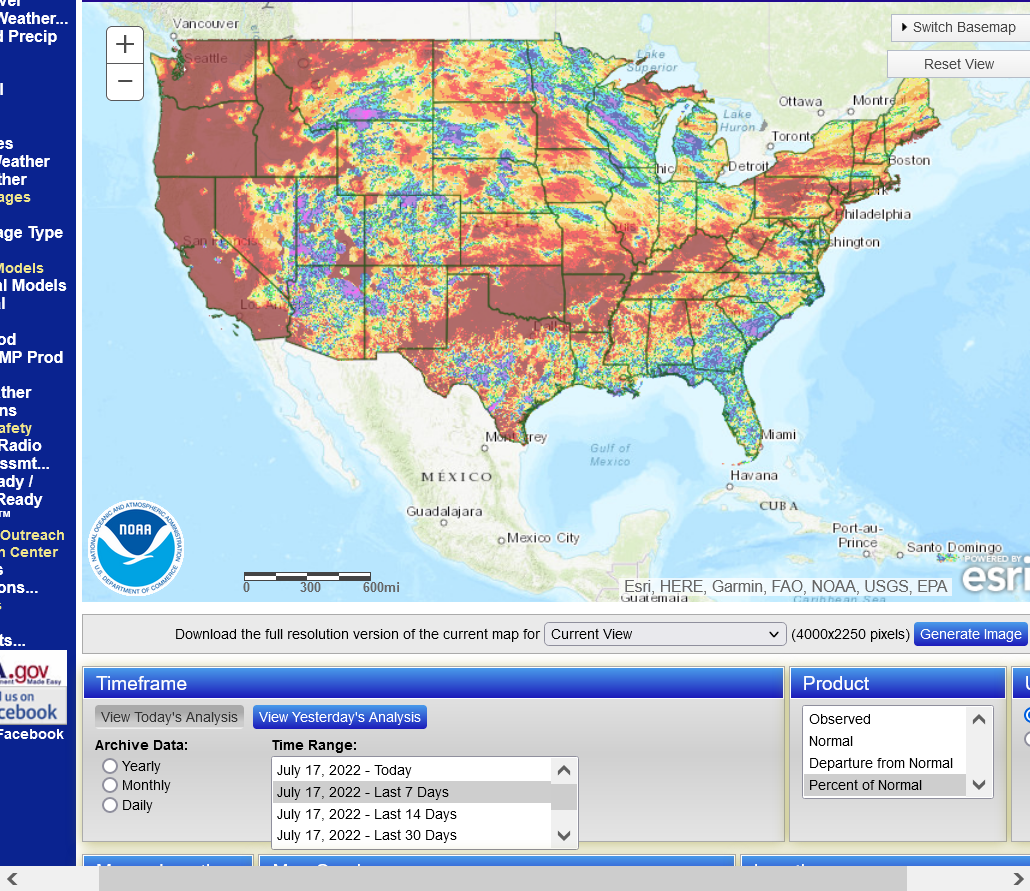
Rain % of normal the past 14 days:
Rain % of average the past 30 days:
Temperatures the past 7 days below:
Very warm to hot in the Plains and points westward back to the West Coast! Near average ECB, a bit below average Great Lakes to Southeast.
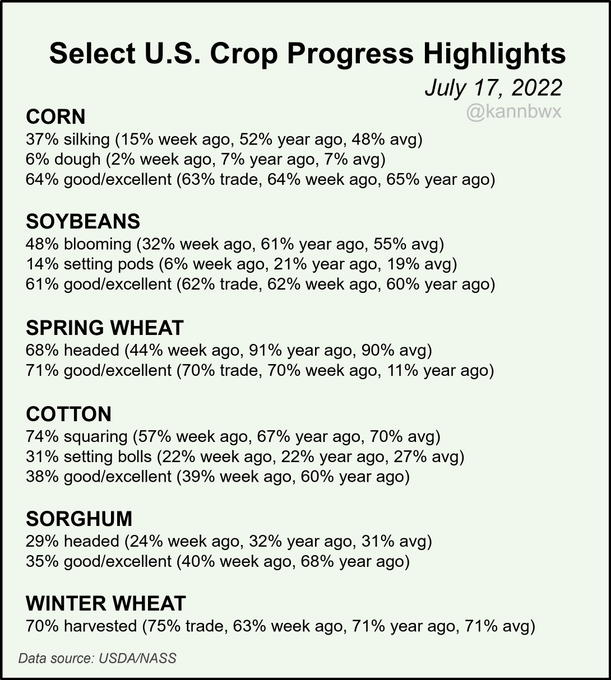
Here's the USDA. About as I expected.
https://release.nass.usda.gov/reports/prog3022.txt
Corn unch
Beans -1%
Wheat for coffeecloth +1%
Cotton -1% but VP was +2%.
Maybe the market thought it would be worse than that?
The big deal with wheat is 71% Gd/Ex this year compared to just 11% with last years severe drought!
Let's check on the details now:
Sorry but the market guessing the corn would be -1% and beans unch is out to lunch considering the locations where it was extremely hot and dry.
Beans had the MUCH tougher weather last week!
It's actually would not have been surprising if beans were down -2% or even more.
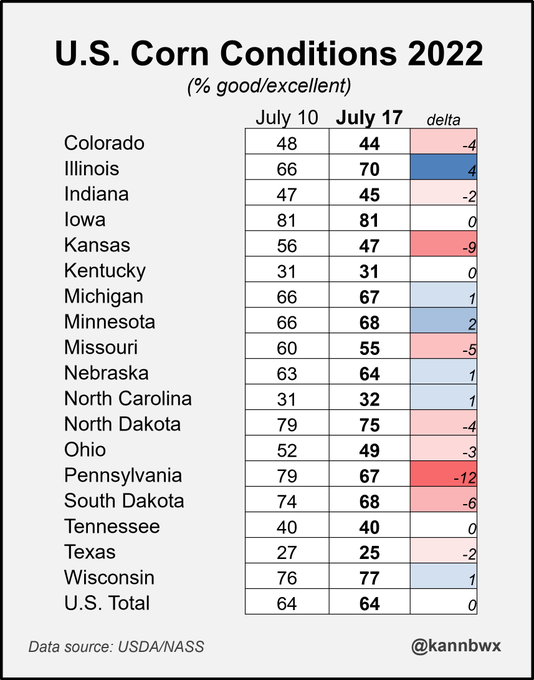
U.S. #corn conditions are unchanged at 64% good/excellent this week, #soybeans drop 1 pt to 61% good/exc and spring #wheat is up 1 to 71% g/e. Winter wheat harvest is 70% complete.
Conditions for #soybeans decline one point (though seems like it could have been more based on the number of reductions below).
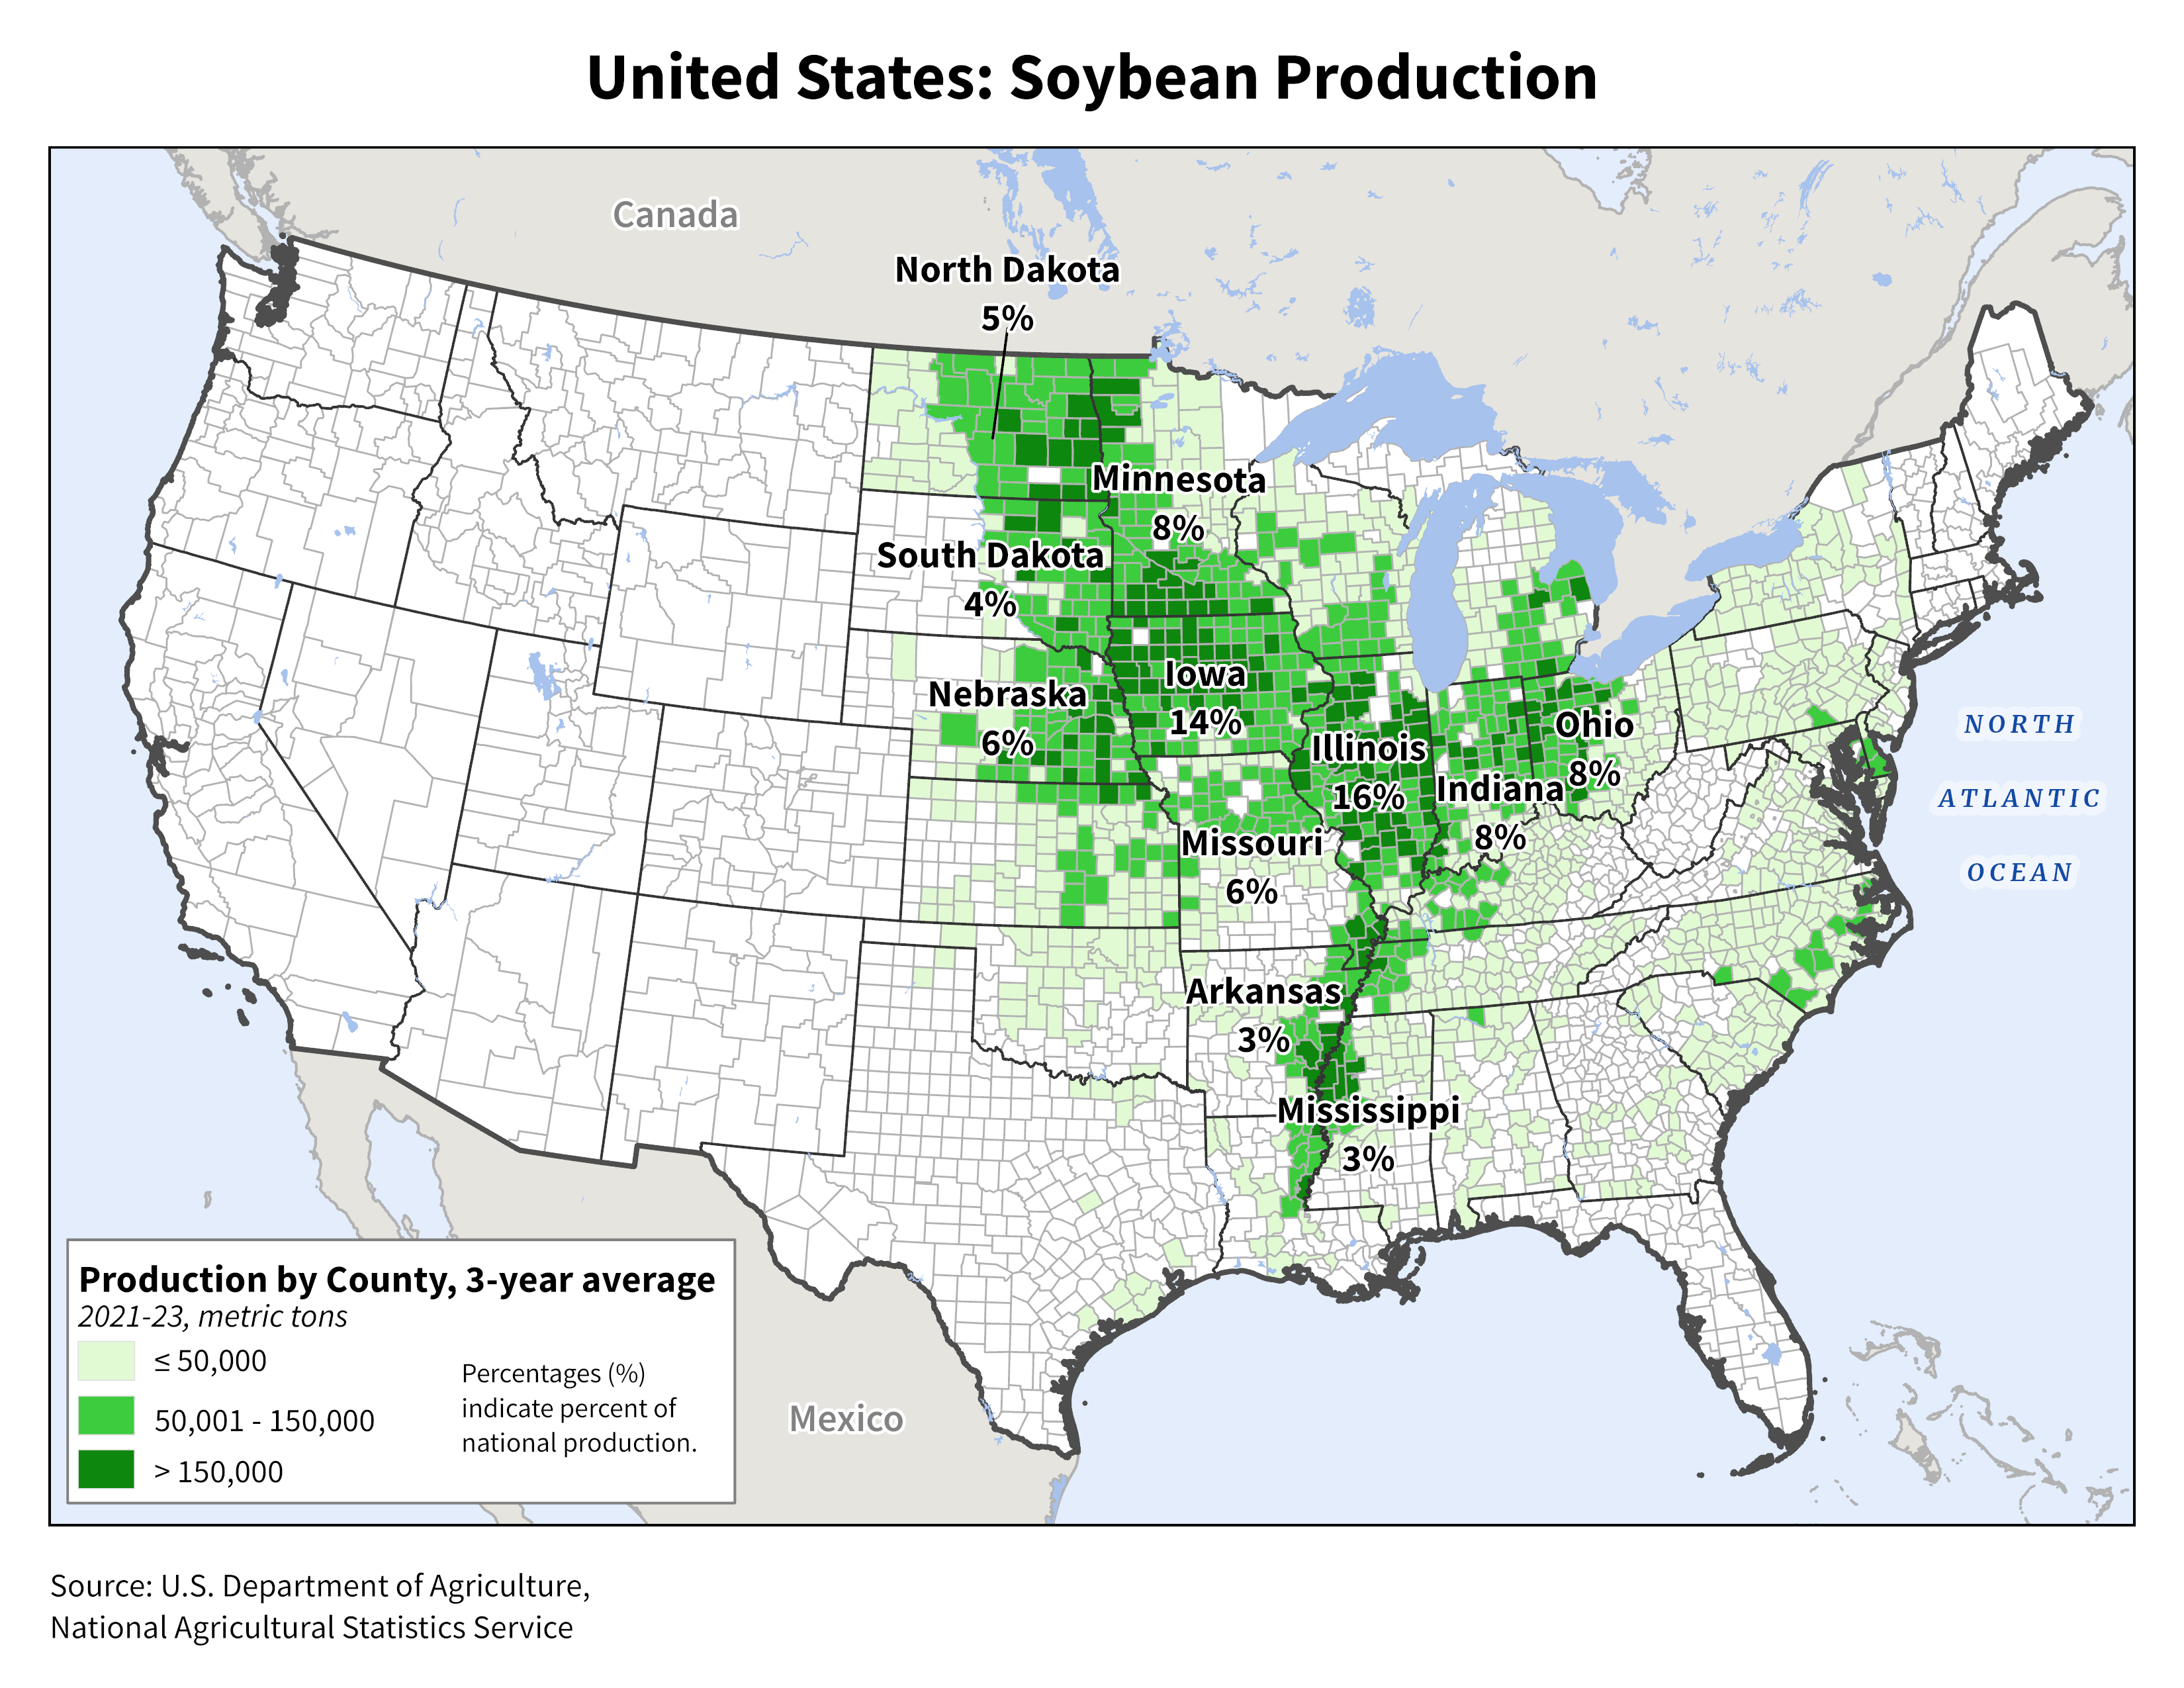
https://ipad.fas.usda.gov/rssiws/al/crop_production_maps/US/USA_Soybean.png
Improvements in Illinois and Minnesota kept U.S. #corn conditions unchanged on the week despite a steep slide in Kansas after a hot and dry week, and smaller declines in the Dakotas and Ohio.
https://www.nass.usda.gov/Charts_and_Maps/Crops_County/cr-yi.php
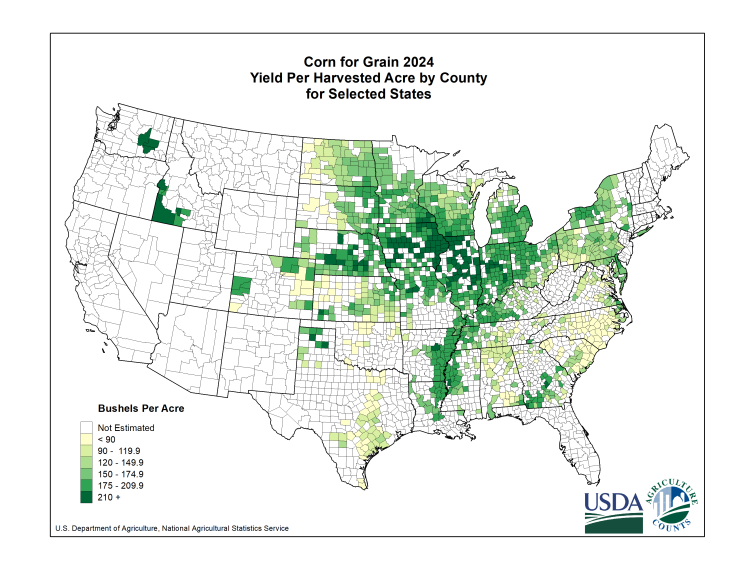
https://flowingdata.com/2021/11/29/map-made-of-candy-corn-to-show-corn-production/
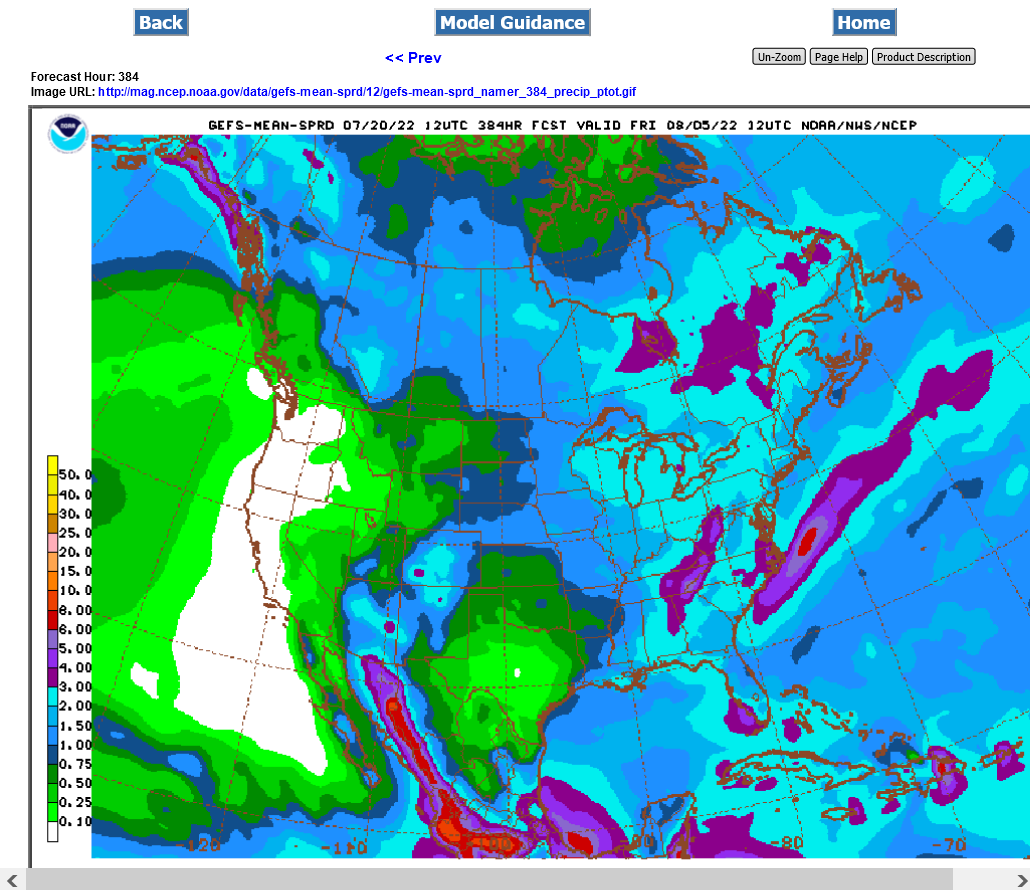
Rains have really increased on the last 2 GFS solutions:

Not surprisingly, the NWS this afternoon increased rain amounts in the Cornbelt a great deal on their week 2 guidance. Above average rain over some big areas:
https://www.marketforum.com/forum/topic/83844/#83852
https://www.cpc.ncep.noaa.gov/products/predictions/610day/
I have low confidence in this change and also, it could be transient.........as in last for a week or less, then go back to hot/dry.
However, it does get the crop a week closer to being "made" in the areas that get the above rains.
Too much rain in the forecast for grains to rally. This was the last 6z GFS ensemble rain forecast for the next 2 weeks:
Mike; Do you mean that the forecast is transient or the actual rain amounts will (could) turn dry after the end of this forecast?
I have low confidence in this change and also, it could be transient.........as in last for a week or less, then go back to hot/dry.
Great question, cutworm.
I answered that here:
https://www.marketforum.com/forum/topic/87308/#87313
The heat ridge rebuilds late in week 2 but much farther east, maybe along the East Coast to Northeast and back to the Midwest.
But East Coast ridges pump in alot of moisture on the backside into the Midwest.
With pollination being mostly over by then, we will see kernel filling for all of the corn crop.....HIGH heat will kill yields because it causes maturity at such a rapid pace that it lessens the time for the plant to fill the kernels with all the energy that we grow/use corn for(to feed animals for instance)
Cool weather = plump kernels
Hot weather = small kernels
Ideal filling is:
1. COOL with ample rains
2. After that, COOL and dry.
3. After that HOT (heat fill) and wet.......which is not ideal at all, even with good rains.
4. The worst is HOT and dry.
Heat fill is always bad news, especially if some areas are dry.
Heat fill with good rains will feature a green, good looking plant from the window observation and good ratings. But hidden inside of the husk, (until harvest) are rapidly filling kernels that are SMALL compared the exact same stage of the corn plant with COOL temperatures, along with GDD's and heat units accumulating at a slower pace.
Here are some links to past posts about heat fill. I added the best info below that so you don't have to go searching thru all that.
https://www.marketforum.com/forum/topic/86953/#87109
https://www.pioneer.com/us/agronomy/high-night-temps-yield.html

Figure 1. Daily minimum temperatures (7-day moving average) for Des Moines, IA, in 2009 and 2010, and 30-yr average minimum daily temperatures (1981-2010). Approximate dates of 10%, 50%, and 90% silking in Iowa in 2009 and 2010 based on USDA crop progress reports.
 in Iowa, Illinois, Missouri, Kansas and Nebraska.")
 in Iowa, Illinois, Missouri, Kansas and Nebraska.")
Figure 2. Average minimum temperatures experienced in July-August of 2009 (top) and 2010 (above) and average yields (bu/acre) in Iowa, Illinois, Missouri, Kansas and Nebraska. Data from NCEI NOAA, USDA NASS.
+++++++++++++++++++++++++++++++++++++++++++ICM News
by Roger Elmore, Department of Agronomy
"October corn yield forecast for Iowa dropped to 169 bushels per acre, a significant reduction from the August and September forecasts of 179 bushels per acre (see October USDA-NASS forecast). If realized, 2010 yields will rank sixth among the last seven years, higher only than the yields of 2006 (166 bushels per acre). Numerous published and anecdotal yield reports substantiate lower than expected yields this year.
In previous 2010 Integrated Crop Management News articles, we've addressed 2010 conditions and the possibility of reduced yields resulting from rapid crop development following silking (see September 28 article). Statewide Growing Degree Day accumulations were 116 percent of normal during most of the seed fill period — silk to dent — this year."
Table 2. Effect of temperature on grain fill duration, grain weight per plant and kernel number (Badu-Apraku et al., 1983).

The last GFS ensemble was not as wet in IA/IL/IN........the I states.
The western flank of the 2+ inch rain band has shifted north by around 500 miles into WI/MI compared to the previous run.
This takes around .5" of rain away from those states..........not dry but DRIER in those key locations.
The European model that came out later this afternoon actually has MORE rain in those same places and looks more like the PREVIOUS GFS Ensemble.
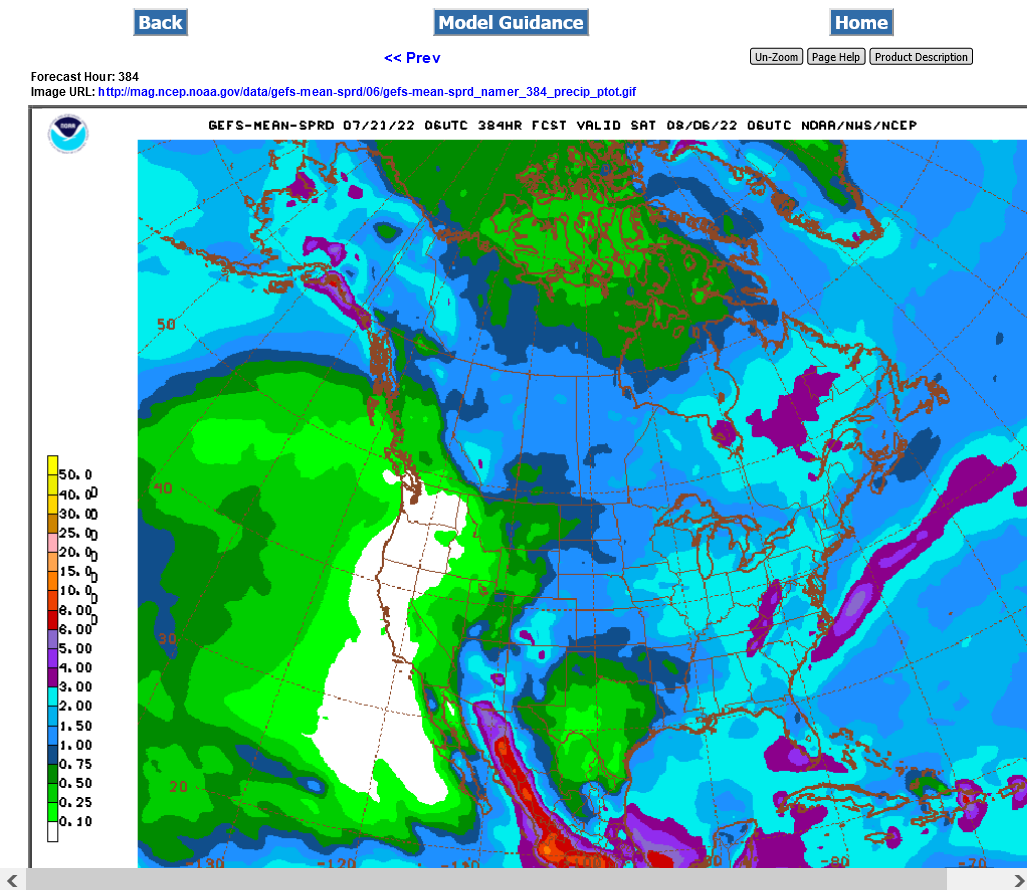
Last 18z GFS was back to wetter again. Maybe the wettest yet.
Light blue is 2"+
Continued big rains on the last 6z GFS Ensemble. Corn doesn't want to go lower as easy as beans. Heat fill?
Just updated this morning.
https://www.cpc.ncep.noaa.gov/products/predictions/30day/
This would be bullish for C and S.......but we have the big rains before then.
12z GFS just ADDED more rain for IL, IN and MO!