KEY EVENTS TO WATCH FOR:
Wednesday, July 27, 2022
7:00 AM ET. MBA Weekly Mortgage Applications Survey
Composite Idx (previous 281.1)
Composite Idx, W/W% (previous -6.3%)
Purchase Idx-SA (previous 208)
Purchase Idx-SA, W/W% (previous -7.3%)
Refinance Idx (previous 655.7)
Refinance Idx, W/W% (previous -4.3%)
8:30 AM ET. June Advance Report on Durable Goods
Durable Goods-SA, M/M% (expected -0.4%; previous +0.7%)
Durable Goods, Ex-Defense, M/M% (previous +0.6%)
Dur Goods, Ex-Transport, M/M% (previous +0.7%)
Orders: Cap Gds, Non-Def, Ex-Air, M/M% (previous +0.5%)
Shipmnts: Cap Gds, Non-Def, Ex-Air, M/M%(previous +0.8%)
8:30 AM ET. June Advance Economic Indicators Report
10:00 AM ET. June Pending Home Sales Index
Pending Home Sales (expected -1.0; previous 99.9)
Pending Home Sales Idx, M/M% (previous +0.7%)
Pending Home Sales Idx , Y/Y% (previous -13.6%)
10:30 AM ET. EIA Weekly Petroleum Status Report
Crude Oil Stocks (Bbl) (previous 426.609M)
Crude Oil Stocks, Net Chg (Bbl) (expected -0.7M; previous -0.445M)
Gasoline Stocks (Bbl) (previous 228.435M)
Gasoline Stocks, Net Chg (Bbl) (expected -0.1M; previous +3.498M)
Distillate Stocks (Bbl) (previous 112.508M)
Distillate Stocks, Net Chg (Bbl) (expected +0.2M; previous -1.295M)
Refinery Usage (expected 94.1%; previous 93.7%)
Total Prod Supplied (Bbl/day) (previous 21.025M)
Total Prod Supplied, Net Chg (Bbl/day) (previous +2.305M)
2:00 PM ET. U.S. interest rate decision
Federal Funds Rate
Federal Funds Rate Change (Pts)
Fed Funds Rate-Range High (previous 1.75)
Fed Funds Rate-Range Low (previous 1.50)
FOMC Vote For Action (previous 10)
FOMC Vote Against Action (previous 1)
Discount Rate (previous 1.75)
Discount Rate Change (Pts) (previous +0.75)
Discount Rate-Range High
Discount Rate-Range Low
4:00 PM ET. SEC Closed Meeting
The STOCK INDEXES? http://quotes.ino.com/ex?changes/?c=indexes
The STOCK INDEXES: The September NASDAQ 100 was higher overnight as it consolidates some of the decline off last-Friday's high. Overnight trading sets the stage for a steady to higher opening when the day session begins trading. Stochastics and the RSI are neutral to bearish signaling that sideways to lower prices are possible near-term. Closes below the 20-day moving average crossing at 12,025.38 would signal that a short-term top has been posted. If September renews the rally off June's low, June's high crossing at 12,973.75 is the next upside target. First resistance is last-Friday's high crossing at 12,698.50. Second resistance is June's high crossing at 12,973.75. First support is the 20-day moving average crossing at 12,025.38. Second support is the July 13th low crossing at 11,479.25. Third support is the June 30th low crossing at 11,351.00.
The September S&P 500 was higher overnight and sets the stage for a higher opening when the day session begins trading.Stochastics and the RSI are neutral to bearish signaling that sideways to lower prices are possible near-term. Closes below the 20-day crossing at 3881.05 would signal that a short-term top has been posted. Closes above last-Friday's high crossing at 4016.25 would renew the rally off June's low and set the stage for a test of the 38% retracement level of the January-June decline crossing at 4078.81. First resistance is the 38% retracement level of the January-June decline crossing at 4078.81. Second resistance is the 50% retracement level of the January-June decline crossing at 4215.81 First support is the 20-day moving average crossing at 3880.97. Second support is the July 14th low crossing at 3723.75.
INTEREST RATES http://quotes.ino.com/ex changes/?c=interest"
INTEREST RATES: September T-bonds were steady to lower overnight. The mid-range overnight trade sets the stage for a steady to lower opening when the day session begins trading. Stochastics and the RSI are overbought but remain neutral to bullish signaling that sideways to higher prices are possible near-term. If September extends the rally off June's low, the 38% retracement level of the 2021-2022 decline crossing at 143-25 is the next upside target. Closes below the 50-day moving average crossing at 138-05 would confirm that a short-term top has been posted. First resistance is Tuesday's high crossing at 143-11. Second resistance is the 38% retracement level of the 2021-2022 decline crossing at 143-25. First support is the 50-day moving average crossing at 138-05. Second support is the July 11th low crossing at 136-24. Third support is June's low crossing at 131-01.
September T-notes was steady to lower overnight as it consolidates below July's high crossing at 120.165. Overnight trading sets the stage for a steady to slightly lower opening when the day session begins trading. Stochastics and the RSI remain neutral to bullish signaling that sideways to higher prices are possible near-term. If September extends the rally off last-Thursday's low, the 38% retracement level of the 2021-2022 decline crossing at 120.209 is the next upside target. Closes below last-Thursday's low crossing at 117.145 would confirm that a short-term top has been posted while opening the door for additional weakness near-term. First resistance is the 38% retracement level of the 2021-2022 decline crossing at 120.209. Second resistance is the 50% retracement level of the 2021-2022 decline crossing at 122.204 is the next downside target. First support is last-Thursday's low crossing at 117.145. Second support is the June 28th low crossing at 116.110.
ENERGY MARKETS? http://quotes.ino.com/ex?changes/?c=energy ""
ENERGIES:September crude oil was higher overnight. Overnight trading sets the stage for a steady to higher opening when the day session begins trading. Stochastics and the RSI are turning neutral to bullish signaling that sideways to higher prices are possible near-term. If September renews the rally off the July 14th low, the 50-day moving average crossing at $104.48 is the next upside target. If September renews the decline off June's high, the 38% retracement level of the 2020-2022 rally crossing at $86.43 is the next downside target. First resistance is the 20-day moving average crossing at $98.11. Second resistance is the 50-day moving average crossing at $104.48. First support is July 14th low crossing at $88.23. Second support is the 38% retracement level of the 2020-2022 rally crossing at $86.43.
September heating oil was higher overnight as it extends this month's trading range. Overnight trading sets the stage for a steady to higher opening when the day session begins trading. Stochastics and the RSI have turned neutral to bullish signaling that sideways to higher prices are possible near-term. Closes above the 50-day moving average crossing at $3.7935 would signal that a short-term low has been posted while opening the door for additional gains near-term. If September renews the decline off June's high, the 38% retracement level of the 2020-2022 rally crossing at $3.1874 is the next downside target. First resistance is the 50-day moving average crossing at $3.7935. Second resistance is the July 1st high crossing at $3.9461. First support is the July 6th low crossing at $3.2946. Second support is the 38% retracement level of the 2020-2022 rally crossing at 3.1874.
September unleaded gas was higher overnight as it extends the rally off last-Thursday's low. Overnight trading sets the stage for a steady to higher opening when the day session begins trading. Stochastics and the RSI have turned neutral to bullish signaling that sideways to higher prices are possible near-term. Closes above the 20-day moving average crossing at 3.1843 would signal that a short-term low has been posted. If September renews the decline off June's high, the 38% retracement level of the 2020-2022 rally crossing at 2.8073 is the next downside target. First resistance is the 20-day moving average crossing at 3.1843. Second resistance is the 50-day moving averagecrossing at $3.4341. First support is the 38% retracement level of the 2020-2022 rally crossing at 2.8073. Second support is the 50% retracement level of the 2020-2022 rally crossing at 2.4586.
September Henry natural gas was steady to slightly higher overnight as it extends the rally off July's low. Overnight trading sets the stage for a steady to higher opening when the day session begins trading. Stochastics and the RSI are overbought but remain neutral to bullish signaling that sideways to higher prices are possible near-term. If September extends the rally off July's low, June's high crossing at 9.598 is the next upside target. Closes below the 20-day moving average crossing at 6.893 would signal that a short-term top has been posted. First resistance is Tuesday's high crossing at 9.419. Second resistance is June's high crossing at 9.598. First support is the 10-day moving average crossing at 7.810. Second support is the 20-day moving average crossing at 6.891.
CURRENCIEShttp://quotes.ino.com/ex changes/?c=currencies"
CURRENCIES:The September Dollar was steady to lower overnight as it extends the trading range of the past six-days. Overnight trading sets the stage for a steady to lower opening when the day session begins trading. Stochastics and the RSI remain neutral to bearish signaling that sideways to lower prices are possible near-term. If September extends the decline off July's high, the 50-day moving average crossing at $104.577 is the next downside target. If September renews this year's rally, the 87% retracement level of the 2001-2008 decline on the monthly continuation chart crossing at $114.782 is the next upside target.First resistance is the July 14th high crossing at $109.140. Second resistance is the 87% retracement level of the 2001-2008 decline on the monthly continuation chart crossing at $114.782. First support is last-Friday's low crossing at $105.990. Second support is the 50-day moving average crossing at $104.577.
The September Euro was higher overnight as it consolidates some of Tuesday's decline. The high-range overnight trade sets the stage for a steady to higher opening when the day session begins trading. Stochastics and the RSI are neutral to bullish signaling that sideways to higher prices are possible near-term. Closes above the July 21st high crossing at $1.03200 would signal that a short-term low has been posted while opening the door for additional gains near-term. If September renews the decline off May's high, the December 2002 low on the monthly continuation chart crossing at $0.98540 is the next downside target. First resistance is the July 21st high crossing at $1.03200. Second resistance is the 50-day moving average crossing at $1.04940. First support is the July 14th low crossing at $1.00000. Second support is the December 2002 low on the monthly continuation chart crossing at $0.98540.
The September British Pound was steady to higher overnight as it extends the rally off the July 14th low. Overnight trading sets the stage for a steady to higher opening when the day session begins trading. Stochastics and the RSI are neutral to bullish signaling that sideways to higher prices are possible near-term. If September extends the rally off July's low, the 50-day moving average crossing at 1.2248 is the next upside target. If September renews this year's decline, the March-2020 low on the monthly continuation chart crossing at 1.1438 is the next downside target. First resistance is the 50-day moving average crossing at 1.2248. Second resistance is the 25% retracement level of the 2021-2022 decline crossing at 1.2385. First support is the July 14th low crossing at 1.1778. Second support is the March-2020 low on the monthly continuation chart crossing at 1.1438.
The September Swiss Franc was steady to higher overnight and remains poised to extend the rally off the July 14th low. The high-range overnight trade sets the stage for a steady to higher opening when the day session begins trading. Stochastics and the RSI are neutral to bullish signaling that sideways to higher prices are possible near-term. If September extends the rally off the July 14th low, the June 29th high crossing at 1.05910 is the next upside target. Closes below the 10-day moving average crossing at 1.03555 would signal that a short-term top has been posted. If September renews the decline off June's high, June's low crossing at 1.00235 is the next downside target. First resistance is last-Friday's high crossing at 1.04620. Second resistance is June's high crossing at 1.05910. First support is the July 14th low crossing at 1.01650. Second support is June's low crossing at 1.00235.
The September Canadian Dollar was higher overnight and the high-range overnight trade sets the stage for a steady to higher opening when the day session begins trading. Stochastics and the RSI are overbought but remain neutral to bullish signaling that sideways to higher prices are possible near-term. Closes above the June 28th high crossing at $78.02 would open the door for additional gains near-term. Closes below the 20-day moving average crossing at $77.24 would signal that a short-term top has been posted. First resistance is the June 28th high crossing at $78.02. Second resistance is the 62% retracement level of the April-July decline crossing at 78.67. First support isthe 20-day moving average crossing at $77.24. Second support is July's low crossing at $75.61.
The September Japanese Yen was steady to slightly higher overnight and sets the stage for a steady to higher opening when the day session begins trading. Stochastics and the RSI remain neutral to bullish signaling that sideways to higher prices are possible near-term. If September extends the rally off July's low, the 50-day moving average crossing at 0.075207 is the next upside target. If September renews the decline off May's high, the August-1998 low on the monthly continuation chart crossing at 0.068730 is the next downside target. First resistance is last-Friday's high crossing at 0.074075. Second resistance is the 50-day moving average crossing at 0.075207. First support is July's low crossing at 0.072085. Second support is the September-1990 low on the monthly continuation chart crossing at 0.072160.
PRECIOUS METALS http://quotes.ino.com/ex changes/?c=metals"
PRECIOUS METALS: Augustgold was steady to slightly higher overnight. Overnight trading sets the stage for a steady to higher opening when the day session begins trading. Stochastics and the RSI remain neutral to bullish signaling that sideways to higher prices are possible near-term. Closes above the 20-day moving average $1736.40 would signal that a short-term low has been posted. If August renews the decline off June's high, the March-2021 low on the monthly continuation chart crossing at $1673.30 is the next downside target. First resistance is the 20-day moving average $1736.40. Second is the 50-day moving average crossing at $1800.40. First support is last-Thursday's low crossing at $1678.40. Second support is the March-2021 low on the monthly continuation chart crossing at $1673.30.
September silver was steady to slightly higher overnight as it extends this month's trading range. The high-range trade sets the stage for a steady to higher opening when the day session begins trading later this morning. Stochastics and the RSI have turned neutral to bullish signaling that sideways to higher prices are possible near-term. Closes above the 20-day moving average crossing at $19.037 would signal that a short-term low has been posted. If September renews the decline off March's high, the June-2020 low on the weekly continuation chart crossing at $17.015 is the next downside target. First resistance is the 20-day moving average crossing at 19.037. Second resistance is the 50-day moving average crossing at 20.675. First support is the July 14th low crossing at $18.010. Second support is the June-2020 low on the weekly continuation chart crossing at $17.015.
September copper was steady to higher overnight as it extends the rally off July's low. Overnight trading sets the stage for a higher opening when the day session begins trading. Stochastics and the RSI remain neutral to bullish signaling that sideways to higher prices are possible near-term. Closes above the 20-day moving average crossing at 3.4130 would signal that a short-term low has been posted. If September renews the decline off June's high, the 75% retracement level of the 2020-2022 rally crossing at 2.8770 is the next downside target. First resistance is the 20-day moving average crossing at 3.4130. Second resistance is the June 28th high crossing at 3.8500. First support is the July 15th low crossing at 3.1315. Second support is the 75% retracement level of the 2020-2022 rally crossing at 2.8770.
GRAINS http://quotes.ino.com/ex changes/?c=grains
December corn was higher overnight as it extends the rally off last-Friday's low. Overnight trading sets the stage for a steady to higher opening when the day sessions begins trading. Stochastics and the RSI have turned neutral to bullish signaling that sideways to higher prices are possible near-term. Closes above last-Monday's high crossing at $6.23 3/4 would signal that a short-term low has been posted while opening the door for additional gains near-term. If December renews the decline off June's high, January low crossing at $5.42 1/2 is the next downside target. First resistance is last-Monday's high crossing at $6.23 3/4. Second resistance is the July 11th high crossing at $6.58 1/2. First support is the 50% retracement level of the 2020-2022 rally crossing at $5.74 3/4. Second support is the January low crossing at $5.42 1/2.
September wheat was higher overnight as it consolidates some of the decline off May's high. Overnight trading sets the stage for a higher opening when the day session begins trading. Stochastics and the RSI are oversold but are turning neutral to bullish signaling that sideways to higher prices are possible near-term. Closes above last-Wednesday's high crossing at $8.43 1/2 would signal that a short-term low has been posted. If September renews the decline off May's high, the 75% retracement level of the January-May high crossing at $7.23 is the next downside target. First resistance is last-Wednesday's high crossing at $8.43 1/2. Second resistance is the July 11th high crossing at $9.40 1/4. First support is the last-Friday's low crossing at $7.54. Second support is the 75% retracement level of the January-May high crossing at $7.23.
September Kansas City wheat was higher overnight as it consolidates some of the decline off May's high. Overnight trading sets the stage for a higher opening when the day session begins trading later this morning. Stochastics and the RSI are turning neutral to bullish signaling that sideways to higher prices are possible near-term. Closes above the July 11th high crossing at $9.98 1/4 are needed to confirm that a short-term low has been posted. If September extends the decline off May's high, February's low crossing at $7.64 1/2 the next downside target. First resistance is the 20-day moving average crossing at $8.81 1/2. Second resistance is the July 11th high crossing at $9.98 1/4. First support is the 62% retracement level of the January-May rally crossing at $8.32 3/4. Second support is the February's low crossing at $7.64 1/2.
September Minneapolis wheat was higher overnight as it consolidates some of last-Friday's decline. Overnight trading sets the stage for a higher opening when the day session begins trading. Stochastics and the RSI are oversold but are turning neutral to bullish signaling that sideways to higher prices are possible near-term. Closes above last-Wednesday's high crossing at $9.56 would signal that a short-term low has been posted. If September extends the decline of May's high, the 75% retracement level of the January-May rally crossing at $8.12 3/4 is the next downside target. First resistance is last-Wednesday's high crossing at $9.56. Second resistance is the July 11th high crossing at $10.44 1/2. First support is last-Friday's low crossing at $8.69 1/4. Second support is the 75% retracement level of the January-May high crossing at $8.12 3/4.
SOYBEAN COMPLEX? http://quotes.ino.com/ex?changes/?c=grains "
November soybeans was higher overnight as it extends the rally off last-Friday's low. Overnight trading sets the stage for a higher opening when the day session begins trading. Stochastics and the RSI are bullish signaling that sideways to higher prices are possible near-term. Closes above last-Monday's high crossing at $13.93 would signal that a short-term low has been posted while opening the door for additional gains near-term. Closes below Tuesday's gap crossing at $13.49 1/4 would temper the near-term friendly outlook. If November renews the decline off June's high, the January 18th crossing at $12.76 is the next downside target. First resistance is last-Monday's high crossing at $13.93. Second resistance is the July 11th high crossing at $14.38 1/2. First support is the 38% retracement level of the 2020-2022 rally crossing at $12.99 1/4. Second support is the January 18th low crossing at $12.76.
December soybean meal was steady to slightly lower overnight as it consolidates some of the rally off last-Friday's low. The high-range trade overnight sets the stage for a steady to higher opening when the day session begins trading. Stochastics and the RSI are becoming overbought but remain neutral to bullish signaling that sideways to higher prices are possible near-term. If December extends this week's rally, April's high crossing at $429.60 is the next upside target. Closes below the 20-day moving average crossing at $396.10 would temper the near-term bullish outlook. First resistance is Tuesday's high crossing at $419.20. Second resistance is April's high crossing at $429.60. First support is last-Friday's low crossing at $380.80. Second support is July's low crossing at $375.30.
December soybean oil was higher overnight while extending July's trading range. The high-range overnight trade sets the stage for a steady to higher opening when the day session begins trading. Stochastics and the RSI have turned neutral to bullish signaling that sideways to higher prices are possible near-term. Closes above the July 11th high crossing at 62.65 would mark an upside breakout of July's trading range while opening the door for additional short-term gains. If December renews the decline off June's high, the 50% retracement level of the 2020-2022 rally crossing at 53.93 is the next downside target. First resistance is the July 11th high crossing at 62.65. Second resistance is the June 29th high crossing at 67.76. First support is the July 14th low crossing at 54.42. Second support is the 50% retracement level of the 2020-2022 rally crossing at 53.93.
LIVESTOCKhttp://quotes.ino.com/exchanges/?c=livestock
August hogs closed down $0.23 at $117.00.
August hogs closed lower on Tuesday as it consolidated some of the rally off June's low. The mid-range close sets the stage for a steady to lower opening when Wednesday's session begins trading. Stochastics and the RSI are overbought but remain neutral to bullish signaling that sideways to higher prices are possible near-term. If August extends the aforementioned rally, April's high crossing at $121.25 is the next upside target. Closes below the 20-day moving average crossing at $110.13 would signal that a short-term top has been posted. First resistance is last-Friday's high crossing at $118.90. Second resistance is April's high crossing at $121.25. First support is the 10-day moving average crossing at $113.90. Second support is the 20-day moving average crossing at $110.13.
October cattle closed down $0.95 at $142.40
October cattle posted an inside day with a lower close on Tuesday as it consolidated some of the rally off July's low. The low-range close sets the stage for a steady to lower opening on Tuesday. Stochastics and the RSI are overbought but remain neutral to bullish signaling that sideways to higher prices are possible near-term. If October extends the rally off June's low, May's high crossing at $145.10 is the next upside target. Closes below the 50-day moving average crossing at $140.06 would confirm that a short-term top has been posted. First resistance is May's high crossing at $145.10. Second resistance is the top of the April 25th gap crossing at $145.98. First support is the July 15th low crossing at $139.30. Second support is July's low crossing at $138.03.
September Feeder cattle closed down $2.75 at $179.93.
September Feeder cattle closed lower on Tuesday as it consolidated some of the rally off May's low. The low-range close sets the stage for a lower opening when Wednesday's session begins trading. Stochastics and the RSI are overbought diverging and are turning neutral to bearish signaling that sideways to lower prices are possible near-term. Close below last-Monday's low crossing at $178.10 would signal that a short-term top has been posted. If September extends this month's rally, February's high crossing at $188.25 is the next upside target. First resistance is last-Friday's high crossing at $184.90. Second resistance is February's high crossing at $188.25. First support is last-Monday's low crossing at $178.10. Second support is the 50-day moving average crossing at $175.34.
FOOD & FIBERhttp://quotes.ino.com/ex changes/?c=food
September coffee closed higher on Tuesday. The high-range close sets the stage for a steady to higher opening on Wednesday. Stochastics and the RSI have turned neutral to bullish signaling that sideways to higher prices are possible. If September renews the decline off June's high, the 50% retracement level of the 2020-2021 rally crossing at $18.41 is the next downside target. Closes above the 50-day moving average crossing at $22.22 would signal that a short-term low has been posted. First resistance is the 50-day moving average crossing at $22.22. Second resistance is July's high crossing at $22.90. First support is July's low crossing at $19.60. Second support is the 50% retracement level of the 2020-2021 rally crossing at $18.41.
September cocoa closed higher on Tuesday as it extends the rally off July's low. The high-range close sets the stage for a steady to higher opening on Wednesday. Stochastics and the RSI have turned neutral to bullish signaling sideways to higher prices are possible near-term. If September extends the rally off July's low, the 50-day moving average crossing at 24.14 is the next upside target. If September renews the decline off April's high, the July-2021 low crossing at 22.32 is the next downside target.
October sugar closed unchanged on Tuesday as it consolidates some of this month's decline. The low-range close sets the stage for a steady to lower opening on Wednesday. Stochastics and the RSI are oversold but remain neutral to bearish signaling that sideways to lower prices are possible near-term. If October extends this month's decline, the 38% retracement level of the 2020-2022 rally crossing at 16.88 is the next downside target. Closes above the 20-day moving average crossing at 18.50 would signal that a short-term low has been posted.
December cotton closed sharply higher on Tuesday as it extends the rally off July's low. The high-range close sets the stage for a steady to higher opening on Wednesday. Stochastics and the RSI are neutral to bearish signaling that sideways to lower prices are possible near-term. Today's close above the 20-day moving average crossing at 92.45 signals that a short-term low has been posted. If December extends this month's rally, the June 30th high crossing at 99.49 is the next upside target. If December extends the decline off May's high, the 75% retracement level of the 2020-2022 rally crossing at 74.58 is the next downside target.
Thanks again tallpine!
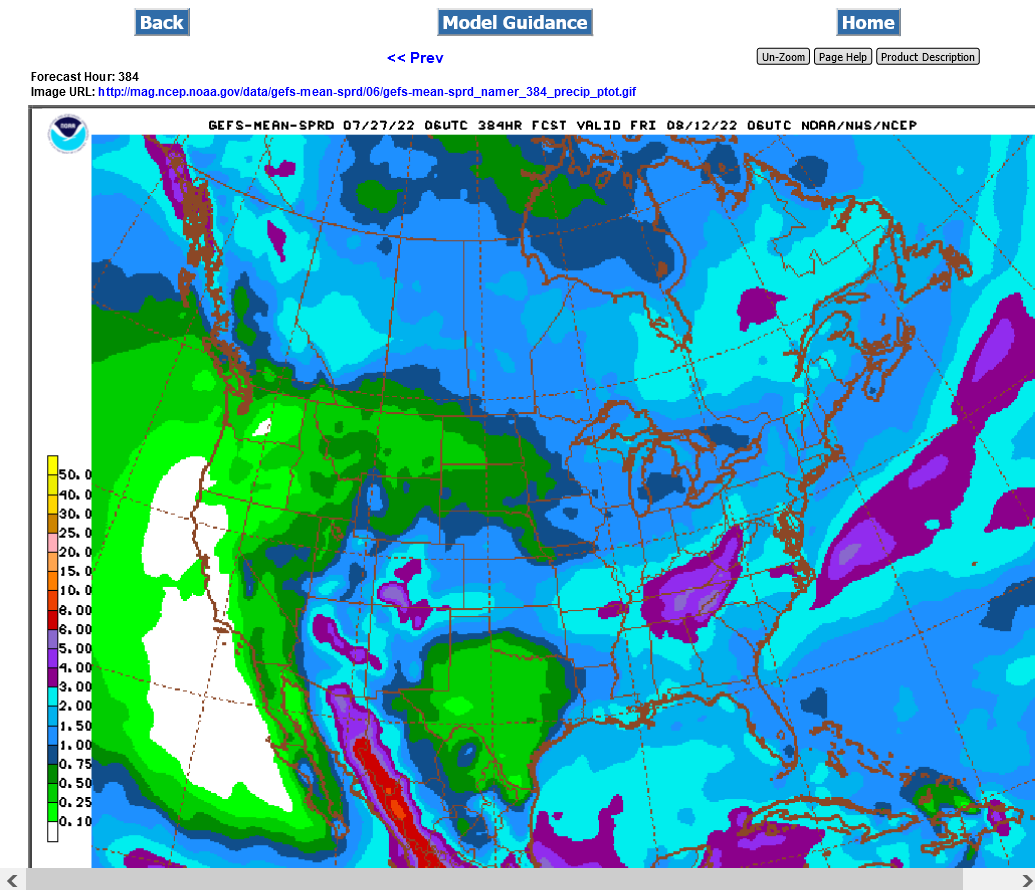
Weather hasn't changed much.
Beans leading today, likely from
1. Bean don't like wet feet-excessive rains this week will hurt beans in those areas
2. August is THE key month for beans with pod filling. Hot and dry will hurt beans the most even though it will be bad for corn's kernel filling.
Latest 2 week rains from the last 6z GFS ensemble below.
All the weather:
Crude being up $2.50 sure isn't hurting either!
Wheat being lower earlier was hurting corn.
August NG expires today.
Also could the heat ridge be backing up late in week 2?