KEY EVENTS TO WATCH FOR:
Friday, August 5, 2022
8:30 AM ET. July U.S. Employment Report
Non-Farm Payrolls (previous +372K)
Unemployment Rate (previous 3.6%)
Avg Hourly Earnings (USD) (previous 32.08)
Avg Hourly Earnings-Net Chg (USD) (previous +0.1)
Avg Hourly Earnings, M/M% (previous +0.31%)
Avg Hourly Earnings, Y/Y% (previous +5.11%)
Overall Workweek (previous 34.5)
Overall Workweek Net Chg
Government Payrolls (previous -9K)
Private Payroll (previous +381K)
Participation Rate (previous 62.2%)
Non-Farm Payrolls Bench Net Chg
3:00 PM ET. June Consumer Credit
Consumer Credit Net Chg (USD) (previous +22.3B)
The STOCK INDEXES? http://quotes.ino.com/ex?changes/?c=indexes
The STOCK INDEXES: The September NASDAQ 100 was slightly lower overnight as it consolidates some of the rally off June's low. Overnight weakness sets the stage for a steady to lower opening when the day session begins trading. Stochastics and the RSI are overbought but remain neutral to bullish signaling that sideways to higher prices are possible near-term. If September extends the rally off June's low, the 50% retracement level of the 2021-2022 decline crossing at 13,812.10 is the next upside target. Closes below the 20-day moving average crossing at 12,476.46 would signal that a short-term top has been posted. First resistance is the overnight high crossing at 13,384.50. Second resistance is the 50% retracement level of the 2021-2022 decline crossing at 13,812.10. First support is the 10-day moving average crossing at 12,858.96. Second support is the 20-day moving average crossing at 12,476.46.
The September S&P 500 was steady to higher overnight as it extends the rally off June's low. Overnight trading sets the stage for a steady to higher opening when the day session begins trading. Stochastics and the RSI are overbought but remain neutral to bullish signaling that sideways to higher prices are possible near-term. If September extends the rally off June's low, the 50% retracement level of the January-June decline crossing at 4215.81 is the next upside target. Closes below the 20-day crossing at 3982.12 would signal that a short-term top has been posted. First resistance is the 50% retracement level of the January-June decline crossing at 4215.81. Second resistance is the 62% retracement level of the January-June decline crossing at 4352.80. First support is the 10-day moving average crossing at 4079.90. Second support is the 20-day moving average crossing at 3982.12.
INTEREST RATES http://quotes.ino.com/ex changes/?c=interest"
INTEREST RATES: September T-bonds were steady to lower overnight. The low-range overnight trade sets the stage for a slightly lower opening when the day session begins trading. Stochastics and the RSI are neutral to bearish signaling that sideways to lower prices are possible near-term. Closes below the 20-day moving average crossing at 141-12 would signal that a short-term top has been posted. If September extends the rally off June's low, the 50% retracement level of the 2021-2022 decline crossing at 147-27 is the next upside target. First resistance is the 50% retracement level of the 2021-2022 decline crossing at 147-27. Second resistance is the 62% retracement level of the 2021-2022 decline crossing at 151-28. First support is the 20-day moving average crossing at 141-12. Second support is the 50-day moving average crossing at 138-24.
September T-notes was steady to slightly lower overnight. Overnight trading sets the stage for a steady to lower opening when the day session begins trading. Stochastics and the RSI are neutral to bearish signaling that sideways to lower prices are possible near-term. Closes below the 20-day moving average crossing at 119.177 would signal that a short-term top has been posted while opening the door for additional weakness near-term. If September renews the rally off June's low, the 50% retracement level of the 2021-2022 decline crossing at 122.204 is the next upside target. First resistance is Tuesday's high crossing at 122.020. Second resistance is the 50% retracement level of the 2021-2022 decline crossing at 122.204 is the next upside target. First support is the 20-day moving average crossing at 119.177. Second support is the 50-day moving average crossing at 118.157.
ENERGY MARKETS? http://quotes.ino.com/ex?changes/?c=energy ""
ENERGIES:September crude oil was steady to slightly lower overnight and sets the stage for a steady to lower opening when the day session begins trading. Stochastics and the RSI are oversold but remain neutral to bearish signaling that sideways to lower prices are possible near-term. If September extends the decline off June's high, the 38% retracement level of the 2020-2022 rally crossing at $86.43 is the next downside target. Closes above the 20-day moving average crossing at $95.34 would temper the near-term bearish outlook. First resistance is last-Friday's high crossing at $101.88. Second resistance is the 50-day moving average crossing at $102.97. First support is Thursday's low crossing at $87.55. Second support is the 38% retracement level of the 2020-2022 rally crossing at $86.43.
September heating oil was lower overnight and is breaking out to the downside of the July-August trading range. Overnight trading sets the stage for a steady to lower opening when the day session begins trading. Stochastics and the RSI are oversold but remain neutral to bearish signaling that sideways to lower prices are possible near-term. If September extends the decline off June's high, the 38% retracement level of the 2020-2022 rally crossing at $3.1874 is the next downside target. Closes above the 20-day moving average crossing at $3.5125 would signal that a short-term low has been posted. First resistance is the 20-day moving average crossing at $3.5125. Second resistance is the 50-day moving average crossing at $3.7820. First support is the overnight low crossing at $3.2328. Second support is the 38% retracement level of the 2020-2022 rally crossing at 3.1874.
September unleaded gas was slightly lower in late-overnight trading as it extends the decline off June's high. Overnight trading sets the stage for a slightly lower opening when the day session begins trading. Stochastics and the RSI are oversold but remain neutral to bearish signaling that sideways to lower prices are possible near-term. If September renews the decline off June's high, the March-2022 low crossing at 2.6308 is the next downside target. Closes above Wednesday's high crossing at 3.1427 would signal that a short-term low has been posted. First resistance is last-Friday's high crossing at 3.2492. Second resistance is the July 11th high crossing at 3.3229. First support is Thursday's low crossing at 2.7575. Second support is the March-2022 low crossing at 2.6308.
September Henry natural gas was steady to lower overnight and sets the stage for a lower opening when the day session begins trading. Stochastics and the RSI remain neutral to bearish signaling that sideways to lower prices are possible near-term. Closes below the 50-day moving average crossing at 7.519 would signal that a short-term top has been posted. If September renews the rally off July's low, June's high crossing at 9.598 is the next upside target. First resistance is last-Tuesday's high crossing at 9.419. Second resistance is June's high crossing at 9.598. First support is the 50-day moving average crossing at 7.519. Second support is the July 15th low crossing at 6.351.
CURRENCIEShttp://quotes.ino.com/ex changes/?c=currencies"
CURRENCIES:The September Dollar was steady to slightly higher overnight trading. Overnight trading sets the stage for a steady to higher opening when the day session begins trading. Stochastics and the RSI have turning neutral to bullish signaling that a low might be in or is near.Closes above last-Wednesday's high crossing at $107.300 are needed to confirm that a short-term low has been posted. If September renews the decline off July's high, the June 16th low crossing at $103.200 is the next downside target. First resistance is last-Wednesday's high crossing at $107.300. Second resistance is the July 14th high crossing at $109.140. First support is the 50-day moving average crossing at $105.109. Second support is the June 16th low crossing at $103.200.
The September Euro was steady to lower overnight as it extends the July-August trading range. The overnight trade sets the stage for a steady to lower opening when the day session begins trading. Stochastics and the RSI have turned neutral to bearish signaling that sideways to lower prices are possible near-term. If September renews the decline off May's high, the July 14th low crossing at $1.00000 is the next downside target. Closes above Tuesday's high crossing at $1.03275 would mark a possible upside breakout of the July-August trading range while opening the door for a possible test of the 50-day moving average crossing at $1.04378. First resistance is Tuesday's high crossing at $1.03275. Second resistance is the 50-day moving average crossing at $1.04378. First support is the July 14th low crossing at $1.00000. Second support is the December 2002 low on the monthly continuation chart crossing at $0.98540.
The September British Pound was lower overnight and sets the stage for a lower opening when the day session begins trading. Stochastics and the RSI have turned neutral to bearish signaling that sideways to lower prices are possible near-term. Closes below the 20-day moving average crossing at 1.2048 would signal that a short-term top has been posted. If September renews the rally off July's low, the 25% retracement level of the 2021-2022 decline crossing at 1.2385 is the next upside target. First resistance is the 25% retracement level of the 2021-2022 decline crossing at 1.2385. Second resistance is the 38% retracement level of the 2021-2022 decline crossing at 1.2710. First support is the 20-day moving average crossing at 1.2048. Second support is the July 14th low crossing at 1.1778.
The September Swiss Franc was slightly lower overnight. The mid-range overnight trade sets the stage for a steady to lower opening when the day session begins trading. Stochastics and the RSI have turned neutral to bearish signaling that sideways to lower prices are possible near-term. Closes below the 50-day moving average crossing at 1.03896 would signal that a short-term top has been posted. If September renews the rally off the July 14th low, the 38% retracement level of the 2021-2022 decline crossing at 1.06242 is the next upside target. First resistance is Tuesday's high crossing at 1.06065. Second resistance is the 38% retracement level of the 2021-2022 decline crossing at 1.06242. First support is the 50-day moving average crossing at 1.03896. Second support is the July 14th low crossing at 1.01650.
The September Canadian Dollar was lower overnight as it extends the decline off Monday's high. The low-range overnight trade sets the stage for a steady to lower opening when the day session begins trading. Stochastics and the RSI have turned neutral to bearish signaling that sideways to lower prices are possible near-term. Closes below the 20-day moving average crossing at $77.46 would signal that a short-term top has been posted while opening the door for additional weakness near-term. Closes above Monday's high crossing at $78.31 would renew the rally off July's low while opening the door for a possible test of the 62% retracement level of the April-July decline crossing at 78.67. First resistance is Monday's high crossing at $78.31. Second resistance is the 62% retracement level of the April-July decline crossing at 78.67. First support isthe 20-day moving average crossing at $77.46. Second support is July's low crossing at $75.61.
The September Japanese Yen was steady to lower overnight. Overnight weakness sets the stage for a steady to lower opening when the day session begins trading. Stochastics and the RSI have turned neutral to bearish signaling that sideways to lower prices are possible near-term. Closes below the 20-day moving average crossing at 0.073857 would temper the near-term friendly outlook. Closes above the 25% retracement level of this year's decline crossing at 0.076118 would open the door for a larger-degree rally into early-August. First resistance is the 25% retracement level of this year's decline crossing at 0.076118. Second resistance is the 38% retracement level of this year's decline crossing at 0.078281. First support is the 20-day moving average crossing at 0.073857. Second support is July's low crossing at 0.072085.
PRECIOUS METALS http://quotes.ino.com/ex changes/?c=metals"
PRECIOUS METALS: Decembergold was lower overnight as it consolidates some of the rally off July's low. Overnight trading sets the stage for a lower opening when the day session begins trading. Stochastics and the RSI are overbought but remain neutral to bullish signaling that sideways to higher prices are possible near-term. If December extends the rally off July's low, the 38% retracement level of the March-July decline crossing at $1846.60 is the next upside target. Closes below the 20-day moving average $1753.60 would signal that a short-term top has been posted. First resistance is the 50-day moving average $1808.90. Second is the 38% retracement level of the March-July decline crossing at $1846.60. First support is he 20-day moving average $1753.60. Second support is July's low crossing at $1727.00.
September silver was lower overnight as it extends the trading range of the past five-days. The low-range trade sets the stage for a steady to lower opening when the day session begins trading later this morning. Stochastics and the RSI are overbought but remain neutral to bullish signaling that sideways to higher prices are possible near-term. Closes above the 50-day moving average crossing at $20.426 would open the door for additional gains near-term. Closes below the 20-day moving average crossing at 19.185 would signal that a short-term top has been posted. First resistance is the 50-day moving average crossing at $20.426. Second resistance is the 38% retracement level of the March-July decline crossing at 21.575. First support is the 20-day moving average crossing at 19.185. Second support is the July 14th low crossing at $18.010.
September copper was slightly higher overnight as it consolidates below the 38% retracement level of the March-July decline. Overnight trading sets the stage for a steady to higher opening when the day session begins trading. Stochastics and the RSI have turned neutral to bearish signaling that sideways to lower prices are possible near-term. Closes below the 20-day moving average crossing at 3.3910 would signal that a short-term top has been posted. If September renews the rally off July's low, the 50-day moving average crossing at 3.7840 is the next upside target. First resistance is Monday's high crossing at 3.5870. Second resistance is the 50-day moving average crossing at 3.7840. First support is the 20-day moving average crossing at 3.3910. Second support is the July 15th low crossing at 3.1315.
GRAINS http://quotes.ino.com/ex changes/?c=grains
December corn was lower overnight as it consolidates some of the rally off Wednesday's low. Overnight trading sets the stage for a steady to lower opening when the day sessions begins trading. Stochastics and the RSI are neutral signaling that choppy trading is possible near-term. Closes below last-Tuesday's gap crossing at $5.84 1/4 would temper the near-term friendly outlook. If December renews the rally off July's low, the 50-day moving average crossing at $6.48 3/4 is the next upside target. First resistance is last-Friday's high crossing at $6.36 1/2. Second resistance is the 50-day moving average crossing at $6.48 3/4. First support is last-Tuesday's gap crossing at $5.84 1/4. Second support is the 50% retracement level of the 2020-2022 rally crossing at $5.74 3/4.
September wheat was steady to lower overnight as it extends the July-August trading range. Overnight trading sets the stage for a steady to lower opening when the day session begins trading. Stochastics and the RSI have turning neutral signaling that sideways trading is possible near-term. If September renews the decline off May's high, the 75% retracement level of the January-May high crossing at $7.23 is the next downside target. Closes above the July 20th high crossing at $8.43 1/2 would signal that a short-term low has been posted. First resistance is the July 20th high crossing at $8.43 1/2. Second resistance is the 50-day moving average crossing at $9.24. First support is Wednesday's low crossing at $7.52. Second support is the 75% retracement level of the January-May high crossing at $7.23.
September Kansas City wheat was steady to slightly lower overnight and sets the stage for a lower opening when the day session begins trading later this morning. Stochastics and the RSI have turned neutral to bullish signaling that sideways to higher prices are possible near-term. If September renews the decline off May's high, February's low crossing at $7.64 1/2 the next downside target. Closes above last-Friday's high crossing at $9.15 1/4 would confirm that a short-term low has been posted. First resistance is last-Friday's high crossing at $9.15 1/4. Second resistance is the 50-day moving average crossing at $9.91. First support is the 62% retracement level of the January-May rally crossing at $8.32 3/4. Second support is the February's low crossing at $7.64 1/2.
September Minneapolis wheat was slightly lower overnight and sets the stage for a lower opening when the day session begins trading. Stochastics and the RSI are neutral to bullish signaling that sideways to higher prices are possible near-term. Closes above the July 20th high crossing at $9.56 would signal that a short-term low has been posted while opening the door for additional gains near-term. If September renews the decline of May's high, the 75% retracement level of the January-May rally crossing at $8.12 3/4 is the next downside target. First resistance is the July 20th high crossing at $9.56. Second resistance is the 50-day moving average crossing at $10.43 1/4. First support is Wednesday's low crossing at $8.64 3/4. Second support is the 75% retracement level of the January-May high crossing at $8.12 3/4.
SOYBEAN COMPLEX? http://quotes.ino.com/ex?changes/?c=grains "
November soybeans was lower overnight as it consolidates some of Thursday's rally. Overnight trading sets the stage for a lower opening when the day session begins trading. Stochastics and the RSI are turning neutral to bullish signaling that sideways to higher prices are possible near-term. If November renews the rally off July's low, the June 30th high crossing at $15.07 3/4 is the next upside target. Closes below last-Tuesday's gap crossing at $13.49 1/4 would temper the near-term friendly outlook. First resistance is the June 30th high crossing at $15.07 3/4. Second resistance is the June 17th high crossing at $15.563/4. First support is last-Tuesday's gap crossing at $13.49 1/4. Second support is July's low crossing at $12.88 1/2.
December soybean meal was steady to lower overnight as it consolidates some of Thursday's rally. The low-range trade overnight sets the stage for a steady to lower opening when the day session begins trading. Stochastics and the RSI are neutral to bullish signaling that sideways to higher prices are possible near-term. If December renews the rally off the July 22nd low, March's high crossing at $436.80 is the next upside target. Closes below Wednesday's low would renew the decline off July's high while opening the door for a test of the July 22nd low crossing at $380.80. First resistance is July's high crossing at $431.70. Second resistance is March's high crossing at $436.80. First support is Wednesday's low crossing at $395.50. Second support is the July 22nd low crossing at $380.80.
December soybean oil was higher overnight as it consolidates some of the decline off last-Friday's high. The mid-range overnight trade sets the stage for a steady to higher opening when the day session begins trading. Stochastics and the RSI are neutral signaling that sideways trading is possible near-term. Closes below the 20-day moving average crossing at 59.72 would signal that a short-term top has been posted. If December renews the rally off July's low, the 50-day moving average crossing at 66.14 is the next upside target. First resistance is the 50-day moving average crossing at 66.14. Second resistance is the June 29th high crossing at 67.76. First support is the 20-day moving average crossing at 59.72. Second support is the July 14th low crossing at 54.42.
Thanks tallpine!
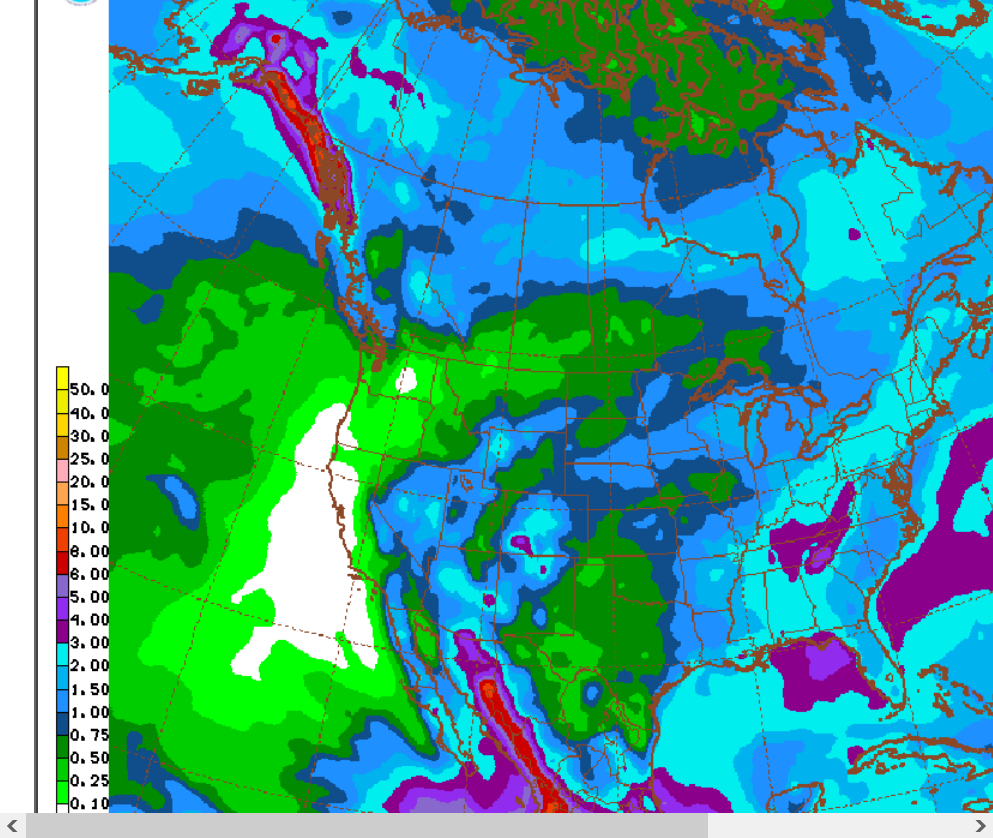
Just out 12z GFS ensemble for 2 weeks:
Headed to Detroit early Saturday to stay with my Dad for a week.
Will try to continue to follow the markets and make comments.