KEY EVENTS TO WATCH FOR:
Tuesday, August 9, 2022
6:00 AM ET. July NFIB Index of Small Business Optimism
Small Business Idx (previous 89.5)
8:30 AM ET. 2nd Quarter Preliminary Productivity & Costs
Non-Farm Productivity, Q/Q% (previous -7.5%)
Unit Labor Costs (previous +11.6%)
8:55 AM ET. Johnson Redbook Retail Sales Index
Ret Sales Mo-to-Date, M/M%
Ret Sales Mo-to-Date, Y/Y% (previous +14.1%)
Latest Wk, Y/Y% (previous +15.5%)
10:00 AM ET. August IBD/TIPP Economic Optimism Index
Economic Optimism Idx (previous 38.5)
6-Mo Economic Outlook (previous 32.2)
4:30 PM ET. API Weekly Statistical Bulletin
Crude Stocks, Net Chg (Bbls) (previous +2.2M)
Gasoline Stocks, Net Chg (Bbls) (previous -0.2M)
Distillate Stocks, Net Chg (Bbls) (previous -0.4M)
Wednesday, August 10, 2022
7:00 AM ET. MBA Weekly Mortgage Applications Survey
Composite Idx (previous 279.2)
Composite Idx, W/W% (previous +1.2%)
Purchase Idx-SA (previous 208.4)
Purchase Idx-SA, W/W% (previous +1.0%)
Refinance Idx (previous 640.6)
Refinance Idx, W/W% (previous +1.5%)
8:30 AM ET. July CPI
CPI, M/M% (previous +1.3%)
Core CPI, M/M% (previous +0.7%)
Energy Idx, M/M% (previous +7.5%)
Food Idx, M/M% (previous +1%)
Real Avg Wkly Pay-Infla Adj, M/M% (previous -1%)
CPI, Y/Y% (previous +9.1%)
Core Annual, Y/Y% (previous +5.9%)
8:30 AM ET. July Real Earnings
10:00 AM ET. June Monthly Wholesale Trade
Inventories, M/M% (previous +1.8%)
10:00 AM ET. July Online Help Wanted Index
10:30 AM ET. EIA Weekly Petroleum Status Report
Crude Oil Stocks (Bbl) (previous 426.553M)
Crude Oil Stocks, Net Chg (Bbl) (previous +4.467M)
Gasoline Stocks (Bbl) (previous 225.294M)
Gasoline Stocks, Net Chg (Bbl) (previous +0.163M)
Distillate Stocks (Bbl) (previous 109.324M)
Distillate Stocks, Net Chg (Bbl) (previous -2.4M)
Refinery Usage (previous 91.0%)
Total Prod Supplied (Bbl/day) (previous 19.948M)
Total Prod Supplied, Net Chg (Bbl/day) (previous -0.028M)
2:00 PM ET. July Monthly Treasury Statement of Receipts & Outlays of the U.S. Govt
Thursday, August 11, 2022
8:30 AM ET. Unemployment Insurance Weekly Claims Report - Initial Claims
Jobless Claims (previous 260K)
Jobless Claims, Net Chg (previous +6K)
Continuing Claims (previous 1416000)
Continuing Claims, Net Chg (previous +48K)
8:30 AM ET. July PPI
PPI, M/M% (previous +1.1%)
Ex-Food & Energy PPI, M/M% (previous +0.4%)
Personal Consumption (previous +1.3%)
8:30 AM ET. U.S. Weekly Export Sales
Corn (Metric Tons) (previous 314.6K)
Soybeans (Metric Tons) (previous 399.6K)
Wheat (Metric Tons) (previous 249.9K)
10:30 AM ET. EIA Weekly Natural Gas Storage Report
Working Gas In Storage (Cbf) (previous 2457B)
Working Gas In Storage, Net Chg (Cbf) (previous +41B)
4:30 PM ET. Foreign Central Bank Holdings
4:30 PM ET. Federal Discount Window Borrowings
Friday, August 12, 2022
8:30 AM ET. July Import & Export Price Indexes
Import Prices (previous +0.2%)
Non-Petroleum Prices (previous -0.4%)
Petroleum Prices (previous +5%)
10:00 AM ET. August University of Michigan Survey of Consumers - preliminary
Mid-Mo Sentiment (previous 51.1)
Mid-Mo Expectations (previous 47.3)
Mid-Mo Current Idx (previous 57.1)'
12:00 PM ET. World Agricultural Supply & Demand Estimates (WASDE)
Corn, End Stocks (Bushels)
Soybeans, End Stocks (Bushels)
Wheat, End Stocks (Bushels)
Cotton, End Stocks (Bales)
The STOCK INDEXES? http://quotes.ino.com/ex?changes/?c=indexes
The STOCK INDEXES: The September NASDAQ 100 was lower overnight as it consolidates around the 38% retracement level of the 2021-2022 decline crossing at 13,164.61. Overnight weakness sets the stage for a steady to lower opening when the day session begins trading. Stochastics and the RSI are overbought and are poised to turn neutral to bearish signaling that sideways to lower prices are possible near-term. Closes below the 20-day moving average crossing at 12,603.80 would signal that a short-term top has been posted. If September extends the rally off June's low, the 50% retracement level of the 2021-2022 decline crossing at 13,812.10 is the next upside target. First resistance is last-Friday's high crossing at 13,384.50. Second resistance is the 50% retracement level of the 2021-2022 decline crossing at 13,812.10. First support is the 10-day moving average crossing at 13,033.08. Second support is the 20-day moving average crossing at 12,603.80.
The September S&P 500 was steady to lower overnight as it extends the trading range of the past seven-days. Overnight trading sets the stage for a steady to lower opening when the day session begins trading. Stochastics and the RSI are overbought but remain neutral to bullish signaling that sideways to higher prices are possible near-term. If September extends the rally off June's low, the 50% retracement level of the January-June decline crossing at 4215.81 is the next upside target. Closes below the 20-day crossing at 4011.57 would signal that a short-term top has been posted. First resistance is the 50% retracement level of the January-June decline crossing at 4215.81. Second resistance is the 62% retracement level of the January-June decline crossing at 4352.80. First support is the 10-day moving average crossing at 4117.57. Second support is the 20-day moving average crossing at 4011.57.
INTEREST RATES http://quotes.ino.com/ex changes/?c=interest"
INTEREST RATES: September T-bonds were lower overnight. The low-range overnight trade sets the stage for a steady to lower opening when the day session begins trading. Stochastics and the RSI are neutral to bearish signaling that sideways to lower prices are possible near-term. Closes below the 20-day moving average crossing at 141-19 would signal that a short-term top has been posted. If September renews the rally off June's low, the 50% retracement level of the 2021-2022 decline crossing at 147-27 is the next upside target. First resistance is the 50% retracement level of the 2021-2022 decline crossing at 147-27. Second resistance is the 62% retracement level of the 2021-2022 decline crossing at 151-28. First support is the 20-day moving average crossing at 141-19. Second support is the 50-day moving average crossing at 138-24.
September T-notes was steady to lower overnight. Overnight trading sets the stage for a lower opening when the day session begins trading. Stochastics and the RSI are neutral to bearish signaling that sideways to lower prices are possible near-term. If September extends the decline off last-Tuesday's high crossing at 122.020, the 50-day moving average crossing at 118.143 is the next downside target. If September renews the rally off June's low, the 50% retracement level of the 2021-2022 decline crossing at 122.204 is the next upside target. First resistance is last-Tuesday's high crossing at 122.020. Second resistance is the 50% retracement level of the 2021-2022 decline crossing at 122.204 is the next upside target. First support is the 20-day moving average crossing at 119.196. Second support is the 50-day moving average crossing at 118.143.
ENERGY MARKETS? http://quotes.ino.com/ex?changes/?c=energy ""
ENERGIES:September crude oil was steady to higher overnight and sets the stage for a steady to higher opening when the day session begins trading. Stochastics and the RSI have turning neutral to bullish signaling that sideways to higher prices are possible near-term. Closes above the 20-day moving average crossing at $94.78 would temper the near-term bearish outlook. If September extends the decline off June's high, the 38% retracement level of the 2020-2022 rally crossing at $86.43 is the next downside target. First resistance is the 20-day moving average crossing at $94.78. Second resistance is the 50-day moving average crossing at $102.37. First support is last-Friday's low crossing at $87.01. Second support is the 38% retracement level of the 2020-2022 rally crossing at $86.43.
September heating oil was higher overnight as it consolidates some of the decline off the July 28th high crossing at $3.7308. Overnight trading sets the stage for a higher opening when the day session begins trading. Stochastics and the RSI are oversold but remain neutral to bearish signaling that sideways to lower prices are possible near-term. If September extends the decline off June's high, the April low crossing at $2.9426 is the next downside target. Closes above the 20-day moving average crossing at $3.4730 would signal that a short-term low has been posted. First resistance is the 20-day moving average crossing at $3.4730. Second resistance is the 50-day moving average crossing at $3.7654. First support is Monday's low crossing at $3.1424. Second support is March's low crossing at $2.9426.
September unleaded gas was steady to higher in late-overnight trading as it consolidates some of the decline off June's high. Overnight trading sets the stage for a higher opening when the day session begins trading. Stochastics and the RSI are turning neutral to bullish signaling that sideways to higher prices are possible near-term. Closes above last-Wednesday's high crossing at $3.1427 would signal that a short-term low has been posted. If September renews the decline off June's high, the March-2022 low crossing at $2.6308 is the next downside target. First resistance is the July 29th high crossing at $3.2492. Second resistance is the July 11th high crossing at $3.3229. First support is last-Thursday's low crossing at $2.7575. Second support is the March-2022 low crossing at $2.6308.
September Henry natural gas was higher overnight and sets the stage for a higher opening when the day session begins trading. Stochastics and the RSI remain neutral to bearish signaling that sideways to lower prices are possible near-term. Closes below the 50-day moving average crossing at 7.470 would signal that a short-term top has been posted. If September renews the rally off July's low, June's high crossing at 9.598 is the next upside target. First resistance is July's high crossing at 9.419. Second resistance is June's high crossing at 9.598. First support is the 50-day moving average crossing at 7.470. Second support is the July 15th low crossing at 6.351.
CURRENCIEShttp://quotes.ino.com/ex changes/?c=currencies"
CURRENCIES:The September Dollar was steady to lower overnight trading. Overnight trading sets the stage for a lower opening when the day session begins trading. Stochastics and the RSI are neutral to bullish signaling that a sideways to higher prices are possible near-term.Closes above the July 27th high crossing at $107.300 are needed to confirm that a short-term low has been posted. If September renews the decline off July's high, the June 16th low crossing at $103.200 is the next downside target. First resistance is the July 27thhigh crossing at $107.300. Second resistance is the July 14th high crossing at $109.140. First support is the 50-day moving average crossing at $106.612. Second support is the June 16th low crossing at $103.200.
The September Euro was steady to higher overnight as it extends the July-August trading range. The overnight trade sets the stage for a higher opening when the day session begins trading. Stochastics and the RSI are neutral to bearish signaling that sideways to lower prices are possible near-term. If September renews the decline off May's high, the July 14th low crossing at $1.00000 is the next downside target. Closes above last-Tuesday's high crossing at $1.03275 would mark a possible upside breakout of the July-August trading range while opening the door for a possible test of the 50-day moving average crossing at $1.04152. First resistance is last-Tuesday's high crossing at $1.03275. Second resistance is the 50-day moving average crossing at $1.04152. First support is the July 14th low crossing at $1.00000. Second support is the December 2002 low on the monthly continuation chart crossing at $0.98540.
The September British Pound was slightly higher overnight and sets the stage for a higher opening when the day session begins trading.Stochastics and the RSI are neutral to bearish signaling that sideways to lower prices are possible near-term. Closes below the 20-day moving average crossing at 1.2063 would signal that a short-term top has been posted. If September renews the rally off July's low, the 25% retracement level of the 2021-2022 decline crossing at 1.2385 is the next upside target. First resistance is the 25% retracement level of the 2021-2022 decline crossing at 1.2385. Second resistance is the 38% retracement level of the 2021-2022 decline crossing at 1.2710. First support is the 20-day moving average crossing at 1.2063. Second support is the July 14th low crossing at 1.1778.
The September Swiss Franc was higher overnight as it extends last-week's trading range. The mid-range overnight trade sets the stage for a steady to higher opening when the day session begins trading. Stochastics and the RSI are neutral signaling that sideways trading is possible near-term. Closes below the 50-day moving average crossing at 1.03890 would signal that a short-term top has been posted. If September renews the rally off the July 14th low, the 38% retracement level of the 2021-2022 decline crossing at 1.06242 is the next upside target. First resistance is last-Tuesday's high crossing at 1.06065. Second resistance is the 38% retracement level of the 2021-2022 decline crossing at 1.06242. First support is the 50-day moving average crossing at 1.03890. Second support is the July 14th low crossing at 1.01650.
The September Canadian Dollar was steady to slightly higher overnight. The mid-range overnight trade sets the stage for a steady to higher opening when the day session begins trading. Stochastics and the RSI are neutral signaling that sideways trading is possible near-term. Closes above last-Monday's high crossing at $78.31 would renew the rally off July's low while opening the door for a possible test of the 62% retracement level of the April-July decline crossing at 78.67. If September renews the decline off last-Monday's high, the reaction low crossing at 76.43 is the next downside target. First resistance is last-Monday's high crossing at $78.31. Second resistance is the 62% retracement level of the April-July decline crossing at 78.67. First support is the July 5th low crossing at $76.43. Second support is July's low crossing at $75.61.
The September Japanese Yen was steady to slightly lower overnight. Overnight weakness sets the stage for a steady to lower opening when the day session begins trading. Stochastics and the RSI remain neutral to bearish signaling that sideways to lower prices are possible near-term. Closes below the 20-day moving average crossing at 0.073906 would open the door for a larger-degree near-term. If September renews the rally off July's low, the 38% retracement level of this year's decline crossing at 0.078281 is the next upside target. First resistance is the 25% retracement level of this year's decline crossing at 0.076118. Second resistance is the 38% retracement level of this year's decline crossing at 0.078281. First support is the 20-day moving average crossing at 0.073906. Second support is July's low crossing at 0.072085.
PRECIOUS METALS http://quotes.ino.com/ex changes/?c=metals"
PRECIOUS METALS: Decembergold was steady to higher overnight. Overnight trading sets the stage for a higher opening when the day session begins trading. Stochastics and the RSI are overbought but remain neutral to bullish signaling that sideways to higher prices are possible near-term. If December extends the rally off July's low, the 38% retracement level of the March-July decline crossing at $1848.00 is the next upside target. Closes below the 20-day moving average $1759.00 would signal that a short-term top has been posted. First resistance is the 50-day moving average $1806.20. Second is the 38% retracement level of the March-July decline crossing at $1848.00. First support is he 20-day moving average $1759.00. Second support is July's low crossing at $1727.00.
September silver was steady to slightly higher overnight as it extends Monday's upside breakout of last-week's trading range marking the resumption of the rally off July's low. The mid-range trade sets the stage for a steady to higher opening when the day session begins trading later this morning. Stochastics and the RSI are overbought but remain neutral to bullish signaling that sideways to higher prices are possible near-term. If September extends the aforementioned rally, the 38% retracement level of the March-July decline crossing at 21.575 is the next upside target. Closes below the 20-day moving average crossing at 19.335 would signal that a short-term top has been posted. First resistance is Monday's high crossing at $20.745. Second resistance is the 38% retracement level of the March-July decline crossing at 21.575. First support is the 20-day moving average crossing at 19.335. Second support is the July 14th low crossing at $18.010.
September copper was steady to slightly higher overnight as it consolidates around the 38% retracement level of the March-July decline. Overnight trading sets the stage for a steady to slightly higher opening when the day session begins trading. Stochastics and the RSI are overbought but remain neutral to bullish signaling that sideways to higher prices are possible near-term. If September extends the rally off July's low, the 50-day moving average crossing at 3.7583 is the next upside target. Closes below the 20-day moving average crossing at 3.4174 would signal that a short-term top has been posted. First resistance is Monday's high crossing at 3.6225. Second resistance is the 50-day moving average crossing at 3.7584. First support is the 20-day moving average crossing at 3.4174. Second support is the July 15th low crossing at 3.1315.
GRAINS http://quotes.ino.com/ex changes/?c=grains
December corn was higher overnight following Monday's crop conditions report that showed a 3% decline in the good/excellent rating to 58% good/excellent. Additional support came from extended weather forecast for the Midwest that is calling for little to no precipitation across much of the region along with above normal temps. Overnight trading sets the stage for a higher opening when the day sessions begins trading. Stochastics and the RSI are neutral to bullish signaling that sideways to higher prices are possible near-term. If December renews the rally off July's low, the 50-day moving average crossing at $6.44 3/4 is the next upside target. Closes below the July 26th gap crossing at $5.84 1/4 would temper the near-term friendly outlook. First resistance is the July 29th high crossing at $6.36 1/2. Second resistance is the 50-day moving average crossing at $6.44 3/4. First support is the July 26th gap crossing at $5.84 1/4. Second support is the 50% retracement level of the 2020-2022 rally crossing at $5.74 3/4.
September wheat was higher overnight due to spillover strength from corn while extending the July-August trading range. Overnight trading sets the stage for a higher opening when the day session begins trading. Stochastics and the RSI have turning neutral to bullish signaling that sideways to higher prices are possible near-term. Closes above the July 20th high crossing at $8.43 1/2 would signal that a short-term low has been posted. If September renews the decline off May's high, the 75% retracement level of the January-May high crossing at $7.23 is the next downside target. First resistance is the July 20th high crossing at $8.43 1/2. Second resistance is the 50-day moving average crossing at $9.09 1/2. First support is last-Wednesday's low crossing at $7.52. Second support is the 75% retracement level of the January-May high crossing at $7.23.
September Kansas City wheat was higher overnight as it extends the July-August trading range. Overnight strength sets the stage for a higher opening when the day session begins trading later this morning. Stochastics and the RSI have turned neutral to bullish signaling that sideways to higher prices are possible near-term. Closes above the July 29th high crossing at $9.15 1/4 would confirm that a short-term low has been posted. If September renews the decline off May's high, February's low crossing at $7.64 1/2 the next downside target. First resistance is the July 29th high crossing at $9.15 1/4. Second resistance is the 50-day moving average crossing at $9.75 3/4. First support is the 62% retracement level of the January-May rally crossing at $8.32 3/4. Second support is the February's low crossing at $7.64 1/2.
September Minneapolis wheat was higher overnight and sets the stage for a higher opening when the day session begins trading. Stochastics and the RSI are neutral to bullish signaling that sideways to higher prices are possible near-term. Closes above the July 20th high crossing at $9.56 would signal that a short-term low has been posted while opening the door for additional gains near-term. If September renews the decline of May's high, the 75% retracement level of the January-May rally crossing at $8.12 3/4 is the next downside target. First resistance is the July 20th high crossing at $9.56. Second resistance is the 50-day moving average crossing at $10.27 1/4. First support is last-Wednesday's low crossing at $8.64 3/4. Second support is the 75% retracement level of the January-May high crossing at $8.12 3/4.
SOYBEAN COMPLEX? http://quotes.ino.com/ex?changes/?c=grains "
November soybeans was higher overnight as it extends the rally off last-Wednesday's low. Monday's crop conditions report showed a 1% decline in the good/excellent category. Extended weather forecast are calling for limited chances for precip along with warm temps across much of the Midwest, which will likely lead to further crop deterioration this week. Overnight trading sets the stage for a higher opening when the day session begins trading. Stochastics and the RSI are turning neutral to bullish signaling that sideways to higher prices are possible near-term. If November renews the rally off July's low, the June 30th high crossing at $15.07 3/4 is the next upside target. Closes below the July 26th gap crossing at $13.49 1/4 would temper the near-term friendly outlook. First resistance is the June 30th high crossing at $15.07 3/4. Second resistance is the June 17th high crossing at $15.563/4. First support is the July 26th gap crossing at $13.49 1/4. Second support is July's low crossing at $12.88 1/2.
December soybean meal was higher overnight. The high-range trade overnight sets the stage for a steady to higher opening when the day session begins trading. Stochastics and the RSI are neutral signaling that choppy trading is possible near-term. If December renews the rally off the July 22nd low, March's high crossing at $436.80 is the next upside target. Closes below last-Wednesday's low would renew the decline off July's high while opening the door for a test of the July 22nd low crossing at $380.80. First resistance is July's high crossing at $431.70. Second resistance is March's high crossing at $436.80. First support is last-Wednesday's low crossing at $395.50. Second support is the July 22nd low crossing at $380.80.
December soybean oil was higher overnight as it extends the rally off last-Wednesday's low. The high-range overnight trade sets the stage for a steady to higher opening when the day session begins trading. Stochastics and the RSI are neutral to bullish signaling that sideways to higher prices are possible near-term. Closes above the 50-day moving average crossing at 65.76 would open the door for additional gains near-term. Closes below the 20-day moving average crossing at 60.33 would signal that a short-term top has been posted. First resistance is the 50-day moving average crossing at 65.76. Second resistance is the June 29th high crossing at 67.76. First support is the 20-day moving average crossing at 60.33. Second support is the July 14th low crossing at 54.42.
Thanks much tallpine!
Corn ratings dropped 3% which was a surprise but beans -1% was expected.
Dry weather will hurt beans the most as you noted. It's getting late in the growing season but bean ratings will likely drop several % this month with this forecast.
Cool weather is good for kernel filling for corn and offsets the hurt from dry in August.
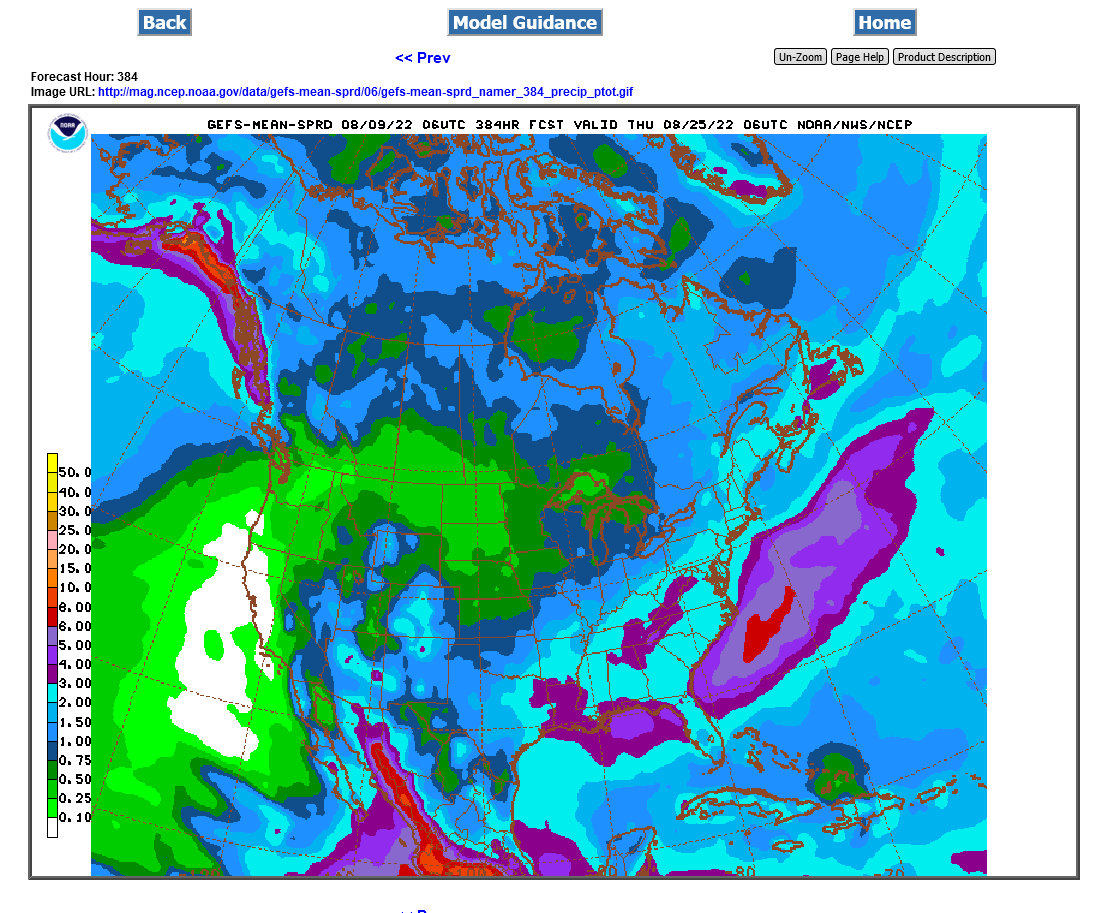
This was the last 6z GFS:
USDA report on Friday, expecting slight downward revisions vs the previous estimates.
Higher CO2 levels allow plants to get their CO2 without opening stomata on the bottom of their leaves as wide, which reduces transpiration and water loss
Higher CO2 causes plants to be more water efficient and drought tolerant. This same forecast 100 years ago with the old climate that had 120 ppm LESS CO2 would be MORE bullish because it would hurt the plants more.
That's in addition to the massive contribution from CO2 fertilization that's increasing growth of most plants by 24% compared to the OLD climate