KEY EVENTS TO WATCH FOR:
Wednesday, August 10, 2022
7:00 AM ET. MBA Weekly Mortgage Applications Survey
Composite Idx (previous 279.2)
Composite Idx, W/W% (previous +1.2%)
Purchase Idx-SA (previous 208.4)
Purchase Idx-SA, W/W% (previous +1.0%)
Refinance Idx (previous 640.6)
Refinance Idx, W/W% (previous +1.5%)
8:30 AM ET. July CPI
CPI, M/M% (previous +1.3%)
Core CPI, M/M% (previous +0.7%)
Energy Idx, M/M% (previous +7.5%)
Food Idx, M/M% (previous +1%)
Real Avg Wkly Pay-Infla Adj, M/M% (previous -1%)
CPI, Y/Y% (previous +9.1%)
Core Annual, Y/Y% (previous +5.9%)
8:30 AM ET. July Real Earnings
10:00 AM ET. June Monthly Wholesale Trade
Inventories, M/M% (previous +1.8%)
10:00 AM ET. July Online Help Wanted Index
10:30 AM ET. EIA Weekly Petroleum Status Report
Crude Oil Stocks (Bbl) (previous 426.553M)
Crude Oil Stocks, Net Chg (Bbl) (previous +4.467M)
Gasoline Stocks (Bbl) (previous 225.294M)
Gasoline Stocks, Net Chg (Bbl) (previous +0.163M)
Distillate Stocks (Bbl) (previous 109.324M)
Distillate Stocks, Net Chg (Bbl) (previous -2.4M)
Refinery Usage (previous 91.0%)
Total Prod Supplied (Bbl/day) (previous 19.948M)
Total Prod Supplied, Net Chg (Bbl/day) (previous -0.028M)
2:00 PM ET. July Monthly Treasury Statement of Receipts & Outlays of the U.S. Govt
Thursday, August 11, 2022
8:30 AM ET. Unemployment Insurance Weekly Claims Report - Initial Claims
Jobless Claims (previous 260K)
Jobless Claims, Net Chg (previous +6K)
Continuing Claims (previous 1416000)
Continuing Claims, Net Chg (previous +48K)
8:30 AM ET. July PPI
PPI, M/M% (previous +1.1%)
Ex-Food & Energy PPI, M/M% (previous +0.4%)
Personal Consumption (previous +1.3%)
8:30 AM ET. U.S. Weekly Export Sales
Corn (Metric Tons) (previous 314.6K)
Soybeans (Metric Tons) (previous 399.6K)
Wheat (Metric Tons) (previous 249.9K)
10:30 AM ET. EIA Weekly Natural Gas Storage Report
Working Gas In Storage (Cbf) (previous 2457B)
Working Gas In Storage, Net Chg (Cbf) (previous +41B)
4:30 PM ET. Foreign Central Bank Holdings
4:30 PM ET. Federal Discount Window Borrowings
Friday, August 12, 2022
8:30 AM ET. July Import & Export Price Indexes
Import Prices (previous +0.2%)
Non-Petroleum Prices (previous -0.4%)
Petroleum Prices (previous +5%)
10:00 AM ET. August University of Michigan Survey of Consumers - preliminary
Mid-Mo Sentiment (previous 51.1)
Mid-Mo Expectations (previous 47.3)
Mid-Mo Current Idx (previous 57.1)'
12:00 PM ET. World Agricultural Supply & Demand Estimates (WASDE)
Corn, End Stocks (Bushels)
Soybeans, End Stocks (Bushels)
Wheat, End Stocks (Bushels)
Cotton, End Stocks (Bales)
The STOCK INDEXES? http://quotes.ino.com/ex?changes/?c=indexes
The Dow closed lower on Tuesday as it consolidates some of the rally off June's low. The mid-range close sets the stage for a steady to lower opening when Wednesday's night session begins trading. Stochastics and the RSI are overbought but remain neutral to bullish signaling that sideways to higher prices are possible near-term. If the Dow extends the rally off June's low, June's high crossing at 33,272.34 is the next upside target. Closes below the 20-day moving average crossing at 32,093.56 would signal that a short-term top has been posted. First resistance is June's high crossing at 33.272.34. Second resistance is May's high crossing at 34,117.74. First support is the 20-day moving average crossing at 32,093.56. Second support is the 50-day moving average crossing at 31,728.72.
The September NASDAQ 100 closed lower on Tuesday as it consolidated some of the rally off June's low. Today's low-range close sets the stage for a steady to lower opening when Wednesday's night session begins trading. Stochastics and the RSI are overbought and are poised to turn neutral to bearish with additional weakness that would signal sideways to lower prices are possible. Closes below the 20-day moving average crossing at 12,600.42 would signal that a short-term top has been posted while opening the door for additional weakness near-term. If September extends the rally off June's low, the 50% retracement level of the 2021-2022 decline crossing at 13,812.10 is the next upside target. First resistance is Monday's high crossing at 13,419.25. Second resistance is the 50% retracement level of the 2021-2022 decline crossing at 13,812.10. First support is is the 20-day moving average crossing at 12,600.42. Second support is the 50-day moving average crossing at 12,232.84.
The September S&P 500 closed lower on Tuesday as it extends the trading range of the past seven-days. The low-range close sets the stage for a steady to lower opening when Wednesday's night session begins trading. Stochastics and the RSI are overbought but remain neutral to bullish signaling that sideways to higher prices are possible near-term. If September extends the rally off June's low, the 50% retracement level of the January-June decline crossing at 4215.81 is the next upside target. Closes below the 20-day moving average crossing at 4011.07 would confirm that a short-term top has been posted. First resistance is the 50% retracement level of the January-June decline crossing at 4215.81. Second resistance is the April 28th high crossing at 4308.50. First support is the 20-day moving average crossing at 4011.07. Second support is the July 14th low crossing at 3723.75.
INTEREST RATES? http://quotes.ino.com/ex?changes/?c=interest ""
September T-bonds closed down 3-pts. at 142-15.
September T-bonds closed slightly lower on Tuesday. The mid-range close sets the stage for a steady to lower opening when Wednesday's night session begins trading. Stochastics and the RSI are neutral to bearish signaling that sideways to lower prices are possible near-term. Closes below last-Friday's low crossing at 140-19 would confirm that a short-term top has been posted while opening the door for additional weakness near-term. If September renews the rally off June's low, the 50% retracement level of the 2021-2022 decline crossing at 147-27 is the next upside target. First resistance is last-Tuesday's high crossing at 145-31. Second resistance is the 50% retracement level of the 2021-2022 decline crossing at 147-27. First support is last-Friday's low crossing at 140-19. Second support is the 50-day moving average crossing at 138-24.
September T-notes closed down 85-pts. at 119.190.
September T-notes closed lower on Tuesday and is poised to extend the decline off last-Tuesday's high. The low-range close sets the stage for a steady to lower opening when Wednesday's night session begins trading. Stochastics and the RSI have turned neutral to bearish signaling sideways to lower prices are possible near-term. If September extends the decline off last-Tuesday's high, the 50-day moving average crossing at 118.143 is the next downside target. If September renews the rally off June's low, the 50% retracement level of the December-June decline crossing at 122.204 is the next upside target. First resistance is last-Tuesday's high crossing at 122.020. Second resistance is the 50% retracement level of the December-June decline crossing at 122.204. First support is the 50-day moving average crossing at 118.143. Second support is the July 21st low crossing at 117.145.
ENERGY MARKETS? http://quotes.ino.com/ex?changes/?c=energy ""
September crude oil closed slightly lower on Tuesday. The mid-range close sets the stage for a steady to lower opening when Wednesday's night session begins. Stochastics and the RSI are oversold but remain neutral to bearish signaling that sideways to lower prices are possible near-term. If September extends the decline off June's high, the 38% retracement level of the 2021-2022 rally crossing at $86.43 is the next downside target. Closes above the 20-day moving average crossing at $94.71 would temper the near-term bearish outlook. First resistance is the July 29th high crossing at $101.88. Second resistance is the 50-day moving average crossing at $102.34. First support is the 38% retracement level of the 2021-2022 rallycrossing at $86.43. Second support is the 50% retracement level of the 2021-2022 rallycrossing at $76.56.
September heating oil closed higher on Tuesday as it consolidated some of the decline off the July 28th high crossing at 3.7308. The high-range close sets the stage for a steady to higher opening when Wednesday's night trading session begins. Stochastics and the RSI are oversold but are poised to turn neutral to bullish with additional strength that would signal that a short-term low has been posted. If September extends the decline off June's high, the 50% retracement level of the 2021-2022 rally crossing at 2.8185 is the next downside target. Closes above the 20-day moving average crossing at 3.4743 would signal that a short-term low has been posted. First resistance is the 20-day moving average crossing at 3.4743. Second resistance is the July 28th high crossing at $3.7308. First support is the 38% retracement level of the 2021-2022 rally crossing at 3.1874. Second support is the 50% retracement level of the 2021-2022 rally crossing at 2.8185.
September unleaded gas closed higher on Tuesday as it consolidated some of the decline off June's high. The high-range close sets the stage for a steady to higher opening when Wednesday's night session begins trading. Stochastics and the RSI have turned neutral to bullish signaling that sideways to higher prices are possible near-term. Closes above last-Wednesday's high crossing at $3.1427 would signal that a short-term low has been posted. If September extends the decline off June's high, the 50% retracement level of the 2021-2022 rally crossing at 2.4586 is the next downside target. First resistance is the July 29th high crossing at $3.2492. Second resistance is the 50-day moving average crossing at $3.3548. First support is the 38% retracement level of the 2021-2022 rally crossing at 2.8073. Second support is the 50% retracement level of the 2021-2022 rally crossing at 2.4586.
September Henry natural gas poised an inside day with a higher close on Tuesday as it consolidates some of the decline off July's high. The high-range close sets the stage for a steady to higher opening when Wednesday's night session begins trading. Stochastics and the RSI remain neutral to bearish signaling that sideways to lower prices are possible near-term. Closes below the 50-day moving average crossing at 7.473 would signal that a short-term top has been posted. If September renews the rally off July's low, June's high crossing at 9.598 is the next upside target. First resistance is July's high crossing at 9.419. Second resistance is June's high crossing at 9.598. First support is the 50-day moving average crossing at 7.473. Second support is the July 15th low crossing at 6.351.
CURRENCIES? http://quotes.ino.com/ex?changes/?c=currencies ""
The September Dollar closed lower on Tuesday. The high-range close sets the stage for a steady to lower opening when Wednesday's nights session begins trading. Stochastics and the RSI remain neutral to bullish signaling sideways to higher prices are possible near-term. Closes above the 20-day moving average crossing at 106.621 would signal that a short-term low has been posted. Closes below the 50-day moving average crossing at $105.321 would open the door for additional weakness near-term. First resistance is the July 27th high crossing at $107.300. Second resistance is July's high crossing at $109.140. First support is the 50-day moving average crossing at $105.321. Second support is the June 16th low crossing at 103.200.
The September Euro closed slightly higher on Tuesday as it extends the trading range of the past five-weeks. The mid-range close sets the stage for a steady to higher opening when Wednesday's night session begins trading. Stochastics and the RSI are neutral to bearish signaling that sideways to lower prices are possible near-term. If September renews the decline, the December-2002 low on the monthly continuation chart crossing at $0.98540 is the next downside target. Closes above the July 21st high crossing at $1.03200 would signal that a low has been posted while opening the door for additional gains near-term. First resistance is the July 21st high crossing at $1.03200. Second resistance is the 50-day moving average crossing at $1.04148. First support is the July 14th low crossing at $1.00000. Second support is the December-2002 low on the monthly continuation chart crossing at $0.98540.
The September British Pound closed slightly lower on Tuesday. The low-range close sets the stage for a steady to slightly lower opening when Wednesday's night session begins trading. Stochastics and the RSI remain neutral to bearish signaling sideways to lower prices are possible near-term. Closes below last-Friday's low crossing at 1.2012 would temper the near-term friendly outlook. If September renews the rally off July's low, the 25% retracement level of the 2021-2022 decline crossing at 1.2385 is the next upside target. First resistance is the 25% retracement level of the 2021-2022 decline crossing at 1.2385. Second resistance is the May high crossing at 1.2677. First support is last-Friday's low crossing at 1.2012. Second support is July's low crossing at 1.1778.
The September Swiss Franc closed higher on Tuesday. The mid-range close sets the stage for a steady to higher opening when Wednesday's night session begins trading. Stochastics and the RSI are neutral signaling that sideways trading is possible near-term. Closes below the 50-day moving average crossing at 1.03889 would signal that a short-term top has been posted. If September renews the rally off July's low, the 38% retracement level of the 2021-2022 decline crossing at 1.06242 is the next upside target.First resistance is the 38% retracement level of the 2021-2022 decline crossing at 1.06242. Second resistance is the 50% retracement level of the 2021-2022 decline crossing at 1.08120. First support is the 50-day moving average crossing at 1.03889. Second support is the July 14thcrossing at 1.01650. Third support is June's low crossing at 1.00235.
The September Canadian Dollar posted an inside day with a lower close on Tuesday as it extends the trading range of the past three-weeks. The low-range close sets the stage for a steady to lower opening when Wednesday's night session begins trading. Stochastics and the RSI are neutral to bearish signaling that sideways to lower prices are possible near-term. If September extends the decline off last-Monday's high, the July 5th low crossing at 76.43 is the next downside target. If September renews the rally off July's low, the 62% retracement level of the April-July decline crossing at 78.67 is the next upside target. First resistance is the 50% retracement level of the April-July decline crossing at 78.09. Second resistance is the 62% retracement level of the April-July decline crossing at 78.67. First support is the July 5th low crossing at 76.43. Second support is July's low crossing at 75.61.
The September Japanese Yen closed slightly lower on Tuesday. The low-range close sets the stage for a steady to lower opening when Wednesday’s night session begins trading. Stochastics and the RSI are neutral to bearish signaling that sideways to lower prices are possible near-term. Closes below the 20-day moving average crossing at 0.073899 is the next downside target. If September renews the rally off July's low, the 38% retracement level of this year's decline crossing at 0.078281 is the next upside target. First resistance is last-Tuesday's high crossing at 0.076960. Second resistance is the 38% retracement level of the crossing at 0.078281. First support is the 20-day moving average crossing at 0.073899. Second support is July's low crossing at 0.072085.
PRECIOUS METALS? http://quotes.ino.com/ex?changes/?c=metals ""
December gold closed higher on Tuesday and above the 50-day moving average crossing at $1806.30 thereby opening the door for additional gains near-term. The high-range close sets the stage for a steady to higher opening when Wednesday's night session begins trading. Stochastics and the RSI are overbought but remain neutral to bullish signaling that sideways to higher prices are possible near-term. Closes below the 20-day moving average crossing at $1759.20 would signal that a short-term top has been posted. First resistance is the 38% retracement level of the March-July decline crossing at $1846.60. Second resistance is the 50% retracement level of the March-July decline crossing at $1894.90. First support is the 10-day moving average crossing at $1785.80. Second resistance is the 20-day moving average crossing at $1759.20.
September silver posted an inside day with a lower close on Tuesday as it consolidates some of the rally off July's low. The low-range close sets the stage for a steady to lower opening when Wednesday's night session begins trading. Stochastics and the RSI are overbought but remain neutral to bullish signaling that sideways to higher prices are possible near-term. If September extends the rally off July's low, the 38% retracement level of the March-July decline crossing at 21.575. Closes below the 20-day moving average crossing at 19.329 would signal that a short-term top has been posted. First resistance is Monday's high crossing at 20.745 Second resistance is the 38% retracement level of the March-July decline crossing at 21.575. First support is the 20-day moving average crossing at 19.329. Second support is the July 14th low crossing at 18.010.
September copper closed slightly lower on Tuesday. The mid-range close sets the stage for a steady to lower opening when Wednesday's night session begins trading. Stochastics and the RSI are overbought but remain neutral to bullish signaling that sideways to higher prices are possible near-term. If September extends the rally off July's low, the 50-day moving average crossing at 3.7580 opens the door for additional gains near-term. Closes below the 20-day moving average crossing at 3.4164 would signal that a short-term top has been posted. First resistance is today's high crossing at 3.6305. Second resistance is the 50-day moving average crossing at 3.7580. First support is the 20-day moving average crossing at 3.4164. Second support is the July 15th low crossing at 3.1315.
GRAINS? http://quotes.ino.com/ex?changes/?c=grains "
December Corn closed up $0.06 3/4-cents at $6.14.
December corn closed higher on Tuesday following Monday's crop conditional report that showed a 3% decline in the good/excellent category. A sell off ahead of the close tempered early-session gains and the low-range close sets the stage for a steady to lower opening when Wednesday's night session begins trading. Stochastics and the RSI have turned neutral to bullish signaling that sideways to higher prices are possible near-term. If December extends the rally off July's low, the 50-day moving average crossing at $6.44 1/2 is the next upside target. Closes below the July 26th gap crossing at $5.84 1/4 would temper the near-term neutral to friendly outlook. First resistance is the July 29th high crossing at $6.36 1/2. Second resistance is the 50-day moving average crossing at $6.44 1/2. First support is the July 26th gap crossing at $5.84 1/4. Second support is the 50% retracement level of the 2020-2022 rally crossing at $5.74 3/4.
September wheat closed up $0.01 3/4-cents at $7.81 1/2.
September wheat closed higher on Tuesday while extending the trading range of the past four-weeks. The low-range close sets the stage for a steady to lower opening when Wednesday's night session begins trading. Stochastics and the RSI are turning neutral to bullish signaling that sideways to higher prices are possible near-term. Closes above the July 29th high crossing at $8.45 3/4 would signal that a short-term low has been posted while marking a potential upside breakout of the aforementioned trading range. If September renews the decline off May's high, the 75% retracement level of the January-May rally crossing at $7.23 is the next downside target. First resistance is the July 29th high crossing at $8.45 3/4. Second resistance is the July 11th high crossing at $9.40 1/4. First support is last-Wednesday's low crossing at $7.52. Second support is the 75% retracement level of the January-May's rally crossing at $7.23.
September Kansas City Wheat closed down $0.04-cents at $8.51 3/4.
September Kansas City wheat closes higher on Tuesday as it extends the trading range of the past four-weeks. The mid-range close sets the stage for a steady to higher opening when Wednesday's night session begins trading. Stochastics and the RSI are neutral signaling that sideways trading is possible near-term. If September renews the decline off May's high, February's low crossing at $7.64 1/2 is the next downside target. Closes above the July 29th high crossing at $9.15 1/4 would signal that a short-term low has been posted. First resistance is the July 29th high crossing at $9.15 1/4. Second resistance is the 50-day moving average crossing at $9.75 1/2. First support is July's low crossing at $8.14 1/2. Second support is February's low crossing at $7.64 1/2.
September Minneapolis wheat closed up $0.12-cents at $8.92 3/4.
September Minneapolis wheat closed higher on Tuesday as it extends the trading range of the past four-weeks. The mid-range close sets the stage for a steady to higher opening when Wednesday's night session begins trading. Stochastics and the RSI have turned neutral to bullish signaling that sideways to higher prices are possible near-term. Closes above the July 20th high crossing at $9.56 would signal that a short-term low has been posted. If September resumes the decline off May's high, the 75% retracement level of the January-May rally crossing at $8.12 3/4 is the next downside target. First resistance is the July 20th high crossing at $9.56. Second resistance is the 50-day moving average crossing at $10.27 1/4. First support is last-Wednesday's low crossing at $8.64 3/4. Second support is the 75% retracement level of the January-May rally crossing at $8.12 3/4.
SOYBEAN COMPLEX? http://quotes.ino.com/ex?changes/?c=grains "
November soybeans closed up $0.28 3/4-cents at $14.28 3/4.
November soybeans closed higher on Tuesday as it extends the rally off last-Wednesday's low. The high-range close sets the stage for a steady to higher opening when Wednesday's night session begins trading. Stochastics and the RSI are neutral to bullish signaling that sideways to higher prices are possible near-term. If November renews the rally off July's low, the June 30th high crossing at $15.07 3/4 is the next upside target. Closes below the 20-day moving average crossing at $13.79 1/4 would confirm that a short-term top has been posted. First resistance is the July 29th high crossing at $14.89. Second resistance is the June 30th high crossing at $15.07 3/4. First support is the bottom of the July 26th gap crossing at $13.49 1/4. Second support is the 38% retracement level of the 2020-2022 rally crossing at $12.99 1/4.
December soybean meal closed up $11.10 at $410.20.
December soybean meal closed higher on Tuesday. The mid-range close sets the stage for a steady to higher opening when Wednesday's night session begins trading. Stochastics and the RSI are neutral signaling that sideways trading is possible near-term. If December resumes the rally off July's low, March's high crossing at $436.80 is the next upside target. Multiple closes below last-Wednesday's low crossing at $395.50 would signal that a short-term top has been posted. First resistance is March's high crossing at $436.80. Second resistance is February's high crossing at $439.00. First support is last-Wednesday's low crossing at $395.50. Second support is the July 22nd low crossing at $380.80.
December soybean oil closed up 30-pts. at 64.62.
December soybean oil posted an inside day with a higher close on Tuesday. The low-range close sets the stage for a steady to slightly higher opening when Wednesday's night session begins trading. Stochastics and the RSI have turned neutral to bullish signaling that sideways to higher prices are possible near-term. If December extends the rally off last-Wednesday's low, the June 29th crossing at 67.76 is the next upside target. Closes below the 20-day moving average crossing at 60.31 would signal that a short-term top has been posted. First resistance is the 50-day moving average crossing at 65.76. Second resistance is the June 29th high crossing at 67.76. First support is the 20-day moving average crossing at 60.31. Second support is July's low crossing at 54.42.
LIVESTOCKhttp://quotes.ino.com/exchanges/?c=livestock
October hogs closed down $0.53 at $99.78.
October hogs posted an inside day with a lower close on Tuesday as it consolidates some of the rally off July's low. The high-range close sets the stage for a steady to higher opening when Wednesday's session begins trading. Stochastics and the RSI are overbought but remain neutral to bullish signaling that sideways to higher prices are possible near-term. If October extends the rally off July's low, weekly resistance crossing at $103.72 is the next upside target. Closes below the 50-day moving average crossing at $93.83 would signal that a short-term top has been posted. First resistance is Monday's high crossing at $100.75. Second resistance is weekly resistance crossing at $103.72. First support is the 50-day moving average crossing at $93.83. Second support is the July 26th low crossing at $92.43.
October cattle closed down $0.98 at $143.25
October cattle closed lower on Tuesday as it consolidates some of the rally off May's low. The low-range close sets the stage for a steady to lower opening on Wednesday. Stochastics and the RSI are overbought but are turning neutral to bearish signaling that sideways to lower prices are possible near-term. Closes below the 20-day moving average crossing at $142.18 would confirm that a short-term top has been posted. If October extends the rally off June's low, May's high crossing at $145.10 is the next upside target. First resistance is May's high crossing at $145.10. Second resistance is the top of the April 25th gap crossing at $145.98. First support is the 20-day moving average crossing at $142.18. Second support is the 50-day moving average crossing at $140.95.
September Feeder cattle closed down $2.95 at $182.70.
September Feeder cattle closed sharply lower on Tuesday. The low-range close sets the stage for a steady to lower opening when Wednesday's session begins trading. Stochastics and the RSI are poised to turn neutral to bearish signaling that sideways to lower prices are possible near-term. Close below the July 29th low crossing at $178.28 would confirm that a short-term top has been posted while opening the door for additional weakness near-term. If September extends the rally off May's low, February's high crossing at $188.25 is the next upside target. First resistance is Monday's high crossing at $186.25. Second resistance is February's high crossing at $188.25. First support is the July 29th low crossing at $178.28. Second support is the 50-day moving average crossing at $177.99.
FOOD & FIBERhttp://quotes.ino.com/ex changes/?c=food
September coffee closed higher on Tuesday. The high-range close sets the stage for a steady to higher opening on Wednesday. Stochastics and the RSI are neutral to bearish signaling that sideways to lower prices are possible near-term. Closes below the reaction low crossing at $20.42 would signal that a short-term top has been posted. Closes above the 50-day moving average crossing at $22.12 would open the door for additional gains near-term. First resistance is the 50-day moving average crossing at $22.12. Second resistance is July's high crossing at $22.90. First support is the reaction low crossing at $20.42. Second support is July's low crossing at $19.60.
September cocoa closed higher on Tuesday. The high-range close sets the stage for a steady to higher opening on Wednesday. Stochastics and the RSI are turning neutral to bullish signaling sideways to higher prices are possible near-term. Closes above the 50-day moving average crossing at 23.84 would open the door for additional gains near-term. Closes below last-Thursday's low crossing at 22.59 would signal that a short-term top has been posted.
October sugar closed slightly higher on Tuesday. The high-range close sets the stage for a steady to higher opening on Wednesday. Stochastics and the RSI are neutral to bullish signaling that sideways to higher prices are possible near-term. Closes above the 20-day moving average crossing at 18.13 would signal that a short-term low has been posted. If October extends the decline off July's high, the 38% retracement level of the 2020-2022 rally crossing at 16.88 is the next downside target.
December cotton closed sharply higher on Tuesday as it extends the rally off July's low. The high-range close sets the stage for a steady to higher opening on Wednesday. Stochastics and the RSI are neutral to bullish signaling that sideways to higher prices are possible near-term. If December extends the rally off July's low, the 50-day moving average crossing at 102.64 is the next upside target. Closes below the 20-day moving average crossing at 93.15 would signal that a short-term top has been posted.
Thanks tallpine!
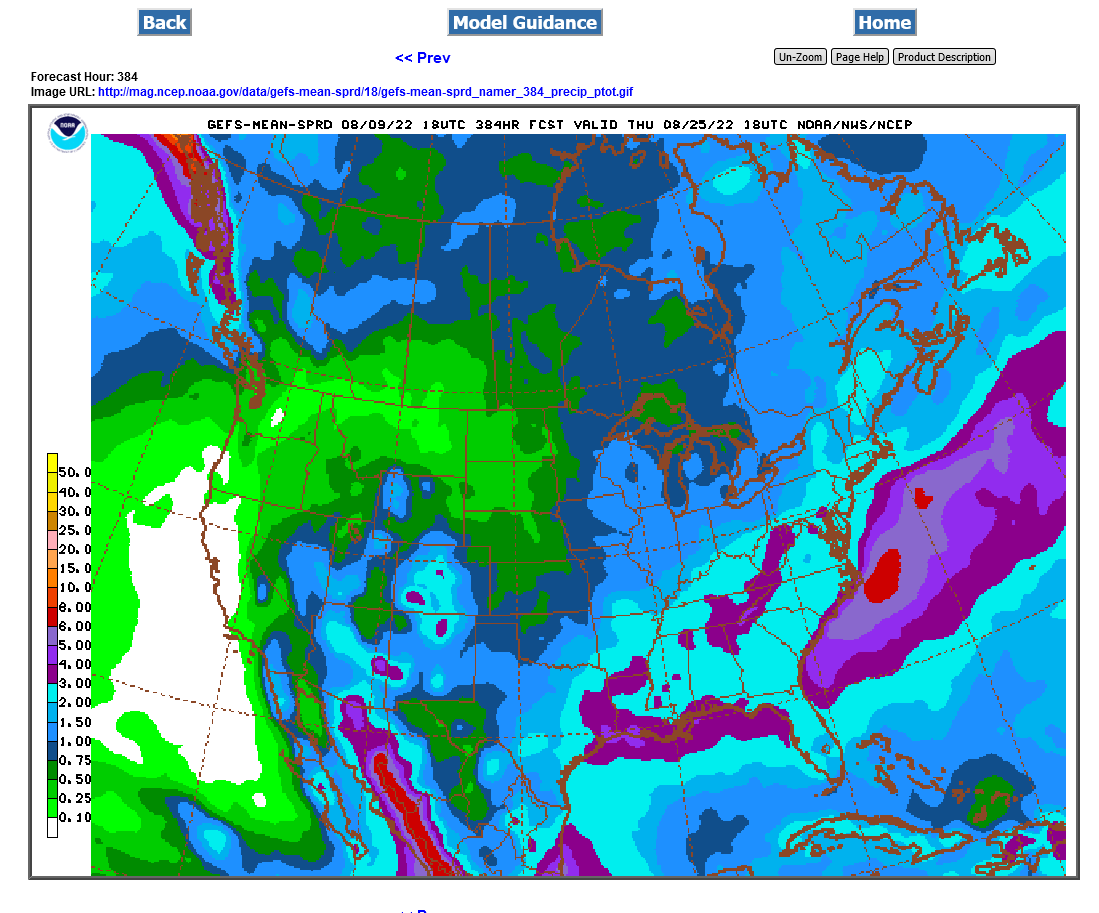
A bit more rain on the latest 18z GFS ensemble mean but still pretty dry for the WCB and the heat is OFF!