Source: NSIDC Arctic Sea Ice Chart
Snowfan here zooms in on the chart for greater detail and reports that for this date, ice extent in the Arctic stands at a 12-year high:
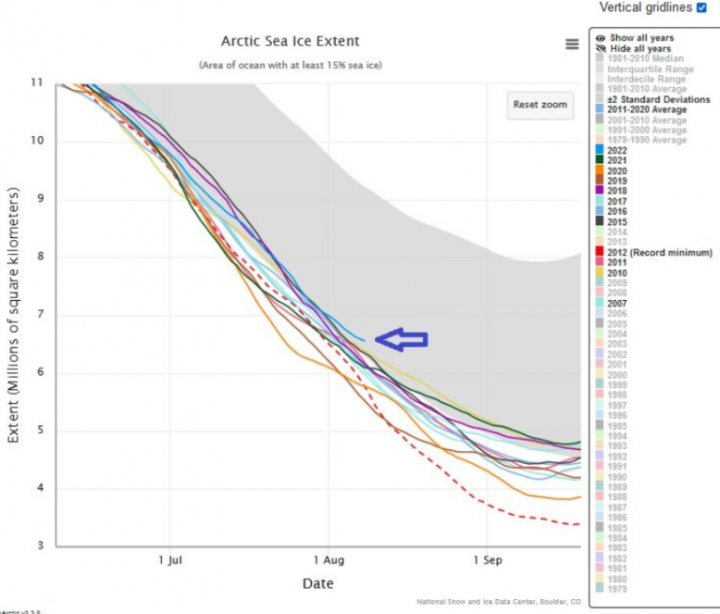
It would be accurate to say that Al Gore’s prediction has turned out to be on par from what you’d expect from a swindling fortune teller reading tea leaves and a crystal ball.
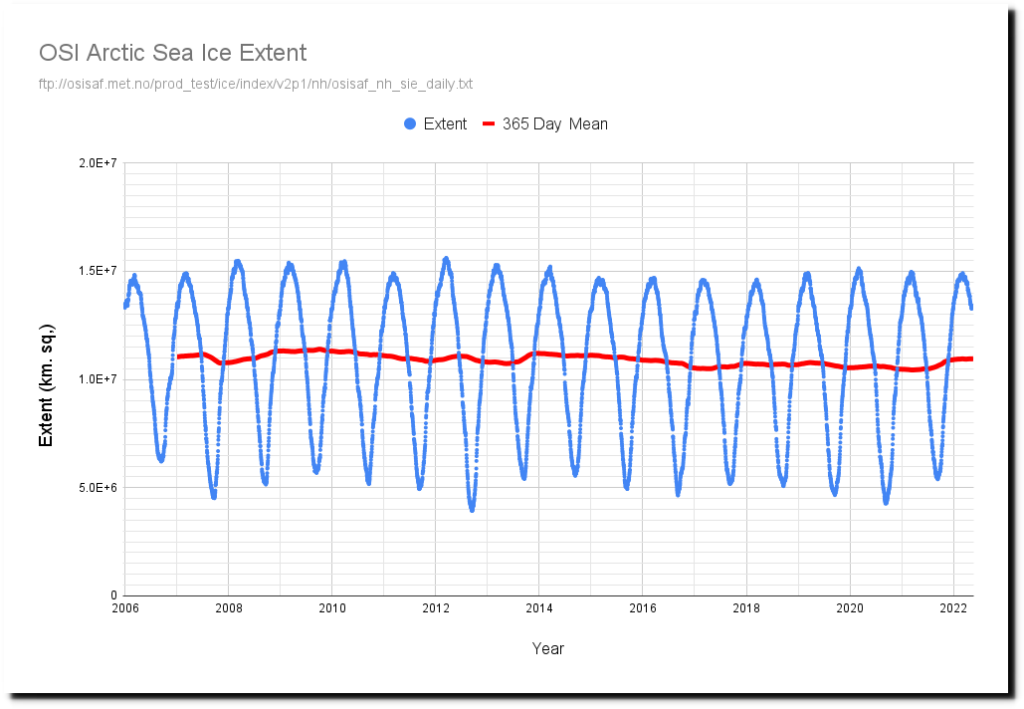
There has been no trend in Arctic Sea ice since 2006.
https://realclimatescience.com/ice-free-arctic-forecasts-3/
metmike:
Below is what was supposed to happen according to many forecasts.........Summer ice almost all melted.
Since 1986, the Australian Institute of Marine Science (AIMS) surveys roughly 100 of the 3000 coral reefs of the Great Barrier Reef (GBR). Ridd used this data to construct the coral cover since 1986 (Figure 1) which shows that the GBR has record high coral cover.

Figure 1: Coral cover since 1986: Coral cover for 2022 is very high.

Hey Mike,
I agree that the Arctic ice extent and area have both made a nice recovery vs the average of 2007-21. This is a copy of what a pro met. just posted at a wx bb that I frequent that I've told you about:
"Update:
As of 8/13, the NSIDC SIA was 4.07 million sq km. Here’s how other post-2007 years compare on the same date:
2021: -240k
2020: -960k
2019: -850k
2018: +100k
2017: -340k
2016: -470k
2015: -490k
2014: +480k
2013: +190k
2012: -1.04 million (-1040k)
2011: -650k
2010: +80k
2009: +250k
2008: -350k
2007: -690k"
--------
Here was my response:
"This latest area update brings 2022 back down a decent amount vs the average of 2007-21. It is now at +330K vs the prior 15 year average for the date as compared to +390 as of three days ago.
Recap of current area vs avg. of last 15 years as of:
6/15/22: +70K
6/16/22: +120K
6/20/22: +240K
6/22/22: +140K
6/29/22: -140K
7/1/22: +70K
7/10/22: +250K
7/12/22: +370K
7/16/22: +330K
7/20/22: +360K
7/23/22: +480K
7/26/22: +460K
7/30/22: +440K
8/7/22: +320K
8/10/22: +390K
8/13/22: +330K"
--------------------
So, this is a nice recovery vs 2007-21. But I'd be cautious about getting overly excited about this for two reasons:
1) Extent is still well below the average of the 1980s and even the 1990s. It is well below 1980-2006 avg.
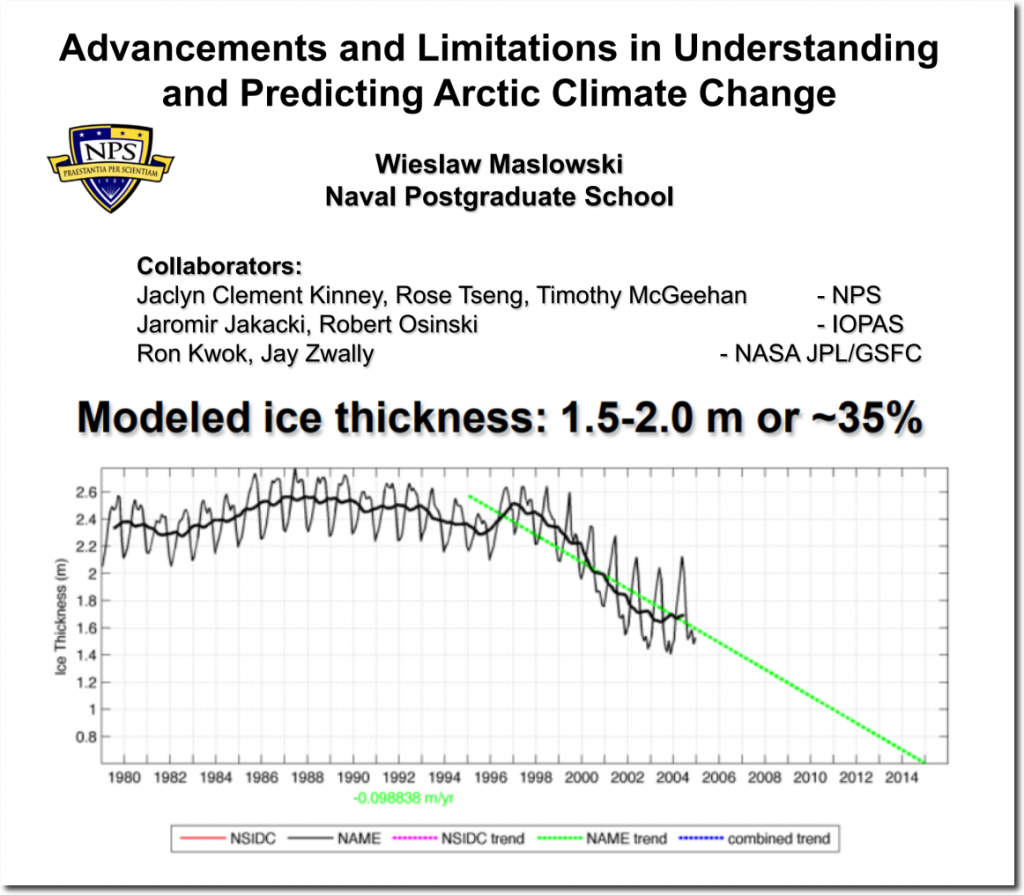
2) Thickness is still way down due to much less multiyear ice. Thus, volume is still very worrisome. So, extent and area remain vulnerable to going right back down to recent lows.
More on thickness from a 10/7/21 tweet from National Snow and Ice Data Center:
"Despite September total #Arctic sea ice extent being high compared to recent years, the amount of multiyear ice as assessed from ice age reached a near-record low, with an extent of only 1.29 MM sq km."
Thanks for the awesome reply Larry.
You will note that I didn't include any comments with the articles myself but will enthusiastically do that now that we have somebody tuned in that clearly understands what's going on.
1. The recovery in ice is very likely temporary and likely, part of it is the result of the current WEATHER La Nina that has contributed to the pause in the warming. CO2 greenhouse gas warming is not over. During the next El Nino, the planet will likely start warming again and the ice start melting again.
2. However, this La Nina and the 1 from 2 decades ago are the longest lived La Nina's in the last century. There could be something else going on that favors more planet cooling La Nina's to offset greenhouse gas warming vs planet warming El Nino's that enhance global warming. The recent slow down in global warming has featured more La Nina's. Global warming had accelerated in the 1980s/90s. There was global cooling in the 50s/60s/70s. Overall, the global temp is +1 deg C in the last century and the uptrend is still alive.
3.. This is a profound example of something that we discussed earlier this summer related to the molecular physics of greenhouse gas warming. It absorbs the most heat from long wave radiation in wave bands not swamped by H2O(H2O is responsible for 95% of the greenhouse gas affect).......which is very cold and very dry places..........which is the Arctic in the Winter NOT the Summer. This causes the greenhouse gas warming affect in the Summer to be MUCH less than the Winter.
This explained it in detail:
https://www.marketforum.com/forum/topic/87422/#87438
So the CO2 warming in the Summer is dampened out by more H2O in the warm season which was always there in previous years. This happens most years on the graph. Sea ice amounts go down to the lower part of the graph compared to recent years in many Winters with more warmth........then it goes back up to the higher part of the graph in the Summer with CO2 warming minimized.
4. Of course multi year ice will still be low by definition. Any rebound of new ice.........is new ice which can't be multi year ice.
5. The main point for me is that we are NOT seeing the accelerating "death spiral" that was predicted 15 years ago by numerous sources. Almost nobody getting attention claimed the ice loss would have any sort of pause like this. Many sources claimed all the sea ice would be gone in the Summer, starting almost a decade ago.
The death spiral FALSE narrative, like all the hundreds of constant FALSE narratives are political, not scientific rhetoric intended to scare people so they can kill fossil fuels. They are DISinformation, junk science that rules mainstream fake climate crisis everything and people like me showing AUTHENTIC science have been labeled as deniers.
The other side is, like every other realm in politics(this is politics, not science) is that people on the other side (deniers) tend to take the opposite extreme instinctively.
So they interpret EVERYTHING to be the opposite of mainstream climate crisis propaganda...........and miss the REAL greenhouse gas affect.
Some deniers really are deniers of the clear physics of slight greenhouse gas warming(which is mostly beneficial to life).
The alarmist side loves this. Then, they can mischaracterize and claim that all deniers don't believe in any greenhouse gas warming.
We all remember how they totally abused this topic to manufacture fake news about polar bears being threatened because polar bears live in the Arctic.
When authentic scientific data came out that showed the polar bear population had increased 30% since 2005 and was NOT being decimated as predicted, did we hear the truth?
https://www.marketforum.com/forum/topic/79542/#79549
No.
Just a repeat of all the false narratives to reinforce the DISinformation/fake news about polar bears and Arctic Sea Ice.
Temperatures in the Arctic were likely MUCH warmer than this with LESS Arctic sea ice than this for thousands of years between 9,000 to 5,000 years ago during the Holocene Climate OPTIMUM.
https://en.wikipedia.org/wiki/Holocene_climatic_optimum
How did the polar bears do so well then?
Previous discussion on this topic:
https://www.marketforum.com/forum/topic/83763/