KEY EVENTS TO WATCH FOR:
Monday, August 15, 2022
8:30 AM ET. August Empire State Manufacturing Survey
Mfg Idx (previous 11.1)
Employment Idx (previous 18.0)
New Orders Idx (previous 6.2)
Prices Received (previous 31.3)
10:00 AM ET. August NAHB Housing Market Index
Housing Mkt Idx (previous 55)
4:00 PM ET. June Treasury International Capital Data
Tuesday, August 16, 2022
8:30 AM ET. July New Residential Construction - Housing Starts and Building Permits
Total Starts (previous 1.559M)
Housing Starts, M/M% (previous -2.0%)
Building Permits (previous 1.685M)
Building Permits, M/M% (previous -0.6%)
8:55 AM ET. Johnson Redbook Retail Sales Index
Ret Sales Mo-to-Date, M/M%
Ret Sales Mo-to-Date, Y/Y% (previous +10.4%)
Latest Wk, Y/Y% (previous +10.4%)
9:15 AM ET. July Industrial Production & Capacity Utilization
Industrial Production, M/M% (previous -0.2%)
Capacity Utilization % (previous 80.0%)
Capacity Utilization, Net Chg (Pts) (previous -0.3)
4:30 PM ET. API Weekly Statistical Bulletin
Crude Stocks, Net Chg (Bbls) (previous +2.2M)
Gasoline Stocks, Net Chg (Bbls) (previous -0.6M)
Distillate Stocks, Net Chg (Bbls) (previous +1.4M)
Wednesday, August 17, 2022
7:00 AM ET. MBA Weekly Mortgage Applications Survey
Composite Idx (previous 279.8)
Composite Idx, W/W% (previous +0.2%)
Purchase Idx-SA (previous 205.4)
Purchase Idx-SA, W/W% (previous -1.4%)
Refinance Idx (previous 662.9)
Refinance Idx, W/W% (previous +3.5%)
8:30 AM ET. July Advance Monthly Sales for Retail & Food Services
Overall Sales-SA, M/M% (previous +1.0%)
Sales, Ex-Auto, M/M% (previous +1.0%)
Sales, Ex-Auto & Gas, M/M% (previous +0.7%)
10:00 AM ET. June Manufacturing & Trade: Inventories & Sales
Total Inventories (previous +1.4%)
10:30 AM ET. EIA Weekly Petroleum Status Report
Crude Oil Stocks (Bbl) (previous 432.01M)
Crude Oil Stocks, Net Chg (Bbl) (previous +5.457M)
Gasoline Stocks (Bbl) (previous 220.316M)
Gasoline Stocks, Net Chg (Bbl) (previous -4.978M)
Distillate Stocks (Bbl) (previous 111.49M)
Distillate Stocks, Net Chg (Bbl) (previous +2.166M)
Refinery Usage (previous 94.3%)
Total Prod Supplied (Bbl/day) (previous 19.474M)
Total Prod Supplied, Net Chg (Bbl/day) (previous -0.474M)
2:00 PM ET. Federal Open Market Committee meeting minutes published
Thursday, August 18, 2022
8:30 AM ET. August Philadelphia Fed Business Outlook Survey
Business Activity (previous -12.3)
Prices Paid (previous 52.2)
Employment (previous 19.4)
New Orders (previous -24.8)
Prices Received (previous 30.3)
Delivery Times (previous -10.2)
Inventories (previous -9.3)
Shipments (previous 14.8)
8:30 AM ET. Unemployment Insurance Weekly Claims Report - Initial Claims
Jobless Claims (previous 262K)
Jobless Claims, Net Chg (previous +14K)
Continuing Claims (previous 1428000)
Continuing Claims, Net Chg (previous +8K)
8:30 AM ET. U.S. Weekly Export Sales
Corn (Metric Tons) (previous 383.1K)
Soybeans (Metric Tons) (previous 410.5K)
Wheat (Metric Tons) (previous 359.2K)
10:00 AM ET. July Existing Home Sales
Existing Sales (previous 5.12M)
Existing Sales, M/M% (previous -5.4%)
Unsold Homes Month's Supply (previous 3.0)
Median Price (USD) (previous 416000)
Median Home Price, Y/Y% (previous +13.4%)
10:00 AM ET. July Leading Indicators
Leading Index, M/M% (previous -0.8%)
Leading Index
Coincident Index, M/M% (previous +0.2%)
Lagging Index, M/M% (previous +0.8%)
10:30 AM ET. EIA Weekly Natural Gas Storage Report
Working Gas In Storage (Cbf) (previous 2501B)
Working Gas In Storage, Net Chg (Cbf) (previous +44B)
4:30 PM ET. Federal Discount Window Borrowings
4:30 PM ET. Foreign Central Bank Holdings
Friday, August 19, 2022
10:00 AM ET. 2nd Quarter Quarterly Retail E-Commerce Sales
10:00 AM ET. 2nd Quarter Advance Quarterly Services
10:00 AM ET. July State Employment and Unemployment
N/A U.S: Hawaii Statehood Day
The STOCK INDEXES? http://quotes.ino.com/ex?changes/?c=indexes
The STOCK INDEXES: The September NASDAQ 100 was lower overnight as it consolidates some of last-Friday's rally. Overnight weaknesssets the stage for a lower opening when the day session begins trading.Stochastics and the RSI are overbought but remain neutral to bullish signaling that sideways to higher prices are possible near-term. If September extends the rally off June's low, the 50% retracement level of the 2021-2022 decline crossing at 13,812.10 is the next upside target. Closes below the 20-day moving average crossing at 12,915.62 would signal that a short-term top has been posted. First resistance is last-Friday's high crossing at 13,583.25. Second resistance is the 50% retracement level of the 2021-2022 decline crossing at 13,812.10. First support is the 20-day moving average crossing at 12,915.62. Second support is the 50-day moving average crossing at 12,290.58.
The September S&P 500 was slightly lower overnight as it consolidates some of the rally off June's low. Overnight trading sets the stage for a lower opening when the day session begins trading. Stochastics and the RSI are overbought but remain neutral to bullish signaling that sideways to higher prices are possible near-term. If September extends the rally off June's low, the 62% retracement level of the January-June decline crossing at 4352.80 is the next upside target. Closes below the 20-day crossing at 4094.28 would signal that a short-term top has been posted. First resistance is last-Friday's high crossing at 4282.75. Second resistance is the 62% retracement level of the January-June decline crossing at 4352.80. First support is the 20-day moving average crossing at 4094.28. Second support is the 50-day moving average crossing at 3956.53.
INTEREST RATES http://quotes.ino.com/ex changes/?c=interest"
INTEREST RATES: September T-bonds were steady to higher overnight. The high-range overnight trade sets the stage for a higher opening when the day session begins trading. Stochastics and the RSI are oversold but remains neutral to bearish signaling that sideways to lower prices are possible near-term. If September extends the decline off August's high, the 50-day moving average crossing at 138-28 is the next downside target. If September renews the rally off June's low, the 50% retracement level of the 2021-2022 decline crossing at 147-27 is the next upside target. First resistance is the 50% retracement level of the 2021-2022 decline crossing at 147-27. Second resistance is the 62% retracement level of the 2021-2022 decline crossing at 151-28. First support is the 50-day moving average crossing at 138-28. Second support is the July 11th low crossing at 136-24.
September T-notes was steady to slightly higher overnight and sets the stage for a higher opening when the day session begins trading. Stochastics and the RSI are oversold but remain neutral to bearish signaling that sideways to lower prices are possible near-term. If September extends the decline off last-Tuesday's high, the 50-day moving average crossing at 118.145 is the next downside target. If September renews the rally off June's low, the 50% retracement level of the 2021-2022 decline crossing at 122.204 is the next upside target. First resistance is the August 2nd high crossing at 122.020. Second resistance is the 50% retracement level of the 2021-2022 decline crossing at 122.204 is the next upside target. First support is the 50-day moving average crossing at 118.145. Second support is the July 21st low crossing at 117.145.
ENERGY MARKETS? http://quotes.ino.com/ex?changes/?c=energy ""
ENERGIES:September crude oil was lower overnight and sets the stage for a lower opening when the day session begins trading. Stochastics and the RSI are turning neutral to bearish signaling that sideways to lower prices are possible near-term. If September renews the decline off June's high, the 38% retracement level of the 2020-2022 rally crossing at $86.43 is the next downside target. Closes above the 20-day moving average crossing at $94.02 would temper the near-term bearish outlook. First resistance is the 20-day moving average crossing at $94.02. Second resistance is the 50-day moving average crossing at $100.89. First support is the August 5th low crossing at $87.01. Second support is the 38% retracement level of the 2020-2022 rally crossing at $86.43.
September heating oil was lower overnight as it consolidates some of the rally off last-Monday's low. Overnight trading sets the stage for a lower opening when the day session begins trading. Stochastics and the RSI are neutral to bullish signaling that sideways to higher prices are possible near-term. If September extends the rally off Monday's low, the 50-day moving average crossing at $3.7325 is the next upside target. If September resumes the decline off June's high, the April low crossing at $2.9426 is the next downside target. First resistance is last-Friday's high crossing at $3.5500. Second resistance is the 50-day moving average crossing at $3.7325. First support is last-Monday's low crossing at $3.1424. Second support is April's low crossing at $2.9426.
September unleaded gas was sharply lower overnight as it consolidates some of the rally off the August 4th low. Overnight trading sets the stage for a lower opening when the day session begins trading. Stochastics and the RSI are turning neutral to bearish signaling that sideways to lower prices are possible near-term. If September renews the decline off June's high, the March-2022 low crossing at $2.6308 is the next downside target. Closes above the August 3rd high crossing at $3.1427 would signal that a short-term low has been posted. First resistance is the July 29th high crossing at $3.2492. Second resistance is the 50-day moving average crossing at $3.3045. First support is the August 4th low crossing at $2.7575. Second support is the March-2022 low crossing at $2.6308.
September Henry natural gas was lower overnight as it consolidates some of the rally off last-Monday's low. Overnight weakness sets the stage for a lower opening when the day session begins trading. Stochastics and the RSI remain neutral to bullish signaling that sideways to higher prices are possible near-term. If September extends the rally off August's low, July's high crossing at 9.419 is the next upside target. Closes below the 50-day moving average crossing at 7.484 would signal that a short-term top has been posted. First resistance is July's high crossing at 9.419. Second resistance is June's high crossing at 9.598. First support is the 50-day moving average crossing at 7.484. Second support is the July 15th low crossing at 6.351.
CURRENCIEShttp://quotes.ino.com/ex changes/?c=currencies"
CURRENCIES:The September Dollar was higher overnight trading as it consolidated some of the decline off July's high. Overnight trading sets the stage for a higher opening when the day session begins trading. Stochastics and the RSI are turning neutral to bullish signaling that a sideways to higher prices are possible near-term. Closes above the July 27th high crossing at $107.300 are needed to confirm that a short-term low has been posted. If September renews the decline off July's high, the June 16th low crossing at $103.200 is the next downside target. First resistance is the July 27thhigh crossing at $107.300. Second resistance is the July 14th high crossing at $109.140. First support is the June 16th low crossing at $103.200. Second support is the May 30th low crossing at $101.075.
The September Euro was lower overnight as it consolidates some of the rally off July's low. The overnight trade sets the stage for a lower opening when the day session begins trading. Stochastics and the RSI are turning neutral to bearish signaling that sideways to lower prices are possible near-term. Closes below the 20-day moving average crossing at $1.02448 would signal that a short-term top has been posted. Closes above the 50-day moving average crossing at $1.03761 would open the door for additional gains near-term. First resistance is the 50-day moving average crossing at $1.03761. Second resistance is the June 27th high crossing at $1.06785. First support is the July 27th low crossing at $1.01345. Second support is the July 14th low crossing at $1.00000.
The September British Pound was lower overnight and sets the stage for a lower opening when the day session begins trading. Stochastics and the RSI are turning neutral to bearish signaling that sideways to lower prices are possible near-term. Closes below the 20-day moving average crossing at 1.2115 would signal that a short-term top has been posted. If September renews the rally off July's low, the 25% retracement level of the 2021-2022 decline crossing at 1.2385 is the next upside target. First resistance is the 25% retracement level of the 2021-2022 decline crossing at 1.2385. Second resistance is the 38% retracement level of the 2021-2022 decline crossing at 1.2710. First support is the 20-day moving average crossing at 1.2115. Second support is the July 14th low crossing at 1.1778.
The September Swiss Franc was steady to lower overnight as it extends the rally off June's low. The low-range overnight trade sets the stage for a steady to lower opening when the day session begins trading. Stochastics and the RSI are overbought, diverging and are turning neutral to bearish signaling that sideways to lower prices are possible near-term. Closes below the 20-day moving average crossing at 1.04907 would signal that a short-term top has been posted. If September extends the rally off the July 14th low, the 50% retracement level of the 2021-2022 decline crossing at 1.08120 is the next upside target. First resistance is last-Thursday's high crossing at 1.07010. Second resistance is the 50% retracement level of the 2021-2022 decline crossing at 1.08120. First support is the 20-day moving average crossing at 1.04907. Second support is the 50-day moving average crossing at 1.04003.
The September Canadian Dollar was sharply lower overnight as it consolidates some of the decline off July's low. The low-range overnight trade sets the stage for a sharply lower opening when the day session begins trading. Stochastics and the RSI are turning neutral to bearish signaling that sideways to lower prices are possible near-term. Closes below the August 5th low crossing at 76.99 would confirm that a short-term top has been posted. If September extends the rally off last-Friday's low, the 62% retracement level of the April-July decline crossing at 78.67 is the next upside target. First resistance is last-Thursday's high crossing at $78.55. Second resistance is the 62% retracement level of the April-July decline crossing at 78.67. First support is the August 5thlow crossing at $76.99. Second support is July's low crossing at $75.61.
The September Japanese Yen was steady to slightly higher overnight. Overnight strength sets the stage for a steady to higher opening when the day session begins trading. Stochastics and the RSI are neutral signaling that sideways trading is possible near-term. If September renews the rally off July's low, the 38% retracement level of this year's decline crossing at 0.078281 is the next upside target. Closes below the 50-day moving average crossing at 0.074329 would open the door for a larger-degree near-term. First resistance is the 25% retracement level of this year's decline crossing at 0.076118. Second resistance is the 38% retracement level of this year's decline crossing at 0.078281. First support is the 50-day moving average crossing at 0.074329. Second support is July's low crossing at 0.072085.
PRECIOUS METALS http://quotes.ino.com/ex changes/?c=metals"
PRECIOUS METALS: Decembergold was sharply lower overnight as it consolidates some of the rally off July's low. Overnight trading sets the stage for a lower opening when the day session begins trading. Stochastics and the RSI are overbought and are turning neutral to bearish signaling that sideways to lower prices are possible near-term. Closes below the 20-day moving average $1774.10 would signal that a short-term top has been posted. If December extends the rally off July's low, the 38% retracement level of the March-July decline crossing at $1848.00 is the next upside target. First resistance is last-Wednesday's high crossing at $1824.60. Second is the 38% retracement level of the March-July decline crossing at $1848.00. First support is he 20-day moving average $1774.10. Second support is July's low crossing at $1727.00.
September silver was lower overnight as it extends the trading range of the past four-days. The low-range trade sets the stage for a lower opening when the day session begins trading later this morning. Stochastics and the RSI are overbought but remain neutral to bullish signaling that sideways to higher prices are possible near-term. If September extends the rally off July's low, the 38% retracement level of the March-July decline crossing at 21.575 is the next upside target. Closes below the 20-day moving average crossing at 19.689 would signal that a short-term top has been posted. First resistance is the overnight high crossing at $20.870. Second resistance is the 38% retracement level of the March-July decline crossing at 21.575. First support is the 20-day moving average crossing at 19.689. Second support is the July 14th low crossing at $18.010.
September copper was sharply lower overnight as it consolidates some of the rally off July's low. Overnight trading sets the stage for a lower opening when the day session begins trading. Stochastics and the RSI are overbought and are turning neutral to bearish signaling that sideways to lower prices are possible near-term. Closes below the 20-day moving average crossing at 3.4897 would signal that a short-term top has been posted. If September extends the rally off July's low, the 38% retracement level of the March-July decline crossing at 3.8395 is the next upside target. First resistance is the 50-day moving average crossing at 3.6992. Second resistance is the 38% retracement level of the March-July decline crossing at 3.8395. First support is the 20-day moving average crossing at 3.4897. Second support is the July 15th low crossing at 3.1315.
GRAINS http://quotes.ino.com/ex changes/?c=grains
December corn was lower overnight as it consolidates some of the rally off July's low. Overnight trading sets the stage for a lower opening when the day sessions begins trading. Stochastics and the RSI are overbought but remain neutral to bullish signaling that sideways to higher prices are possible near-term. Multiple closes above the 50-day moving average crossing at $6.38 1/4 is the next upside target. Closes below the 20-day moving average crossing at $6.05 would temper the near-term friendly outlook. First resistance is the 50-day moving average crossing at $6.38 1/4. Second resistance is the 50% retracement level of the May-July decline crossing at $6.64. First support is the 20-day moving average crossing at $6.05. Second support is the August 3rd low crossing at $5.87 1/2.
September wheat was lower overnight as it extends the July-August trading range. Overnight trading sets the stage for a lower opening when the day session begins trading. Stochastics and the RSI are turning neutral to bearish signaling that sideways to lower prices are possible near-term. If September renews the decline off May's high, the 75% retracement level of the January-May high crossing at $7.23 is the next downside target. Closes above the July 20th high crossing at $8.43 1/2 would signal that a short-term low has been posted. First resistance is the July 20th high crossing at $8.43 1/2. Second resistance is the 50-day moving average crossing at $8.85 1/2. First support is the August 3rd low crossing at $7.52. Second support is the 75% retracement level of the January-May high crossing at $7.23.
September Kansas City wheat was lower overnight as it extends the July-August trading range. Overnight weakness sets the stage for a lower opening when the day session begins trading later this morning. Stochastics and the RSI are turning neutral to bearish signaling that sideways to lower prices are possible near-term. If September renews the decline off May's high, February's low crossing at $7.64 1/2 the next downside target. Closes above the July 29th high crossing at $9.15 1/4 would confirm that a short-term low has been posted. First resistance is the July 29th high crossing at $9.15 1/4. Second resistance is the 50-day moving average crossing at $9.51 3/4. First support is the 62% retracement level of the January-May rally crossing at $8.32 3/4. Second support is the February's low crossing at $7.64 1/2.
September Minneapolis wheat was lower overnight and sets the stage for a lower opening when the day session begins trading. Stochastics and the RSI are turning neutral to bearish signaling that sideways to lower prices are possible near-term. If September renews the decline of May's high, the 75% retracement level of the January-May rally crossing at $8.12 3/4 is the next downside target. Closes above the July 20th high crossing at $9.56 would signal that a short-term low has been posted while opening the door for additional gains near-term. First resistance is the July 20th high crossing at $9.56. Second resistance is the 50-day moving average crossing at $10.01. First support is the August 3rd low crossing at $8.64 3/4. Second support is the 75% retracement level of the January-May high crossing at $8.12 3/4.
SOYBEAN COMPLEX? http://quotes.ino.com/ex?changes/?c=grains "
November soybeans was sharply lower overnight as it consolidates some of the rally off the August 3rd low. Overnight trading sets the stage for a lower opening when the day session begins trading. Stochastics and the RSI are turning neutral to bearish signaling that sideways to lower prices are possible near-term. Closes below the 20-day moving average crossing at $13.95 3/4 would signal that a short-term top has been posted. If November extends the rally off the August 3rd low, the July 29th high crossing at $14.89 is the next upside target. First resistance is the July 29th high crossing at $14.89. Second resistance is the June 30th high crossing at $15.07 3/4. First support is the 20-day moving average crossing at $13.95 3/4. Second support is the August 3rd low crossing at $13.56.
December soybean meal was sharply lower overnight as it continues to extend a broad symmetrical triangle. The low-range trade overnight sets the stage for a steady to lower opening when the day session begins trading. Stochastics and the RSI are turning neutral to bearish signaling that sideways to lower prices are possible near-term. Closes below the August 3rd low crossing at $3.95 1/2 would renew the decline off July's high while opening the door for a test of the July 22nd low crossing at $380.80. If December renews the rally off the July 22nd low, March's high crossing at $436.80 is the next upside target. First resistance is July's high crossing at $431.70. Second resistance is March's high crossing at $436.80. First support is the August 3rd low crossing at $395.50. Second support is the July 22nd low crossing at $380.80.
December soybean oil was sharply lower overnight as it consolidates some of the rally off July's low. The low-range overnight trade sets the stage for a lower opening when the day session begins trading. Stochastics and the RSI are overbought but remain neutral to bullish signaling that sideways to higher prices are possible near-term. If December extends the aforementioned rally, the 62% retracement level of the June-July decline crossing at 69.82 is the next upside target. Closes below the 20-day moving average crossing at 62.10 would signal that a short-term top has been posted. First resistance is last-Friday's high crossing at 68.16. Second resistance is the 62% retracement level of the June-July decline crossing at 69.82. First support is the 10-day moving average crossing at 64.41. Second support is the 20-day moving average crossing at 62.10.
LIVESTOCKhttp://quotes.ino.com/exchanges/?c=livestock
October hogs closed down $1.08 at $100.00.
October hogs closed lower on Friday as it consolidates some of the rally off July's low. The low-range close sets the stage for a steady to lower opening when Monday's session begins trading. Stochastics and the RSI are overbought but remain neutral to bullish signaling that sideways to higher prices are possible near-term. If October extends the rally off July's low, weekly resistance crossing at $103.72 is the next upside target. Closes below the 20-day moving average crossing at $97.08 would signal that a short-term top has been posted. First resistance is Thursday's high crossing at $101.65. Second resistance is weekly resistance crossing at $103.72. First support is the 20-day moving average crossing at $97.08. Second support is the 50-day moving average crossing at $94.23.
October cattle closed down $0.48 at $144.63
October cattle closed lower on Friday as it consolidates some of the rally off May's low. The low-range close sets the stage for a steady to lower opening on Monday. Stochastics and the RSI are overbought but remain neutral to bullish signaling that sideways to higher prices are possible near-term. If October extends the rally off June's low, the April 25th gap crossing at $145.98 is the next upside target. Closes below the 20-day moving average crossing at $142.85 would confirm that a short-term top has been posted. First resistance is the April 25th gap crossing at $145.98. Second resistance is April's high crossing at $147.50. First support is the 20-day moving average crossing at $142.85. Second support is the 50-day moving average crossing at $141.39.
September Feeder cattle closed down $1.35 at $183.25.
September Feeder cattle closed lower on Friday. The low-range close sets the stage for a steady to lower opening when Monday's session begins trading. Stochastics and the RSI are neutral signaling that sideways to lower prices are possible near-term. Close below the July 29th low crossing at $178.28 would confirm that a short-term top has been posted while opening the door for additional weakness near-term. If September extends the rally off May's low, February's high crossing at $188.25 is the next upside target. First resistance is Monday's high crossing at $186.25. Second resistance is February's high crossing at $188.25. First support is the July 29th low crossing at $178.28. Second support is the July 11th low crossing at $173.15.
FOOD & FIBERhttp://quotes.ino.com/ex changes/?c=food
September coffee closed higher on Friday as it extends the rally off July's low. The high-range close sets the stage for a steady to higher opening on Monday. Stochastics and the RSI are overbought but remain neutral to bullish signaling that sideways to higher prices are possible near-term. If September extends the rally off July's low, July's high crossing at $23.61 is the next upside target. Closes below the reaction low crossing at $20.42 would signal that a short-term top has been posted. First resistance is today's high crossing at $22.77. Second resistance is July's high crossing at $23.61. First support is the reaction low crossing at $20.42. Second support is July's low crossing at $19.60.
September cocoa closed lower on Friday as it consolidates some of the rally off last-Thursday's low. The low-range close sets the stage for a steady to lower opening on Monday. Stochastics and the RSI are turning neutral to bearish signaling sideways to lower prices are possible near-term. Closes below the 20-day moving average crossing at 23.44 would signal that a short-term top has been posted. If September extends the rally off last Thursday's low, the June 21st high crossing at 24.76 is the next upside target.
October sugar closed higher on Friday and above the 50-day moving average crossing at 18.48 as it extends the rally off August's low. The high-range close sets the stage for a steady to higher opening on Monday. Stochastics and the RSI are overbought but remain neutral to bullish signaling that sideways to higher prices are possible near-term. If October extends the rally off August's low, July's high crossing at 19.69 is the next upside target. Closes below the 10-day moving average crossing at 17.99 would signal that a short-term top has been posted.
December cotton closed limit up on Friday as it extends the rally off July's low. The high-range close sets the stage for a steady to higher opening on Monday. Stochastics and the RSI are overbought but remain neutral to bullish signaling that sideways to higher prices are possible near-term. If December extends the rally off July's low, the 62% retracement level of the May-July decline crossing at 114.32 is the next upside target. Closes below the 20-day moving average crossing at 95.85 would signal that a short-term top has been posted.
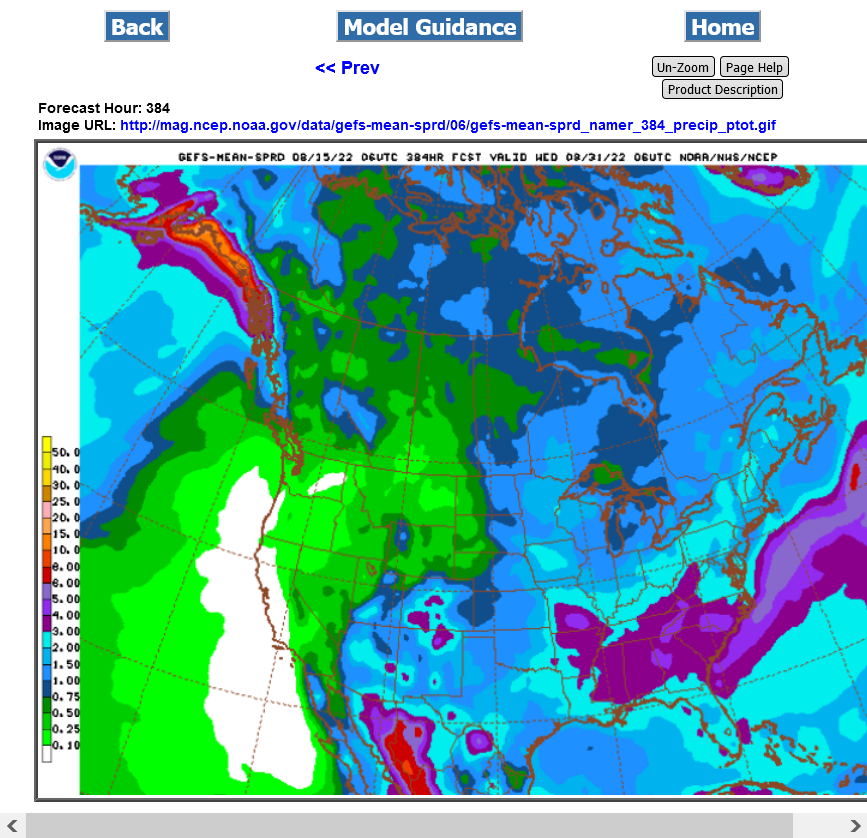
Rains have been increasing for the cornbelt, as mentioned Sunday evening.
2 inch bright blue now even over IA on the last 6z GFS ensemble 2 week rain map below!