KEY EVENTS TO WATCH FOR:
Thursday, August 18, 2022
8:30 AM ET. August Philadelphia Fed Business Outlook Survey
Business Activity (previous -12.3)
Prices Paid (previous 52.2)
Employment (previous 19.4)
New Orders (previous -24.8)
Prices Received (previous 30.3)
Delivery Times (previous -10.2)
Inventories (previous -9.3)
Shipments (previous 14.8)
8:30 AM ET. Unemployment Insurance Weekly Claims Report - Initial Claims
Jobless Claims (previous 262K)
Jobless Claims, Net Chg (previous +14K)
Continuing Claims (previous 1428000)
Continuing Claims, Net Chg (previous +8K)
8:30 AM ET. U.S. Weekly Export Sales
Corn (Metric Tons) (previous 383.1K)
Soybeans (Metric Tons) (previous 410.5K)
Wheat (Metric Tons) (previous 359.2K)
10:00 AM ET. July Existing Home Sales
Existing Sales (previous 5.12M)
Existing Sales, M/M% (previous -5.4%)
Unsold Homes Month's Supply (previous 3.0)
Median Price (USD) (previous 416000)
Median Home Price, Y/Y% (previous +13.4%)
10:00 AM ET. July Leading Indicators
Leading Index, M/M% (previous -0.8%)
Leading Index
Coincident Index, M/M% (previous +0.2%)
Lagging Index, M/M% (previous +0.8%)
10:30 AM ET. EIA Weekly Natural Gas Storage Report
Working Gas In Storage (Cbf) (previous 2501B)
Working Gas In Storage, Net Chg (Cbf) (previous +44B)
4:30 PM ET. Federal Discount Window Borrowings
4:30 PM ET. Foreign Central Bank Holdings
Friday, August 19, 2022
10:00 AM ET. 2nd Quarter Quarterly Retail E-Commerce Sales
10:00 AM ET. 2nd Quarter Advance Quarterly Services
10:00 AM ET. July State Employment and Unemployment
N/A U.S: Hawaii Statehood Day
The STOCK INDEXES? http://quotes.ino.com/ex?changes/?c=indexes
The STOCK INDEXES: The September NASDAQ 100 was steady to slightly higher overnight as it consolidates some of Wednesday's decline. Overnight tradingsets the stage for a steady to higher opening when the day session begins trading. Stochastics and the RSI are overbought and are turning neutral to bearish signaling that sideways to lower prices are possible near-term. Closes below the 20-day moving average crossing at 13,088.61 would signal that a short-term top has been posted. If September extends the rally off June's low, the 50% retracement level of the 2021-2022 decline crossing at 13,812.10 is the next upside target. First resistance is Tuesday's high crossing at 13,740.75. Second resistance is the 50% retracement level of the 2021-2022 decline crossing at 13,812.10. First support is the 20-day moving average crossing at 13,088.61. Second support is the 50-day moving average crossing at 12,348.24.
The September S&P 500 was steady to higher overnight as it consolidates some of Wednesday's decline. Overnight trading sets the stage for a steady to higher opening when the day session begins trading. Stochastics and the RSI are overbought but remain neutral to bullish signaling that sideways to higher prices are possible near-term. If September extends the rally off June's low, the 62% retracement level of the January-June decline crossing at 4352.80 is the next upside target. Closes below the 20-day crossing at 4144.60 would signal that a short-term top has been posted. First resistance is Tuesday's high crossing at 4327.50. Second resistance is the 62% retracement level of the January-June decline crossing at 4352.80. First support is the 20-day moving average crossing at 4144.60. Second support is the 50-day moving average crossing at 3966.84.
INTEREST RATES http://quotes.ino.com/ex changes/?c=interest"
INTEREST RATES: September T-bonds were steady to slightly higher overnight as it extends the trading range of the past five-days. The high-range overnight trade sets the stage for a steady to higher opening when the day session begins trading. Stochastics and the RSI are oversold but remain neutral to bearish signaling that sideways to lower prices are possible near-term. If September extends the decline off August's high, the 50-day moving average crossing at 139-01 is the next downside target. Closes above last-Wednesday's high crossing at 144-02 would confirm that a short-term low has been posted. First resistance is last-Wednesday's high crossing at 144-02. Second resistance is the August 2nd high crossing at 145-31. First support is the 50-day moving average crossing at 139-02. Second support is the July 11th low crossing at 136-24.
September T-notes was steady to slightly higher overnight and sets the stage for a higher opening when the day session begins trading. Stochastics and the RSI are oversold but remain neutral to bearish signaling that sideways to lower prices are possible near-term. If September extends the decline off last-Tuesday's high, the 50-day moving average crossing at 118.161 is the next downside target. Closes above the August 10th high crossing at 120.220 would signal that a short-term low has been posted. First resistance is the August 10nd high crossing at 120.220. Second resistance is August's high crossing at 122.020 is the next upside target. First support is the 50-day moving average crossing at 118.161. Second support is the July 21st low crossing at 117.145.
ENERGY MARKETS? http://quotes.ino.com/ex?changes/?c=energy ""
ENERGIES:September crude oil was higher overnight and sets the stage for a higher opening when the day session begins trading. Stochastics and the RSI are oversold but remain neutral to bearish signaling that sideways to lower prices are possible near-term. If September extends the decline off June's high, the February 18th low crossing at $80.66 is the next downside target. Closes above last-Thursday's high crossing at $95.05 would temper the near-term bearish outlook. First resistance is last-Thursday's high crossing at $95.05. Second resistance is the 50-day moving average crossing at $99.35. First support is the 38% retracement level of the 2020-2022 rally crossing at $86.43. Second support is the February 18th low crossing at $80.66.
September heating oil was steady to higher overnight as it extends the rally off August's low. Overnight trading sets the stage for a steady to higher opening when the day session begins trading. Stochastics and the RSI are neutral to bullish signaling that sideways to higher prices are possible near-term. If September extends the rally off Monday's low, the 50-day moving average crossing at $3.7013 is the next upside target. If September resumes the decline off June's high, the April low crossing at $2.9426 is the next downside target. First resistance is the 50-day moving average crossing at $3.7013. Second resistance is July's high crossing at $3.9461. First support is the August 8th low crossing at $3.1424. Second support is April's low crossing at $2.9426.
September unleaded gas was slightly higher overnight and sets the stage for a steady to higher opening when the day session begins trading. Stochastics and the RSI are turning neutral to bullish signaling that sideways to higher prices are possible near-term. Closes above the August 11th high crossing at $3.1199 would signal that a short-term low has been posted. If September renews the decline off June's high, the March-2022 low crossing at $2.6308 is the next downside target. First resistance is the August 11th high crossing at $3.1199. Second resistance is the July 29th high crossing at $3.2492. Third resistance is the 50-day moving average crossing at $3.2526. First support is the August 4th low crossing at $2.7575. Second support is the March-2022 low crossing at $2.6308.
September Henry natural gas was steady to slightly higher overnight. Overnight strength sets the stage for a higher opening when the day session begins trading. Stochastics and the RSI are overbought but remain neutral to bullish signaling that sideways to higher prices are possible near-term. If September extends the rally off August's low, weekly resistance crossing at 9.752 is the next upside target. Closes below the 20-day moving average crossing at 8.444 would signal that a short-term top has been posted. First resistance is June's high crossing at 9.598. Second resistance is weekly resistance crossing at 9.752. First support is the 20-day moving average crossing at 8.444. Second support is August's low crossing at 7.532.
CURRENCIEShttp://quotes.ino.com/ex changes/?c=currencies"
CURRENCIES:The September Dollar was higher overnight trading as it extends the rally off last-Wednesday's low and sets the stage for a higher opening when the day session begins trading. Stochastics and the RSI are neutral to bullish signaling that a sideways to higher prices are possible near-term. Closes above the July 27th high crossing at $107.300 are needed to confirm that a short-term low has been posted. If September renews the decline off July's high, the June 16th low crossing at $103.200 is the next downside target. First resistance is the July 27thhigh crossing at $107.300. Second resistance is the July 14th high crossing at $109.140. First support is the June 16th low crossing at $103.200. Second support is the May 30th low crossing at $101.075.
The September Euro was lower overnight. The overnight trade sets the stage for a lower opening when the day session begins trading. Stochastics and the RSI remain neutral to bearish signaling that sideways to lower prices are possible near-term. Closes below the July 27th low crossing at $1.01345 would mark a downside breakout of the July-August trading range. Closes above last-Thursday's high crossing at $1.03965 would open the door for additional gains near-term. First resistance is last-Thursday's high crossing at $1.03965. Second resistance is the June 27th high crossing at $1.06785. First support is the July 27th low crossing at $1.01345. Second support is the July 14th low crossing at $1.00000.
The September British Pound was steady to slightly lower overnight and sets the stage for a slightly lower opening when the day session begins trading. Stochastics and the RSI are neutral to bearish signaling that sideways to lower prices are possible near-term. Closes below the August 5th low crossing at 1.2012 would open the door for additional weakness and a possible test of July's low crossing at 1.1778. If September renews the rally off July's low, the 25% retracement level of the 2021-2022 decline crossing at 1.2385 is the next upside target. First resistance is the 25% retracement level of the 2021-2022 decline crossing at 1.2385. Second resistance is the 38% retracement level of the 2021-2022 decline crossing at 1.2710. First support is the August 5th low crossing at 1.2012. Second support is the July 14th low crossing at 1.1778.
The September Swiss Franc was lower overnight as it consolidates some of the rally off June's low. The low-range overnight trade sets the stage for a lower opening when the day session begins trading. Stochastics and the RSI have turned bearish signaling that sideways to lower prices are possible near-term. Closes below the 20-day moving average crossing at 1.05162 would signal that a short-term top has been posted. If September renews the rally off the July 14th low, the 50% retracement level of the 2021-2022 decline crossing at 1.08120 is the next upside target. First resistance is last-Thursday's high crossing at 1.07010. Second resistance is the 50% retracement level of the 2021-2022 decline crossing at 1.08120. First support is the 20-day moving average crossing at 1.05162. Second support is the 50-day moving average crossing at 1.04085.
The September Canadian Dollar was slightly higher overnight. The high-range overnight trade sets the stage for a steady to higher opening when the day session begins trading. Stochastics and the RSI have turned neutral to bearish signaling that sideways to lower prices are possible near-term. Closes below the August 5th low crossing at 76.99 would confirm that a short-term top has been posted. If September renews the rally off the August 5th low, the 62% retracement level of the April-July decline crossing at 78.67 is the next upside target. First resistance is last-Thursday's high crossing at $78.55. Second resistance is the 62% retracement level of the April-July decline crossing at 78.67. First support is the August 5thlow crossing at $76.99. Second support is July's low crossing at $75.61.
The September Japanese Yen was steady to slightly lower overnight as it extends this month's trading range. Overnight weakness sets the stage for a lower opening when the day session begins trading. Stochastics and the RSI are oversold but remain neutral to bearish signaling that sideways to lower prices are possible near-term. Closes below the August 8th low crossing at 0.073975 would mark a downside breakout of this month's trading range while opening the door for a larger-degree decline. If September renews the rally off July's low, the 38% retracement level of this year's decline crossing at 0.078281 is the next upside target. First resistance is the 25% retracement level of this year's decline crossing at 0.076118. Second resistance is the 38% retracement level of this year's decline crossing at 0.078281. First support is the August 8th low crossing at 0.073975. Second support is July's low crossing at 0.072085.
PRECIOUS METALS http://quotes.ino.com/ex changes/?c=metals"
PRECIOUS METALS: Decembergold was steady to higher overnight as it consolidates some of the decline off the August 10th high crossing at 1824.60. Overnight trading sets the stage for a steady to higher opening when the day session begins trading. Stochastics and the RSI are neutral to bearish signaling that sideways to lower prices are possible near-term. Closes below the August 3rd low crossing at $1770.00 would signal that a short-term top has been posted. If December renews the rally off July's low, the 38% retracement level of the March-July decline crossing at $1848.00 is the next upside target. First resistance is last-Wednesday's high crossing at $1824.60. Second is the 38% retracement level of the March-July decline crossing at $1848.00. First support is the August 3rd low crossing at $1770.00. Second support is July's low crossing at $1727.00.
September silver was steady to slightly higher overnight while extending this month's trading range. The high-range overnight trade sets the stage for a steady to higher opening when the day session begins trading later this morning. Stochastics and the RSI are neutral to bearish signaling that sideways to lower prices are possible near-term. Closes below the August 5th low crossing at 19.470 would signal that a short-term top has been posted. If September renews the rally off July's low, the 38% retracement level of the March-July decline crossing at 21.575 is the next upside target. First resistance is Monday's high crossing at $20.870. Second resistance is the 38% retracement level of the March-July decline crossing at 21.575. First support is the August 5th low crossing at 19.470. Second support is the July 14th low crossing at $18.010.
September copper was steady to higher overnight. Overnight trading sets the stage for a steady to higher opening when the day session begins trading. Stochastics and the RSI are neutral to bearish signaling that sideways to lower prices are possible near-term. Closes below the 20-day moving average crossing at 3.5388 would signal that a short-term top has been posted. If September renews the rally off July's low, the 38% retracement level of the March-July decline crossing at 3.8395 is the next upside target. First resistance is the 50-day moving average crossing at 3.6495. Second resistance is the 38% retracement level of the March-July decline crossing at 3.8395. First support is the 20-day moving average crossing at 3.5388. Second support is the July 15th low crossing at 3.1315.
GRAINS http://quotes.ino.com/ex changes/?c=grains
December corn was lower overnight as it extends the decline off last-Friday's high. Overnight trading sets the stage for a lower opening when the day sessions begins trading. Stochastics and the RSI are neutral to bearish signaling that sideways to lower prices are possible near-term. Closes below the 20-day moving average crossing at $6.07 1/2 would signal that a short-term top has been posted. Closes above last-Friday's high crossing at $6.42 3/4 would extend the rally off July's low. First resistance is Monday's high crossing at $6.42 3/4. Second resistance is the 50% retracement level of the May-July decline crossing at $6.64. First support is the 20-day moving average crossing at $6.07 1/2. Second support is the August 3rd low crossing at $5.87 1/2.
September wheat was lower overnight and is breaking out to the downside of the July-August trading range. Overnight trading sets the stage for a lower opening when the day session begins trading. Stochastics and the RSI are bearish signaling that sideways to lower prices are possible near-term. If September renews the decline off May's high, the 75% retracement level of the January-May high crossing at $7.23 is the next downside target. Closes above the August 11th high crossing at $8.20 3/4 would signal that a short-term low has been posted. First resistance is the July 20th high crossing at $8.43 1/2. Second resistance is the 50-day moving average crossing at $8.66 3/4. First support is the August 3rd low crossing at $7.52. Second support is the 75% retracement level of the January-May high crossing at $7.23.
September Kansas City wheat was lower overnight as it extends the July-August trading range. Overnight strength sets the stage for a lower opening when the day session begins trading later this morning. Stochastics and the RSI have turned neutral to bearish signaling that sideways to lower prices are possible near-term. If September renews the decline off May's high, February's low crossing at $7.64 1/2 the next downside target. Closes above the July 29th high crossing at $9.15 1/4 would confirm that a short-term low has been posted. First resistance is the July 29th high crossing at $9.15 1/4. Second resistance is the 50-day moving average crossing at $9.34. First support is the 62% retracement level of the January-May rally crossing at $8.32 3/4. Second support is the February's low crossing at $7.64 1/2.
September Minneapolis wheat was lower overnight as it extends the July-August trading range. Overnight weakness sets the stage for a lower opening when the day session begins trading. Stochastics and the RSI have turned neutral to bearish signaling that sideways to lower prices are possible near-term. If September renews the decline of May's high, the 75% retracement level of the January-May rally crossing at $8.12 3/4 is the next downside target. Closes above the July 20th high crossing at $9.56 would signal that a short-term low has been posted while opening the door for additional gains near-term. First resistance is the July 20th high crossing at $9.56. Second resistance is the 50-day moving average crossing at $9.81 1/2. First support is the August 3rd low crossing at $8.64 3/4. Second support is the 75% retracement level of the January-May high crossing at $8.12 3/4.
SOYBEAN COMPLEX? http://quotes.ino.com/ex?changes/?c=grains "
November soybeans was lower overnight and poised to extend the decline off last-Friday's high. Overnight trading sets the stage for a lower opening when the day session begins trading. Stochastics and the RSI are neutral to bearish signaling that sideways to lower prices are possible near-term. If November extends this week's decline, the August 3rd low crossing at $13.56 is the next downside target. If November renews the rally off the August 3rd low, the July 29th high crossing at $14.89 is the next upside target. First resistance is last-Friday's high crossing at $14.64 3/4. Second resistance is the July 29th high crossing at $14.89. Third resistance is the June 30th high crossing at $15.07 3/4. First support is the August 3rd low crossing at $13.56. Second support is July's low crossing at $12.88 1/2.
December soybean meal was higher overnight as it consolidates some of this week's decline. The high-range overnight trade sets the stage for a higher opening when the day session begins trading. Stochastics and the RSI are oversold but remain neutral to bearish signaling that sideways to lower prices are possible near-term. Closes below the August 3rd low crossing at $3.95 1/2 would renew the decline off July's high while opening the door for a test of the July 22nd low crossing at $380.80. Closes above the 20-day moving average crossing at $407.00 would temper the near-term bearish outlook. First resistance is the August 10th high crossing at $4.24. Second resistance is July's high crossing at $431.70. First support is the August 3rd low crossing at $395.50. Second support is the July 22nd low crossing at $380.80.
December soybean oil was lower overnight. The low-range overnight trade sets the stage for a steady to lower opening when the day session begins trading. Stochastics and the RSI have turned neutral to bearish signaling that sideways to lower prices are possible near-term. Closes below the 20-day moving average crossing at 63.33 would signal that a short-term top has been posted. If December renews the rally off July's low, the 62% retracement level of the June-July decline crossing at 69.82 is the next upside target. First resistance is last-Friday's high crossing at 68.16. Second resistance is the 62% retracement level of the June-July decline crossing at 69.82. First support is the 50-day moving average crossing at 64.38. Second support is the 20-day moving average crossing at 63.33.
Thanks much tallpine!
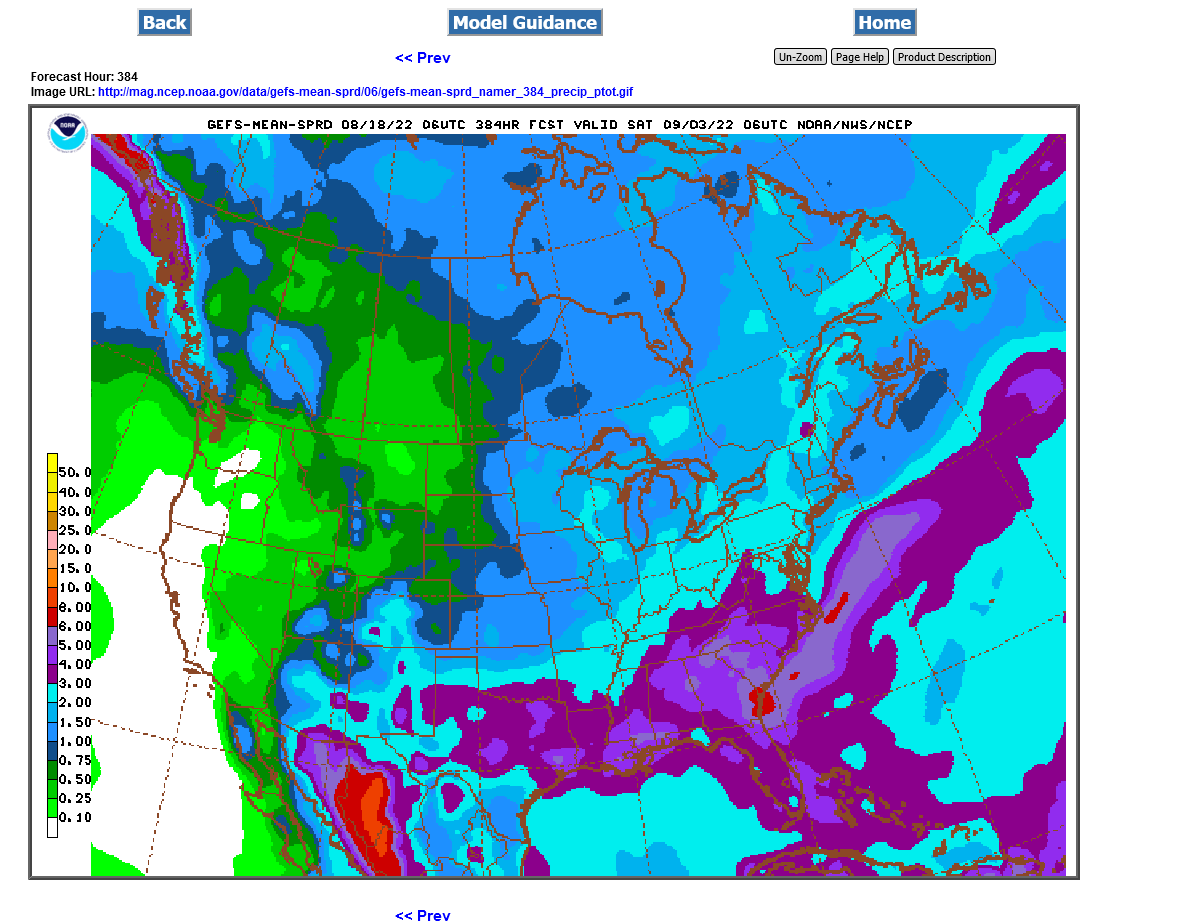
Last 6z GFS total rains for 2 weeks. It's late in the growing season for weather: