The Version 6.0 global average lower tropospheric temperature (LT) anomaly for September, 2022 was +0.24 deg. C, down slightly from the August, 2022 value of +0.28 deg. C.
https://www.drroyspencer.com/uah-global-temperature-update-for-september-2022-0-24-deg-c/
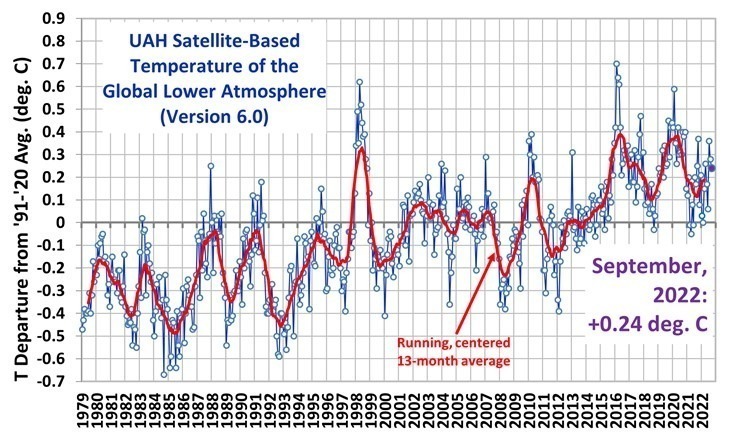
The linear warming trend since January, 1979 still stands at +0.13 C/decade (+0.11 C/decade over the global-averaged oceans, and +0.18 C/decade over global-averaged land).
The biggest reason for there to be no global warming(pause) the last 6 years is the La Nina....cool water anomalies in the E/C Pacific.
This has also caused the drought in the US the past 3 years.
Over the past 1,000 years, the North American Southwest has endured nine megadroughts averaging nearly 32 years in length, while the South American Southwest saw 12 megadroughts lasting an average of 21 years.
Jon Parton / August 30, 2021
(CN) — La Niña, the climate event that causes water to be colder than normal in the eastern Pacific, has now been shown by new research released Monday to be responsible for simultaneous megadroughts in the North and South American Southwest over the past 1,000 years.
Megadroughts are extended periods of drought that last at least 20 years. In a study published in the journal Nature, researchers found that these megadroughts occurred simultaneously in the North American and South American Southwest “regularly” and often during a La Niña event.
The researchers used paleoclimate proxies, archival data about rainfall temperature in the ancient past, and created a climate model that compared the data to past megadrought events.
They discovered over the past millennium that 9 megadroughts occurred in the North American Southwest, with 12 occurring in the South American Southwest. On average, the North American megadroughts lasted for 31.8 years while the South American megadroughts lasted for 21.2 years.
The researchers found that seven of the megadroughts happened simultaneously in both North America and South America due to the colder eastern Pacific surface water temperatures brought about by La Niña.
“The co-occurrence of these events cannot be explained by chance,” the researchers stated in the study.
La Niña events occur when trade winds push warm water in the Pacific Ocean toward Asia. As a result, colder waters off the coast of the Americas rise to the surface, push the jet stream northward and create drier conditions for the Southwest regions. They occur regularly and last at least five months.
The American Southwest is currently undergoing drought conditions, causing water shortages in the Colorado River and contributing to the several forest fires burning across the American West.
ENSO: Recent Evolution,
Current Status and Predictions
Summary
La Niña is present.*
Equatorial sea surface temperatures (SSTs) are below average across most of
the Pacific Ocean.
The tropical Pacific atmosphere is consistent with La Niña.
La Niña is favored to continue through Northern Hemisphere winter 2022-23,
with a 91% chance in September-November, decreasing to a 54% chance in
January-March 2023
More on La Nina in a different thread later this week.
https://www.marketforum.com/forum/topic/83844/#83853
Soilmoisture anomaly:
These maps sometimes take a day to catch up to incorporate the latest data(the bottom map is only updated once a week).
https://www.cpc.ncep.noaa.gov/products/Soilmst_Monitoring/US/Soilmst/Soilmst.shtml#
![]()


++++++++++++++++++++++++++++
https://mrcc.purdue.edu/cliwatch/watch.htm#curMonths
September 27, 2022 Below
Drought worsening!!
https://droughtmonitor.unl.edu/Maps/CompareTwoWeeks.aspx

https://wattsupwiththat.com/2022/10/05/the-new-pause-lengthens-to-8-years/

The New Pause, having paused a month ago, has now lengthened again: this time to exactly eight years. As always, the Pause is calculated as the longest period for which the least-squares linear-regression trend up to the most recent month for which the UAH global mean surface temperature anomaly is available is zero.
 The New Pause has grown to fully eight years in length at a most embarrassing point for true-believers: for the cost to the West of the economically suicidal policies that they have long advocated is now becoming all too painfully apparent, just as it is also ever more evident that the warming since 1990 is well below half the midrange prediction made by IPCC that year.