Thanks bear,
this is a huge deal!
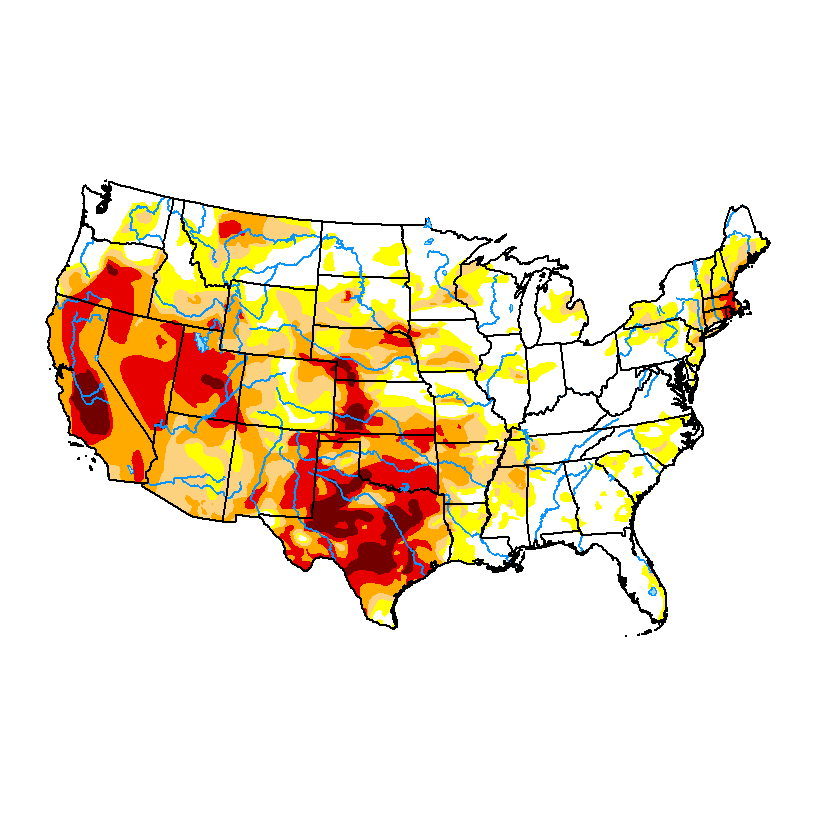
Soilmoisture anomaly:
These maps sometimes take a day to catch up to incorporate the latest data(the bottom map is only updated once a week).
https://www.cpc.ncep.noaa.gov/products/Soilmst_Monitoring/US/Soilmst/Soilmst.shtml#
![]()


++++++++++++++++++++++++++++
https://mrcc.purdue.edu/cliwatch/watch.htm#curMonths

October 11, 2022 Below
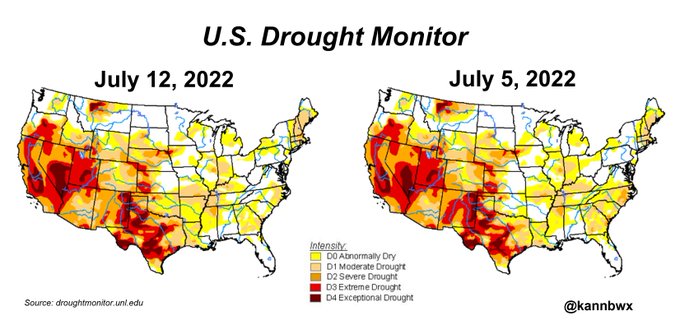
Drought worsening!!
https://droughtmonitor.unl.edu/Maps/CompareTwoWeeks.aspx

AUGUST 16, 2022 BELOW
Drought is worse in the WCB compared to 3 weeks earlier
July 26, 2022-update
U.S. Drought Monitor
https://droughtmonitor.unl.edu/Maps/CompareTwoWeeks.aspx

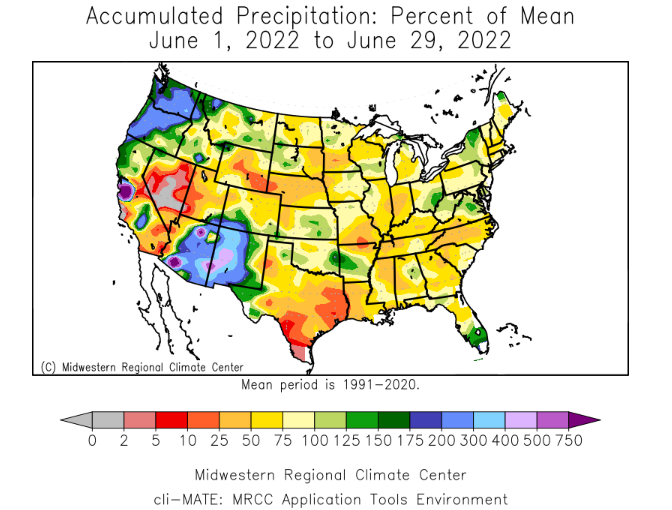
The drought monitor can sometimes be a lagging indicator, but the trend is backed up here by the monthly precip anomalies. That same problem area mentioned above has gotten well below normal rainfall this month. In fact, almost none of the Corn Belt has been distinctly wet.
Drought monitor previous years:
7 Day Total precipitation below:
http://www.wpc.ncep.noaa.govcdx /qpf/p168i.gif?1530796126

Extended weather.
https://www.cpc.ncep.noaa.gov/products/predictions/610day/ | |||||||||
| 6 to 10 day outlooks | |||||||||
| Click below for information about how to read 6-10 day outlook maps Temperature Precipitation | |||||||||
| Click below for archives of past outlooks (data & graphics), historical analogs to todays forecast, and other formats of the 6-10 day outlooks ArchivesAnalogsLines-Only FormatGIS Data | |||||||||
Temperature Probability | |||||||||
Precipitation Probability | |||||||||
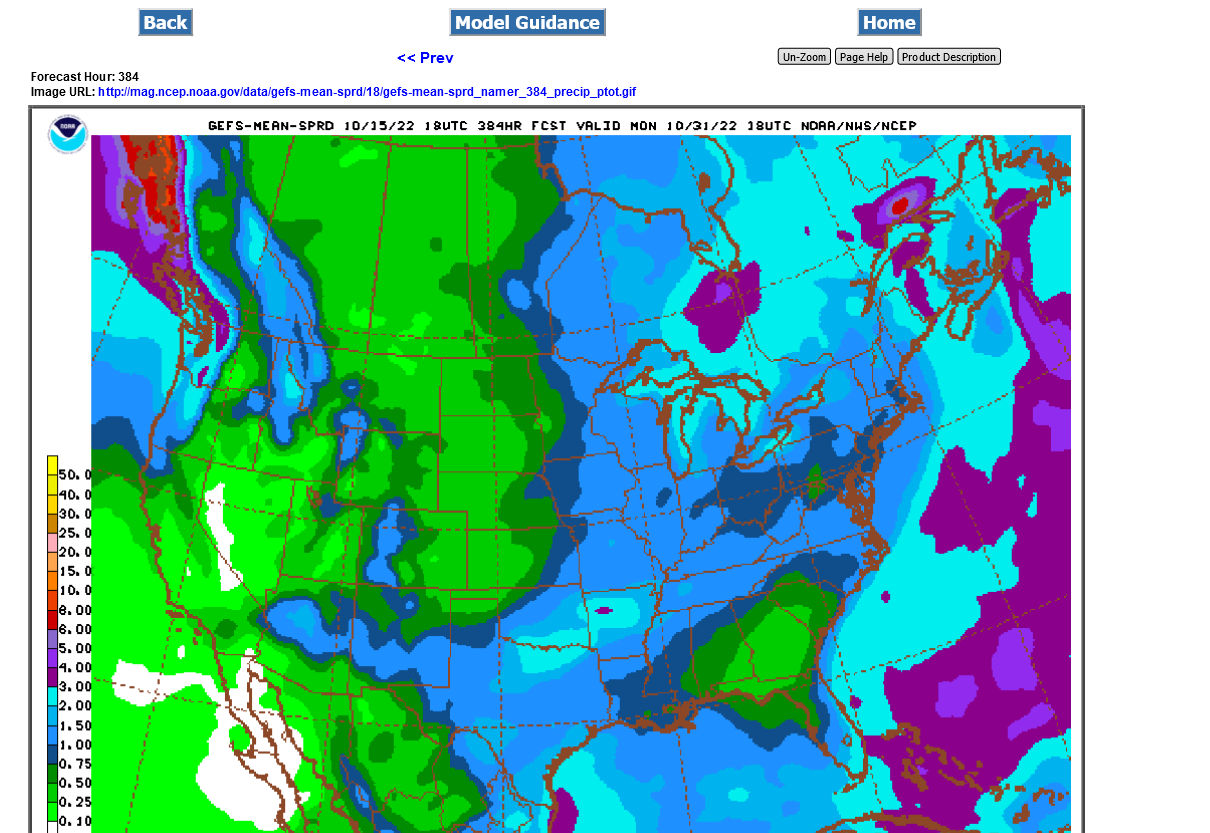
GFS ensemble precip for the next 15 days:
https://mag.ncep.noaa.gov/Image.php
The drought was not caused by climate change/global warming…..just the opposite.
its the result of the current, extremely long lived La Niña which is cold water anomalies in the tropical pacific. The opposite of a global warming pattern.
this is part of why global warming has paused the past 6 years
the best opportunity to end the drought will come from the slight, mostly beneficial warming resuming which caused the previous 3 decades of growing weather to be the best in the last 1,000 years.
add the beneficial CO2 during that time and growing conditions on the planet were the best since well before humans existed.
that’s why we’ve had massive global greening!
https://www.marketforum.com/forum/topic/69258/
La Nina conditions:

https://www.ospo.noaa.gov/Products/ocean/sst/anomaly/index.html