Thanks Jean!
https://www.marketforum.com/forum/topic/88903/
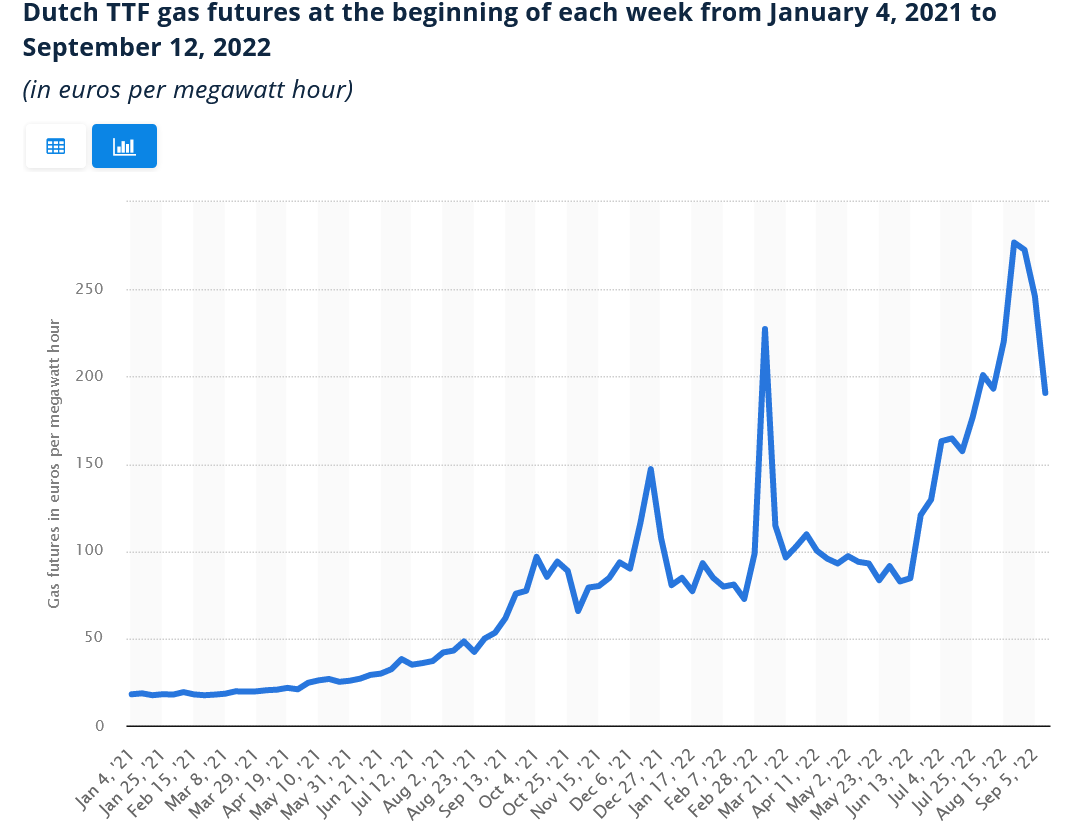
Europe's energy crisis solution
Started by metmike - Sept. 17, 2022, 6:44 p.m.
By now, everybody knows that natural gas and electricity market prices are up 10-fold in the last year in Europe.
https://www.statista.com/statistics/1267202/weekly-dutch-ttf-gas-futures/
Most explanations for who/what is to blame are extremely misleading to complete lies. For instance:
1. It's evil Putin's fault.
2. It's the reliance on dirty, planet killing fossil fuels fault.
3. It's because they didn't switch completely to the panacea green energy that creates a utopian world of unlimited jobs and cheap energy, while cleaning up the environment and saving the planet.
That's all really wrong.
Previous discussion(on Europe):
https://www.marketforum.com/forum/topic/88331/
The picture/graph in this post is worth a thousand words but please do read the explanation:
https://www.marketforum.com/forum/topic/88331/#88344

VERY IMPORTANT NOTE:
The United States is now gushing out natural gas production/supply at record levels, with the industry responding recently to very low supplies/storage. The number of 100+ BCF injections was mind boggling. Note the last paragraph at the bottom and the graph below.
We are in good shape here.........for now.
https://www.marketforum.com/forum/topic/89973/
Another HUGE injection compared to expectations!
https://www.investing.com/economic-calendar/natural-gas-storage-386
Latest Release Nov 03, 2022 Actual107B Forecast97B Previous52B
| Release Date | Time | Actual | Forecast | Previous | ||
|---|---|---|---|---|---|---|
| Nov 10, 2022 | 11:30 | 52B | ||||
| Nov 03, 2022 | 10:30 | 107B | 97B | 52B | ||
| Oct 27, 2022 | 10:30 | 52B | 59B | 111B | ||
| Oct 20, 2022 | 10:30 | 111B | 105B | 125B | ||
| Oct 13, 2022 | 10:30 | 125B | 123B | 129B | ||
| Oct 06, 2022 | 10:30 | 129B | 113B | 103B | ||
| Sep 29, 2022 | 10:30 | 103B | 94B | 103B | ||
| Sep 22, 2022 | 10:30 | 103B | 93B | 77B | ||
| Sep 15, 2022 | 10:30 | 77B | 73B | 54B | ||
| Sep 08, 2022 | 10:30 | 54B | 54B | 61B | ||
| Sep 01, 2022 | 10:30 | 61B | 58B | 60B | ||
| Aug 25, 2022 | 10:30 |
+++++++++++++++++++++++++
https://ir.eia.gov/ngs/ngs.html
for week ending October 28, 2022 | Released: November 3, 2022 at 10:30 a.m. | Next Release: November 10, 2022
| Working gas in underground storage, Lower 48 states Summary textCSVJSN | |||||||||||||||||||||||||
|---|---|---|---|---|---|---|---|---|---|---|---|---|---|---|---|---|---|---|---|---|---|---|---|---|---|
| Historical Comparisons | |||||||||||||||||||||||||
| Stocks billion cubic feet (Bcf) | Year ago (10/28/21) | 5-year average (2017-21) | |||||||||||||||||||||||
| Region | 10/28/22 | 10/21/22 | net change | implied flow | Bcf | % change | Bcf | % change | |||||||||||||||||
| East | 848 | 825 | 23 | 23 | 897 | -5.5 | 903 | -6.1 | |||||||||||||||||
| Midwest | 1,042 | 1,007 | 35 | 35 | 1,068 | -2.4 | 1,072 | -2.8 | |||||||||||||||||
| Mountain | 204 | 199 | 5 | 5 | 213 | -4.2 | 214 | -4.7 | |||||||||||||||||
| Pacific | 247 | 248 | -1 | -1 | 256 | -3.5 | 290 | -14.8 | |||||||||||||||||
| South Central | 1,160 | 1,116 | 44 | 44 | 1,168 | -0.7 | 1,156 | 0.3 | |||||||||||||||||
| Salt | 299 | 277 | 22 | 22 | 318 | -6.0 | 306 | -2.3 | |||||||||||||||||
| Nonsalt | 861 | 839 | 22 | 22 | 850 | 1.3 | 850 | 1.3 | |||||||||||||||||
| Total | 3,501 | 3,394 | 107 | 107 | 3,602 | -2.8 | 3,636 | -3.7 | |||||||||||||||||
Totals may not equal sum of components because of independent rounding. | |||||||||||||||||||||||||
Working gas in storage was 3,501 Bcf as of Friday, October 28, 2022, according to EIA estimates. This represents a net increase of 107 Bcf from the previous week. Stocks were 101 Bcf less than last year at this time and 135 Bcf below the five-year average of 3,636 Bcf. At 3,501 Bcf, total working gas is within the five-year historical range.
For information on sampling error in this report, see Estimated Measures of Sampling Variability table below.

metmike: Look at the blue line above rapidly gaining on the 5 year average. The angle of the upsloping blue line is MUCH steeper than any other year with us now having 6 of the last 7 reports featuring 100+ BCF injections. I don't need to check the records(Larry can) to know that has NEVER happened before.