
Mike was asking about this and assumed correctly that no season on record before 2022 had had nearly the number of autumn NG 100+ injections that 2022 has had, which is six:
- 2019, 2011, and 2003 each had three
- 2015 and 2014 had two
- 2021, 2013, 2010, and 2006 each had one
- Nineteen other years since 1994 had none, including 1994-2002
- 2003-2021 averaged only one
- Lowest autumn injection high was a mere 69 (in 2009)
- Average autumn injection high for 2003-2021: 97
- Highest autumn injection high for 2003-2021: 118 (in 2021)
- 2022 has the two highest autumn injections on record: 129 and 125
Great job Larry!
Natural gas is gushing in right now and filling up storage at a record pace. I'd predicted that we would pass up the 5 year average before the end of the year. If not for this major cold wave, we would do it easily in November.
Previous post: Look at the blue line below rapidly gaining on the 5 year average. The angle of the upsloping blue line is MUCH steeper than any other year with us now having 6 of the last 8 reports featuring 100+ BCF injections. I don't need to check the records(Larry can) to know that has NEVER happened before.
Also: I've copied the weekly data going back well into 2021 below. Note the huge drawdowns during the first several months of this year, 2022. Also a drawdown in April. That was the period that caused the blue line below to spike down and part ways with the 5 year average. We maintained that supply gap/deficit of several hundred BCF, thru the Spring and Summer. In early September it was still -349 BCF.
2 months later and it's only -76 BCF, gaining a whopping +273 BCF in that short period!
Autumn 2021 featured on 1 injection of 100+ BCF.
https://ir.eia.gov/ngs/ngs.html
for week ending November 4, 2022 | Released: November 10, 2022 at 10:30 a.m. | Next Release: November 17, 2022
+ 79 BCF initial bullish price reaction
| Working gas in underground storage, Lower 48 states Summary textCSVJSN | |||||||||||||||||||||||||
|---|---|---|---|---|---|---|---|---|---|---|---|---|---|---|---|---|---|---|---|---|---|---|---|---|---|
| Historical Comparisons | |||||||||||||||||||||||||
| Stocks billion cubic feet (Bcf) | Year ago (11/04/21) | 5-year average (2017-21) | |||||||||||||||||||||||
| Region | 11/04/22 | 10/28/22 | net change | implied flow | Bcf | % change | Bcf | % change | |||||||||||||||||
| East | 865 | 848 | 17 | 17 | 897 | -3.6 | 906 | -4.5 | |||||||||||||||||
| Midwest | 1,068 | 1,042 | 26 | 26 | 1,074 | -0.6 | 1,080 | -1.1 | |||||||||||||||||
| Mountain | 208 | 204 | 4 | 4 | 213 | -2.3 | 213 | -2.3 | |||||||||||||||||
| Pacific | 247 | 247 | 0 | 0 | 258 | -4.3 | 290 | -14.8 | |||||||||||||||||
| South Central | 1,193 | 1,160 | 33 | 33 | 1,175 | 1.5 | 1,166 | 2.3 | |||||||||||||||||
| Salt | 311 | 299 | 12 | 12 | 323 | -3.7 | 314 | -1.0 | |||||||||||||||||
| Nonsalt | 882 | 861 | 21 | 21 | 850 | 3.8 | 851 | 3.6 | |||||||||||||||||
| Total | 3,580 | 3,501 | 79 | 79 | 3,617 | -1.0 | 3,656 | -2.1 | |||||||||||||||||
Totals may not equal sum of components because of independent rounding. | |||||||||||||||||||||||||
Working gas in storage was 3,580 Bcf as of Friday, November 4, 2022, according to EIA estimates. This represents a net increase of 79 Bcf from the previous week. Stocks were 37 Bcf less than last year at this time and 76 Bcf below the five-year average of 3,656 Bcf. At 3,580 Bcf, total working gas is within the five-year historical range.
For information on sampling error in this report, see Estimated Measures of Sampling Variability table below.
 ++++++++++++++++++++++++++++++++
https://www.investing.com/economic-calendar/natural-gas-storage-386
Latest Release Nov 10, 2022 Actual79B Forecast84B Previous 107B
| Release Date | Time | Actual | Forecast | Previous | |
|---|---|---|---|---|---|
| Nov 17, 2022 | 10:30 | 84B | 79B | ||
| Nov 10, 2022 | 10:30 | 79B | 84B | 107B | |
| Nov 03, 2022 | 09:30 | 107B | 97B | 52B | |
| Oct 27, 2022 | 09:30 | 52B | 59B | 111B | |
| Oct 20, 2022 | 09:30 | 111B | 105B | 125B | |
| Oct 13, 2022 | 09:30 | 125B | 123B | 129B | |
| Oct 06, 2022 | 09:30 | 129B | 113B | 103B | |
| Sep 29, 2022 | 09:30 | 103B | 94B | 103B | |
| Sep 22, 2022 | 09:30 | 103B | 93B | 77B | |
| Sep 15, 2022 | 09:30 | 77B | 73B | 54B | |
| Sep 08, 2022 | 09:30 | 54B | 54B | 61B | |
| Sep 01, 2022 | 09:30 | 61B | 58B | 60B | |
| Aug 25, 2022 | 09:30 | 60B | 58B | 18B | |
| Aug 18, 2022 | 09:30 | 18B | 34B | 44B | |
| Aug 11, 2022 | 09:30 | 44B | 39B | 41B | |
| Aug 04, 2022 | 09:30 | 41B | 29B | 15B | |
| Jul 28, 2022 | 09:30 | 15B | 22B | 32B | |
| Jul 21, 2022 | 09:30 | 32B | 47B | 58B |
| Release Date | Time | Actual | Forecast | Previous |
|---|
| Jul 14, 2022 | 09:30 | 58B | 58B | 60B | |
| Jul 07, 2022 | 09:30 | 60B | 74B | 82B | |
| Jun 30, 2022 | 09:30 | 82B | 74B | 74B | |
| Jun 23, 2022 | 09:30 | 74B | 65B | 92B | |
| Jun 16, 2022 | 09:30 | 92B | 97B | ||
| Jun 09, 2022 | 09:30 | 97B | 96B | 90B | |
| Jun 02, 2022 | 09:30 | 90B | 86B | 80B | |
| May 26, 2022 | 09:30 | 80B | 89B | 89B | |
| May 19, 2022 | 09:30 | 89B | 87B | 76B | |
| May 12, 2022 | 09:30 | 76B | 79B | 77B | |
| May 05, 2022 | 09:30 | 77B | 68B | 40B | |
| Apr 28, 2022 | 09:30 | 40B | 38B | 53B | |
| Apr 21, 2022 | 09:30 | 53B | 37B | 15B | |
| Apr 14, 2022 | 09:30 | 15B | 15B | -33B | |
| Apr 07, 2022 | 09:30 | -33B | -26B | 26B | |
| Mar 31, 2022 | 09:30 | 26B | 21B | -51B | |
| Mar 24, 2022 | 09:30 | -51B | -56B | -79B | |
| Mar 17, 2022 | 09:30 | -79B | -73B | -124B | |
| Mar 10, 2022 | 10:30 | -124B | -117B | -139B | |
| Mar 03, 2022 | 10:30 | -139B | -138B | -129B | |
| Feb 24, 2022 | 10:30 | -129B | -134B | -190B | |
| Feb 17, 2022 | 10:30 | -190B | -193B | -222B | |
| Feb 10, 2022 | 10:30 | -222B | -222B | -268B | |
| Feb 03, 2022 | 10:30 | -268B | -216B | -219B | |
| Jan 27, 2022 | 10:30 | -219B | -216B | -206B | |
| Jan 20, 2022 | 10:30 | -206B | -194B | -179B | |
| Jan 13, 2022 | 10:30 | -179B | -173B | -31B | |
| Jan 06, 2022 | 10:30 | -31B | -54B | -136B | |
| Dec 30, 2021 | 10:30 | -136B | -125B | -55B | |
| Dec 23, 2021 | 10:30 | -55B | -56B | -88B |
| Dec 16, 2021 | 10:30 | -88B | -86B | -59B | |
| Dec 09, 2021 | 10:30 | -59B | -54B | -59B | |
| Dec 02, 2021 | 10:30 | -59B | -57B | -21B | |
| Nov 24, 2021 | 12:00 | -21B | -22B | 26B |
| Release Date | Time | Actual | Forecast | Previous |
|---|
| Nov 18, 2021 | 10:30 | 26B | 25B | 7B | |
| Nov 10, 2021 | 12:00 | 7B | 10B | 63B | |
| Nov 04, 2021 | 09:30 | 63B | 63B | 87B | |
| Oct 28, 2021 | 09:30 | 87B | 86B | 92B | |
| Oct 21, 2021 | 09:30 | 92B | 90B | 81B | |
| Oct 14, 2021 | 09:30 | 81B | 94B | 118B | |
| Oct 07, 2021 | 09:30 | 118B | 105B | 88B | |
| Sep 30, 2021 | 09:30 | 88B | 87B | 76B | |
| Sep 23, 2021 | 09:30 | 76B | 75B | 83B | |
| Sep 16, 2021 | 09:30 | 83B | 76B | 52B | |
| Sep 09, 2021 | 09:30 | 52B | 40B | 20B | |
| Sep 02, 2021 | 09:30 | 20B | 25B | 29B | |
| Aug 26, 2021 | 09:30 | 29B | 40B | 46B | |
| Aug 19, 2021 | 09:30 | 46B | 31B | 49B |
| Aug 12, 2021 | 09:30 | 49B | 49B | 13B | |
| Aug 05, 2021 | 09:30 | 13B | 21B | 36B | |
| Jul 29, 2021 | 09:30 | 36B | 43B | 49B | |
| Jul 22, 2021 | 09:30 | 49B | 44B | 55B | |
| Jul 15, 2021 | 09:30 | 55B | 47B | 16B | |
| Jul 08, 2021 | 09:30 | 16B | 34B | 76B | |
| Jul 01, 2021 | 09:30 | 76B | 68B | 55B | |
| Jun 24, 2021 | 09:30 | 55B | 66B | 16B | |
| Jun 17, 2021 | 09:30 | 16B | 72B | 98B | |
| Jun 10, 2021 | 09:30 | 98B | 98B | 98B | |
| Jun 03, 2021 | 09:30 | 98B | 95B | 115B | |
| May 27, 2021 | 09:30 | 115B | 104B | 71B |
Larry and Mike
Translation, please. Supply is drastically increasing, no major severe weather for balance of November, thus find price 6ish to sell?? Is this accurate?
TIA
Tjc,
"Dry natural gas production has been rising since the first quarter of 2022, when it averaged 94.6 billion cubic feet per day (Bcfd). The Energy Information Administration (EIA) forecasts U.S. natural gas production to average 99.0 Bcfd during fourth-quarter 2022 and then rise to 100.4 Bcfd in 2023. "
So, production per day is projected to have risen 4.4 bcf/day from the 1st quarter of 2022 to the current quarter. That translates to 31 bcf/week higher production. If we were to hold all other variables constant, that would mean that if there had not been any increase in production, the highest EIA weekly injection this autumn would have been only ~96, which would have been near the longterm average highest autumn injection. A 4.4 bcf/day increase is equivalent to ~134 bcf/month and ~400 bcf/qtr.
An increase in production has been anticipated for 2022+ for at least the last year, but I don't think it was expected to be this much. The huge price rises during the first half of 2022 likely have had a good bit to do with that.
Hi tjc!
Larry stopped trading natural gas almost a year ago because other things were causing it to go against weather. Sometimes featuring enormous spikes from news or in some cases smaller spikes below support and above resistance from traders manipulating the price to take advantage.
The other really huge thing is exports and prices in Europe. They really have had a major impact on US prices at times, often much more than weather.
I've hardly traded at all this year, partly for the same reason.
Here's an example of the crazy trading in the last week or so:
https://www.marketforum.com/forum/topic/89973/#90342
By metmike - Nov. 6, 2022, 12:39 a.m.
Insane trading on Friday 11-4-22. +3,000/contract very early on colder models overnight. Then reversing down to lower on the day by mid-morning. Then reversing back +$6,000/contract from the lows on the close.
++++++++++++++++++++++++++++
https://www.marketforum.com/forum/topic/89973/#90363
By metmike - Nov. 6, 2022, 5:55 p.m.
4:55pm: Big gap higher coming.
5:01pm: That was crazy. +6,000/contract on the open!
+++++++++++++++
https://www.marketforum.com/forum/topic/89973/#90418
By metmike - Nov. 8, 2022, 1:21 p.m.
NG down more than $10,000/contract vs yesterday at this time.
++++++++++++++
https://www.marketforum.com/forum/topic/89973/#90506
By metmike - Nov. 11, 2022, 12:49 p.m.
Some sort of news must have hit a few minutes before 10am.
NG went from +3,000/contract and in the midst of a strong push higher, on the highs......to -4,000/contract in 1 hour with more than half of that -7,000 loss in a 5 minute period.
++++++++++++++++++++++++
Your assumption is a good one, tjc, if supplies keep gushing in. However, a damaged export facility has been down for months and is scheduled to be running again anytime now. That will send out enough ng to use up some to possibly most of the extra supply we've seen the last 2 months.
++++++++++++++++++++
https://www.reuters.com/business/energy/us-gas-exports-squeeze-domestic-supply-kemp-2022-09-29/
LONDON, Sept 29 (Reuters) - U.S. gas production will need to increase significantly to continue growing exports while ensuring fuel remains affordable for domestic power producers, households and industrial users.
Production of dry gas (stripped of natural gas liquids) totalled 17,329 billion cubic feet in the first six months of the year, according to data from the U.S. Energy Information Administration (EIA).
Dry gas output was up by 944 billion cubic feet compared with the same period in 2019, the last year before the pandemic ("Monthly energy review", EIA, Sept. 27).
Domestic consumption increased by 440 billion cubic feet, with electricity generators accounting for 382 billion.
But exports surged by 1,408 billion cubic feet largely as a result of the commissioning of large new liquefaction terminals.
The massive increase in LNG exports has significantly tightened the availability of gas for domestic users and put upward pressure on prices.
As a result, inventories depleted by 876 billion cubic feet in the first six months of 2022 compared with just 246 billion in the first six months of 2019.
The drawdown was the second-largest on record and 65% higher than the average over the previous 10 years.
Chartbook: U.S. gas production, consumption and exports
OUTPUT GROWTH
To maintain and grow exports U.S. gas producers will need to increase their output significantly in both the short and longer term.
++++++++++++
metmike: We've obviously done that this Fall with the record injections.
Previous natural gas thread:
Gentlemen
Thank you both for replying.
It seems production increases is KNOWN. The amount of export unknown, but also increasing.
Buy/sell extremes--on a daily basis. NOT an easy ticket.
Again, thank you
YW tjc!
After typing about how crazy NG is and not following weather........it exactly followed weather overnight.
The 0z European model came out +13 HDDs around 1:30 am and NG never looked back, without the extreme spikes down(most were somewhat controlled).
Despite this, it still warms temps back to average at the end of 2 weeks and under the current environment of supply gushing in, we need sustained, continuous cold and/or models that keep getting colder(like this last one overnight) for high confidence moves up. In the absence of that, there will be heavy downward pressure on ng prices.
The GFS was also colder overnight.
12z models were less cold, the Euro by -14 HDDs. So it took back the extra cold put in on the previous model.
so we plunged to -5,000 from the highs, almost unchanged on the day.
back a bit to +1,000 Since the fri close. This is more like the wild ng market trading that we’ve come to dislike.
U.S. natural gas futures swung on Monday as the market continued to weigh conflicting information about when Freeport LNG might return to service. While Henry Hub ultimately finished higher, a rally earlier in the day fizzled after Bloomberg cited anonymous sources who said the terminal would likely cancel shipments scheduled for November and December. The…
++++++++++++++++
This is what I said earlier about the export news having enormous impact on prices that crushes any weather at the time.
+++++++++++++++
Tuesday morning and early afternoon: The 12z GFS was +5 HDDs(although its 6z run was -6 HDDs) and the EURO -2 HDDs vs the 0z runs. With Freeport LNG news being capable of causing a 5,000/contract spike, don't trade this market without a stop.
The expected, bearish week 2 huge warm up is showing up too. Some of this was dialed in with last weeks plunge lower(after the spike higher). All other key items unchanged, as these mild temps get closer and don't change to colder, it should put pressure on ng prices.
https://www.cpc.ncep.noaa.gov/products/predictions/814day/index.php
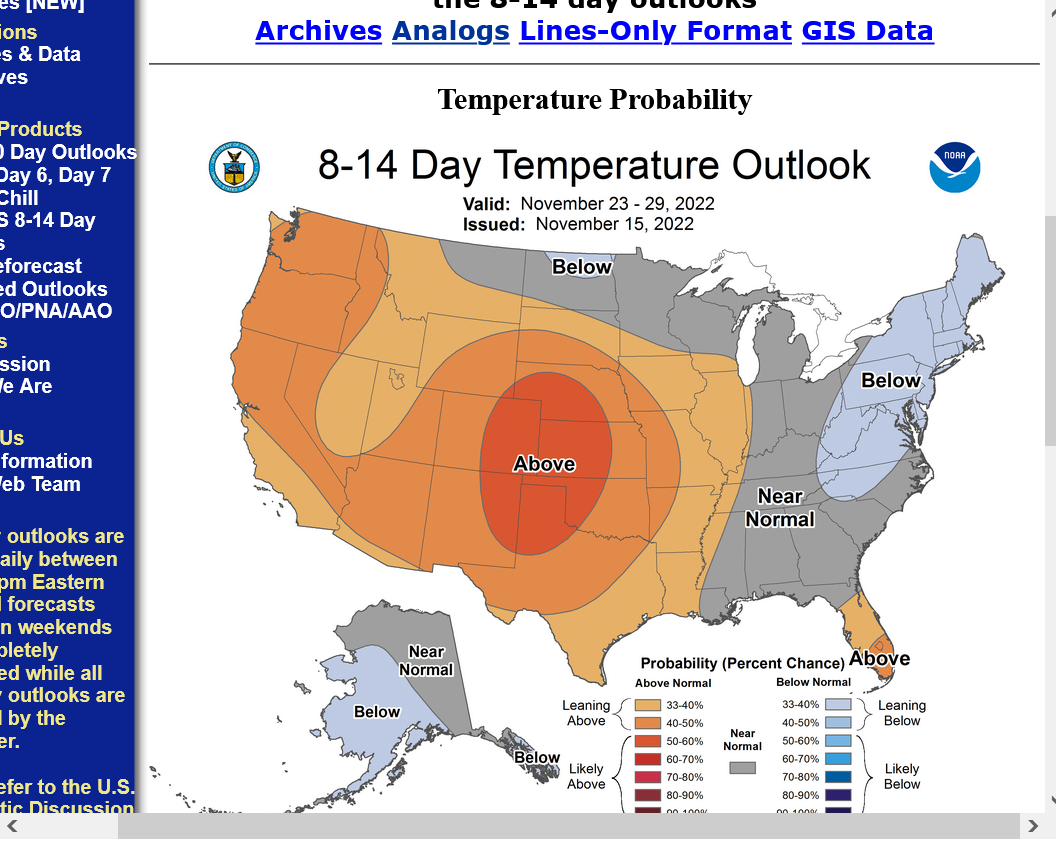
However, the AO and NAO are moving into negative territory which often means more cold than the models think:
https://www.marketforum.com/forum/topic/83844/#83856
Arctic Oscillation Index, North Atlantic Oscillation Index, Pacific North American Index.
https://www.cpc.ncep.noaa.gov/products/precip/CWlink/daily_ao_index/ao.shtml

https://www.cpc.ncep.noaa.gov/products/precip/CWlink/pna/nao.shtml

https://www.cpc.ncep.noaa.gov/products/precip/CWlink/pna/pna.shtml

Another robust injection likely on Thursday, especially for November. Near record warmth in the highly populated East and Midwest that uses the most natural gas for residential heating. So extremely wimpy demand for heating.
https://www.cpc.ncep.noaa.gov/products/tanal/temp_analyses.php

Natural gas futures pushed higher a second straight day as wintry weather canvassed the Midwest and Northeast – key natural gas demand regions – fueling consumption and supporting prices. The December Nymex gas futures contract gained 10.1 cents day/day and settled at $6.034/MMBtu. January rose 9.6 cents to $6.395. NGI’s Spot Gas National Avg., meanwhile,…
+++++++++++++++++++
There's been enough cold this week and next week to think that we could have the first double drawdowns of the heating season. On Nov 24 and 31. Not sure when the average first drawdown is but probably right around this time frame. Last year, it was Nov 24, 2021 but supplies weren't gushing in like they are now. It also wasn't nearly this cold. Below is was the temperature map for that -21 BCF drawdown. Not close to be how cold this week is.

Same forecast as it has been this week, we're just getting closer to the warm up in week 2. However, there is tremendous spread in the solutions, especially with the -AO and -NAO which favor colder than what the average of solutions thinks. It could still morph colder with that -NAO, -AO in addition to the La Nina.
If the MJO gets to phase 7 and is amplified, it would likely cause forcing for cold in the Midwest and vicinity. The individual GFS solutions especially have some pretty amplified versions for the MJO!
However, phase 6 is mild and we have alot of high amplitude phase 6 coming up for the 2nd half of this month. So the point is that the cold forcing from a -AO, -NAO coming from the north, could be blocked by an MJO forcing in the Pacific that dominates if its in the opposite direction(keeping the cold, mostly locked up in Canada.
However, if it phases with the -AO/-NAO in a phase 7 and high amplitude(maximizing the potential impact) then it would be very cold in the same places where a different phase blocks the cold. This could follow a phase 6, transient very mild period later this month.
At the same time, the La Nina has also been dampening out the MJO because of the cold water to the east. However, the MJO signal looks to be very strong/amplified.
Bottom line is we have uncertainty towards the end of the month on what will happen. After the very high confidence moderation next week.
https://www.cpc.ncep.noaa.gov/products/precip/CWlink/MJO/mjoupdate.pdf


https://opensnow.com/news/post/the-madden-julian-oscillation-mjo-explained

+++++++++++++++
++++++++++++++++++++++++++++

NG bounced back almost 5,000/contract from the lows. Most of it came between 1-1:30pm CST. Not from weather, I don't think. Maybe news on the Freeport outage finally over? Or something from Europe? Other news?
The middle part of the 12z Euro was much milder but then last 5 days much colder and it came out to almost the same HDDs. The GFS was +5 HDDs vs the 0z run.
Natural gas futures edged higher again on Wednesday, extending a rally to three days, as traders ultimately paid more attention to robust heating demand than the protracted shutdown of a key export facility and the likelihood of a relatively robust storage injection. At A Glance: Cold weather remains at forefront Analysts expect large storage build…
+++++++++++++++++++++
The 0z GFS just out was a whopping -15 HDDs bearish vs the previous 18z run(-7 HDDs from the 12z run) all from days 9-12)........but ng went up anyways.
It was quickly followed by the European model(the market follows this one the most) +11 HDDs bullish(all from days 6-9).
This has us +1,700/contract. Possibly the very bearish EIA report later today will keep us from going too much higher??? Though, it likely already dialed in.
https://ir.eia.gov/ngs/ngs.html
for week ending November 11, 2022 | Released: November 17, 2022 at 10:30 a.m. | Next Release: November 23, 2022
+64 BCF. stocks are now +4 BCF vs last year and only -7 BCF vs the 5 year average. Look at the blue line below. Next 2 weeks will be drawdowns however.
| Working gas in underground storage, Lower 48 states Summary text CSV JSN | |||||||||||||||||||||||||
|---|---|---|---|---|---|---|---|---|---|---|---|---|---|---|---|---|---|---|---|---|---|---|---|---|---|
| Historical Comparisons | |||||||||||||||||||||||||
| Stocks billion cubic feet (Bcf) | Year ago (11/11/21) | 5-year average (2017-21) | |||||||||||||||||||||||
| Region | 11/11/22 | 11/04/22 | net change | implied flow | Bcf | % change | Bcf | % change | |||||||||||||||||
| East | 882 | 865 | 17 | 17 | 900 | -2.0 | 902 | -2.2 | |||||||||||||||||
| Midwest | 1,084 | 1,068 | 16 | 16 | 1,078 | 0.6 | 1,078 | 0.6 | |||||||||||||||||
| Mountain | 208 | 208 | 0 | 0 | 212 | -1.9 | 212 | -1.9 | |||||||||||||||||
| Pacific | 241 | 247 | -6 | -6 | 261 | -7.7 | 290 | -16.9 | |||||||||||||||||
| South Central | 1,228 | 1,193 | 35 | 35 | 1,189 | 3.3 | 1,169 | 5.0 | |||||||||||||||||
| Salt | 327 | 311 | 16 | 16 | 330 | -0.9 | 318 | 2.8 | |||||||||||||||||
| Nonsalt | 901 | 882 | 19 | 19 | 859 | 4.9 | 851 | 5.9 | |||||||||||||||||
| Total | 3,644 | 3,580 | 64 | 64 | 3,640 | 0.1 | 3,651 | -0.2 | |||||||||||||||||
Totals may not equal sum of components because of independent rounding. | |||||||||||||||||||||||||
Working gas in storage was 3,644 Bcf as of Friday, November 11, 2022, according to EIA estimates. This represents a net increase of 64 Bcf from the previous week. Stocks were 4 Bcf higher than last year at this time and 7 Bcf below the five-year average of 3,651 Bcf. At 3,644 Bcf, total working gas is within the five-year historical range.
For information on sampling error in this report, see Estimated Measures of Sampling Variability table below.

The U.S. Energy Information Administration (EIA) on Thursday reported an injection of 64 Bcf natural gas into storage for the week ended Nov. 11. The result was roughly in line with expectations and, with a shift to withdrawals expected soon, Nymex natural gas futures held in positive territory in morning trading. Ahead of the EIA…
++++++++++++++++++++++++++
The next 2 weeks should feature withdrawals from this extreme cold. Extended forecasts are likely to continue to warm up from west to east. Historically, ng would be under pressure with this current weather dynamic. ........extreme cold near term shrinking from the progression of days and warmth expanding in the extended from the progression of days.
However, we're almost $7,000/contract higher than yesterday at this time(when that could have been OVER dialed in), so there's something else going on.
It's possible the extremely mild November weather could only get us a bit below $6 from speculation trade and that represents strong fair value in this environment and speculators are not doing to press the short side after we already dropped so far since the highs just over 2 months ago.
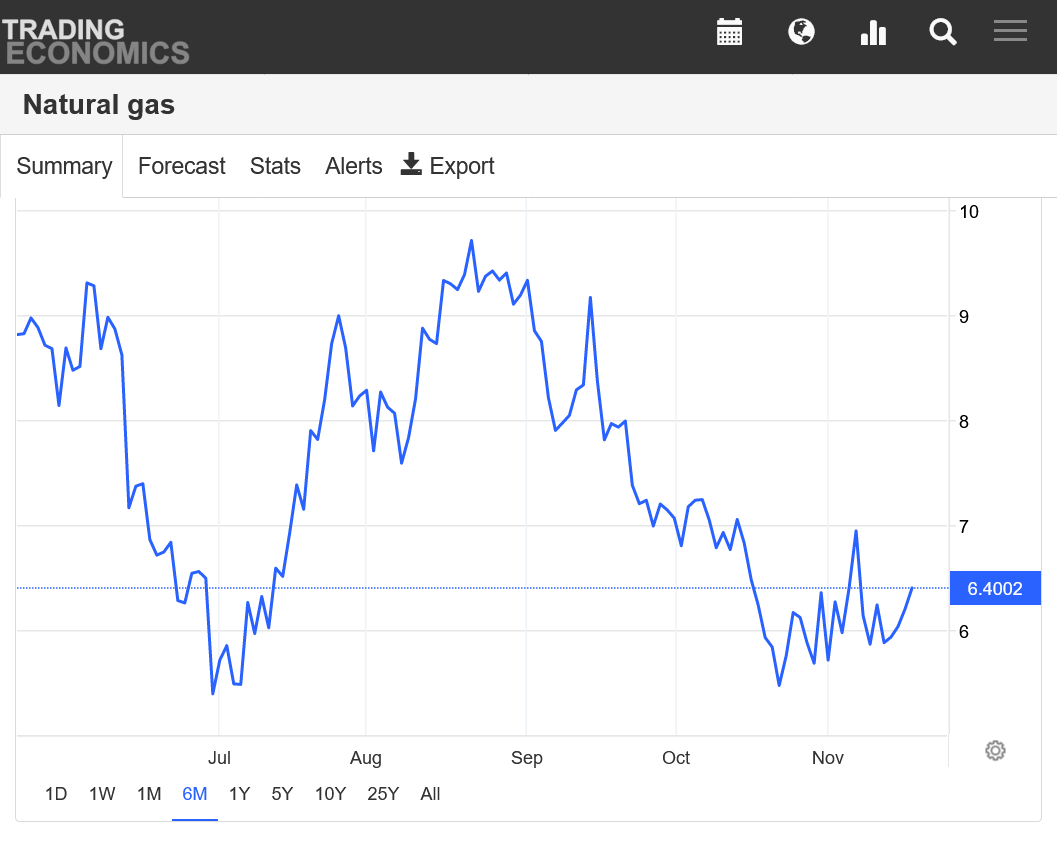
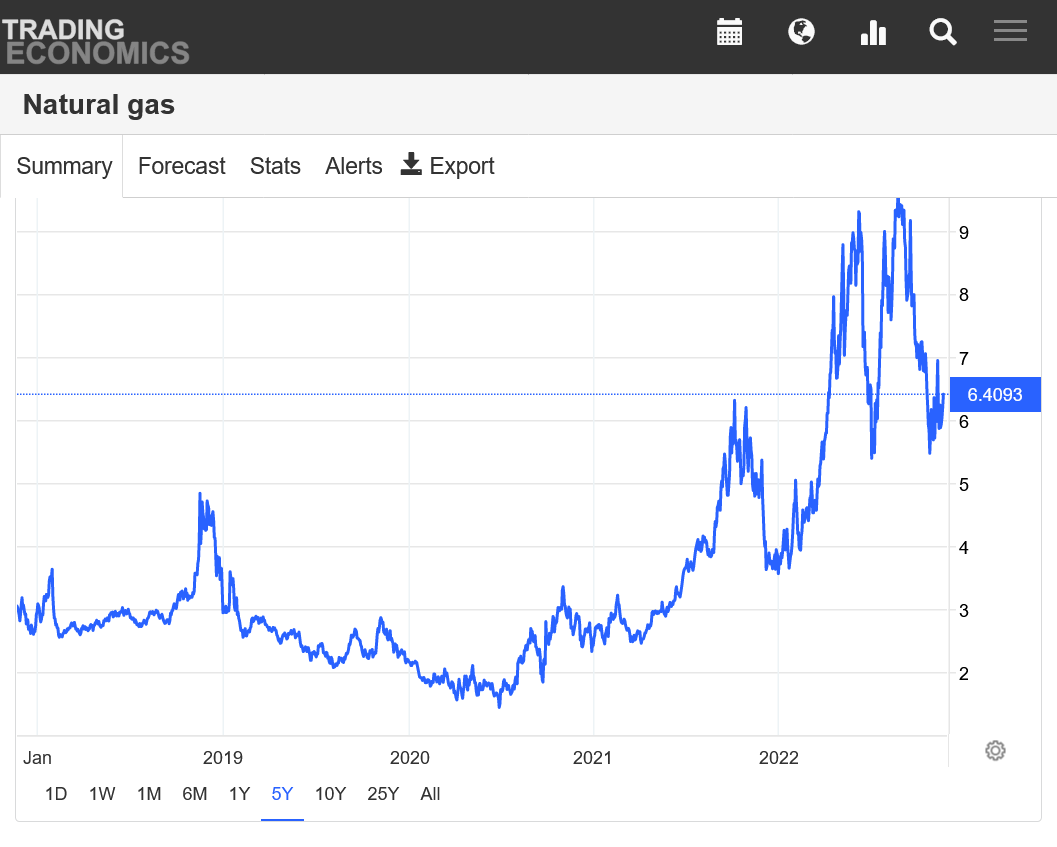
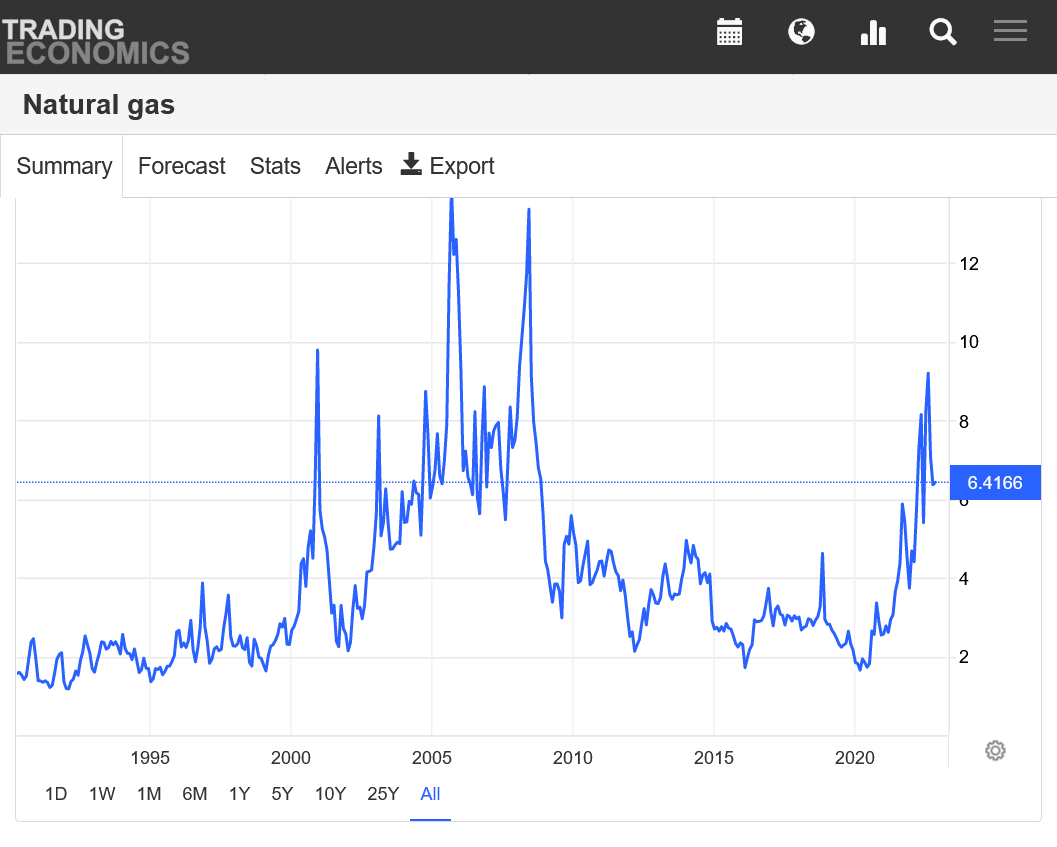
https://tradingeconomics.com/commodity/natural-gas
1 week below. We're on the highs for this week.
++++++++++
6 months below. Huge drop since we spiked near $10 just over 2 months ago. Double bottom with July spike low.
+++++++++++++++++++
5 years below. Double top just below $10 this past Summer.
+++++++++++++++++++++
30+ years below. You can see what the incredible new supply did to prices over a decade ago when with fracking and horizontal drilling tapped into massive natural gas on land.
But we've entered a new era because the NG industry has been building export terminals the last 5+ years and now we export much of the extra gas.
Natural gas futures prices flew higher once again on Thursday, rallying a fourth consecutive day on cold weather and mounting demand that pointed to steep storage withdrawals following what analysts expect was the last reported injection of the year. The December Nymex natural gas futures contract settled at $6.369/MMBtu, up 16.9 cents day/day. January climbed…
+++++++++++++++++++++++
MJO phase 6 in week 2 is very mild except along the East/Northeast Coast. That with the -NAO favors chilly weather still there where a lot of people live.
Even so, we are losing cold HDD days at the start of the forecast and replacing them with milder HDD days at the end of the 2 week forecasts.
Arctic Oscillation Index, North Atlantic Oscillation Index.
https://www.cpc.ncep.noaa.gov/products/precip/CWlink/daily_ao_index/ao.shtml

https://www.cpc.ncep.noaa.gov/products/precip/CWlink/pna/nao.shtml
 https://www.cpc.ncep.noaa.gov/products/predictions/814day/index.php

Here's the latest I could find on the still down Freeport facility.
Nov. 16 (UPI) -- The company in charge of operations at the Freeport LNG export facility in Texas said the lack of pressure protections on its equipment was to blame for a June 8 explosion that's kept the facility offline.
Freeport is the second-largest facility of the kind in the United States. The explosion at the facility in June came just as the global energy sector was working to adjust to the marginalization of Russian natural gas that came as a result of the war in Ukraine.
At its peak, Freeport could process about 2 billion cubic feet of natural gas per day (Bcf/d) and export as much as 15 million tons of LNG each year. The company provided no information on a possible restart date.
While seasonal and demand factors apply, U.S. data suggest LNG exports are down due to the loss of Freeport. Between Nov. 3 and Nov. 9, federal data show 21 vessels laden with U.S.-derived LNG left export terminals with a combined 78 billion cubic feet of gas in liquid form.
But before the incident, between May 19 and May 25, data show 24 vessels left with a combined capacity of 90 billion cubic feet of product.
Federal estimates, meanwhile, show total U.S. LNG exports are on pace to increase by around 13% from this year's average to reach 12.33 Bcf/d on average for 2023.
RELATED Vessels carrying liquefied natural gas line up off European shores
++++++++++++++++++++++++++++
My analysis: It appears that this explosion has been taking away an additional 2 BCF/day of exports. This would be an extra 14 BCF/week added to supplies and going into storage. If we look at the record storage injections below and subtract 14 BCF/week from the injections(if Freeport were actively exporting), we would have seen only 2 weeks with 100+ injections instead of 6. Still very robust injections and probably still a record but not extreme record obliterating injections like we've seen the last 2+ months that got us caught up from a -349 BCF storage deficit vs the 5 year average in early September to just -7 BCF today. In just over 2 months, we gained +342 BCF. Maybe +140 BCF came from Freeport being down?
https://www.marketforum.com/forum/topic/90609/#90612
| Release Date | Time | Actual | Forecast | Previous | |
|---|---|---|---|---|---|
| Nov 17, 2022 | 10:30 | 64B | 64B | 79B | |
| Nov 10, 2022 | 10:30 | 79B | 84B | 107B | |
| Nov 03, 2022 | 09:30 | 107B | 97B | 52B | |
| Oct 27, 2022 | 09:30 | 52B | 59B | 111B | |
| Oct 20, 2022 | 09:30 | 111B | 105B | 125B | |
| Oct 13, 2022 | 09:30 | 125B | 123B | 129B | |
| Oct 06, 2022 | 09:30 | 129B | 113B | 103B | |
| Sep 29, 2022 | 09:30 | 103B | 94B | 103B | |
| Sep 22, 2022 | 09:30 | 103B | 93B | 77B | |
| Sep 15, 2022 | 09:30 | 77B | 73B | 54B |
Milder overnight forecast trends for late November saw natural gas futures reverse lower in early trading Friday. Coming off a 16.9-cent rally in the previous session, the December Nymex contract was down 19.7 cents to $6.172/MMBtu at around 8:45 a.m.
+++++++++++++++++++++++++++++
Milder temps overnight and lower HDDs HAD ng lower, though its coming back.
0Z European model was -6 HDDs. GFS -9 HDDs vs the 12z run from Thursday.
In week 2, the NAO and AO are less negative today, which reduces the longer range cold risk a bit. They move towards 0 at the end of the period but still are negative thru week 2.
The 12z models have taken a turn to looking colder late in week 2.
Almost half the GFS ensemble members are looking coldish, especially northern tier.
http://www.meteo.psu.edu/fxg1/ewall.html
http://www.meteo.psu.edu/fxg1/ENSHGT_12z/f384.gif
Over half the Canadian ensemble members look cold.
https://weather.gc.ca/ensemble/charts_e.html?Hour=384&Day=0&RunTime=12&Type=gz
A few solutions are extreme and bring in an interaction with the polar vortex assisting the cold delivery.
+++++++++++++++++++++++++
https://www.cpc.ncep.noaa.gov/products/predictions/WK34/

+++++++++++++++++
This would come AFTER a big warm up in week 2.
https://www.cpc.ncep.noaa.gov/products/predictions/814day/814temp.new.gif

++++++++++++++++
The shift to cold in week 3 will likely be determined by the NAO signal, with some assistance in the intensity of cold from the AO.
We should also remember that the next 2 EIA weekly storage reports should be pretty bullish for this time of year after being bombarded with record/huge bearish injections the previous 2+ months.
https://www.naturalgasintel.com/u-s-drilling-tally-rises-on-natural-gas-oil-activity-gains/

++++++++++++++++++++++++
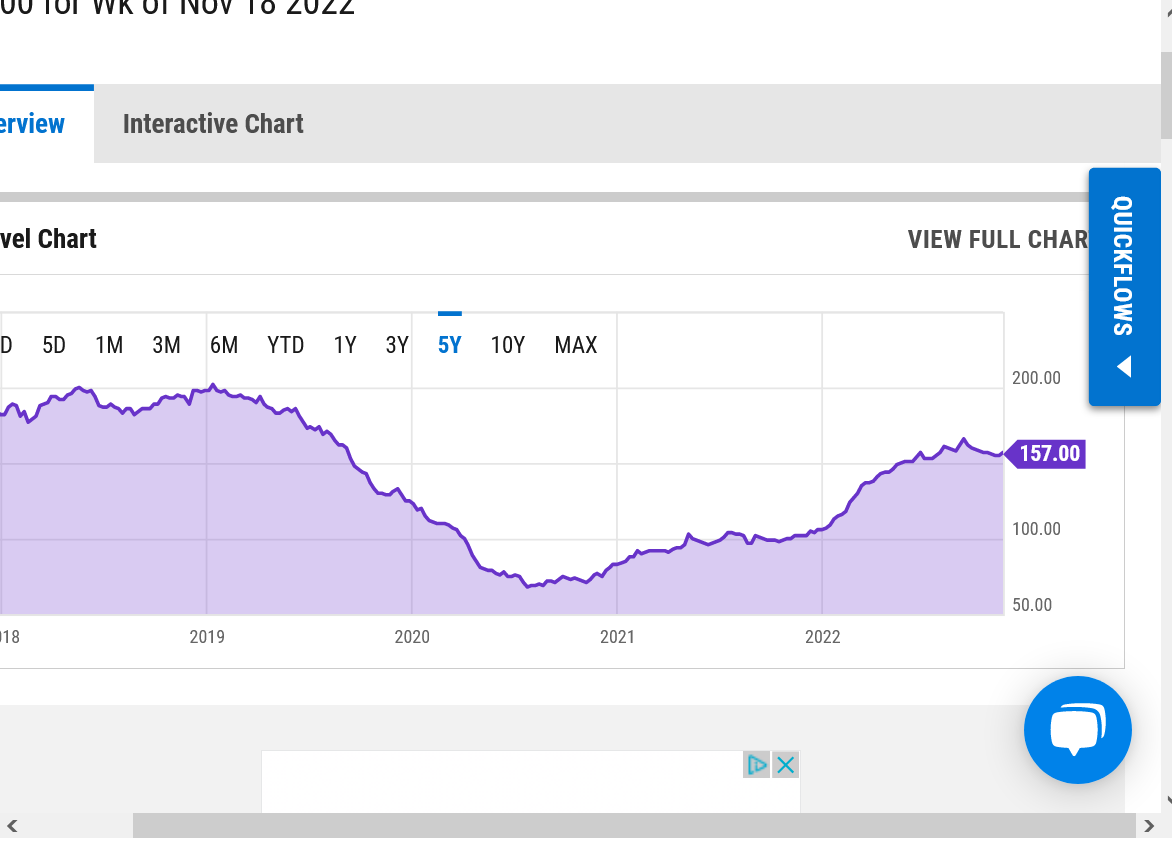
https://ycharts.com/indicators/us_gas_rotary_rigs
 +++++++++++++++++++++++++++++
Below, you can see what the age of fracking/horizontal drilling over land did with their MUCH MORE productive wells vs those in the GOM more than a decade ago.
https://www.eia.gov/dnav/ng/hist/e_ertrrg_xr0_nus_cm.htm
.png)
+++++++++++++++++++++++++++++++++
https://www.eia.gov/todayinenergy/detail.php?id=34732

++++++++++++++++++
A drilling technique that drills with an inclination of greater than 80 degrees to a vertical wellbore
Written byCFI Team
Updated November 13, 2022
https://corporatefinanceinstitute.com/resources/valuation/horizontal-well/
Big warm up this week, lasting thru week 2 has natural gas modestly lower this evening.
As forecasts over the weekend teased a colder Lower 48 pattern during the first week of December, natural gas futures rallied in early trading Monday. The December Nymex contract was up 14.1 cents to $6.444/MMBtu at around 8:45 a.m. ET. January was up 16.5 cents to $6.881. Freeport LNG on Friday announced that it expects…
+++++++++++++++++++++++
Colder temps late in week 2 overnight reversed us higher.
Huge warm up this week is coming.
Should be a pretty robust early season draw down this week. The EIA will come out on Wednesday because of Thanksgiving.
https://www.cpc.ncep.noaa.gov/products/tanal/temp_analyses.php

Natural gas futures found fresh footing on Monday, as traders mulled an updated relaunch timeline for a major export facility, railroad union members considered a strike, and forecasts pointed to another round of wintry weather in early December. At A Glance: LNG facility aims for December return Demand could intensify next month Analysts expect large…

++++++++++++++++++++++++
This one surprised me. They don't mention the big withdrawal coming up as we might guess that was dialed in. The updated MJO forecasts a phase 7 coming in early December that correlates some robust cold. Late week 2 models are really reacting, along with HDDs jumping higher.
See the analog/seasonal for phase 7 below.
https://www.marketforum.com/forum/topic/90609/#90715
https://www.cpc.ncep.noaa.gov/products/precip/CWlink/MJO/mjo.shtml#current

Hey Mike,
Did you notice that there was a six cent drop within just the 3 minute period from 11:02 PM to 11:05 PM CST? Was the part of the 0Z GEFS coming out then significantly warmer than the 18Z/12Z runs by chance? TIA
Thanks Larry,
I wasn't watching exactly at that time but the GFS ensemble was -9 HDDs, almost all from a milder pattern after day 6. Your explanation makes complete sense!
Larry,
We just saw an even bigger drop(double the earlier one) in a couple of minutes from the European model coming out milder in week 1!
We're into week 2 right now and have bounced back a bit with some colder days.
0z Euro ended up at -5 HDDs vs the 12z run, 12 hours earlier.
++++++++++++++++++++++++++++
NO! The 6z GFS(well before this story) was a whopping +11 HDDs vs the previous one!
NG 1 day, 1 week, 1 month, 1 year, 10 years, 30 years
https://tradingeconomics.com/commodity/natural-gas
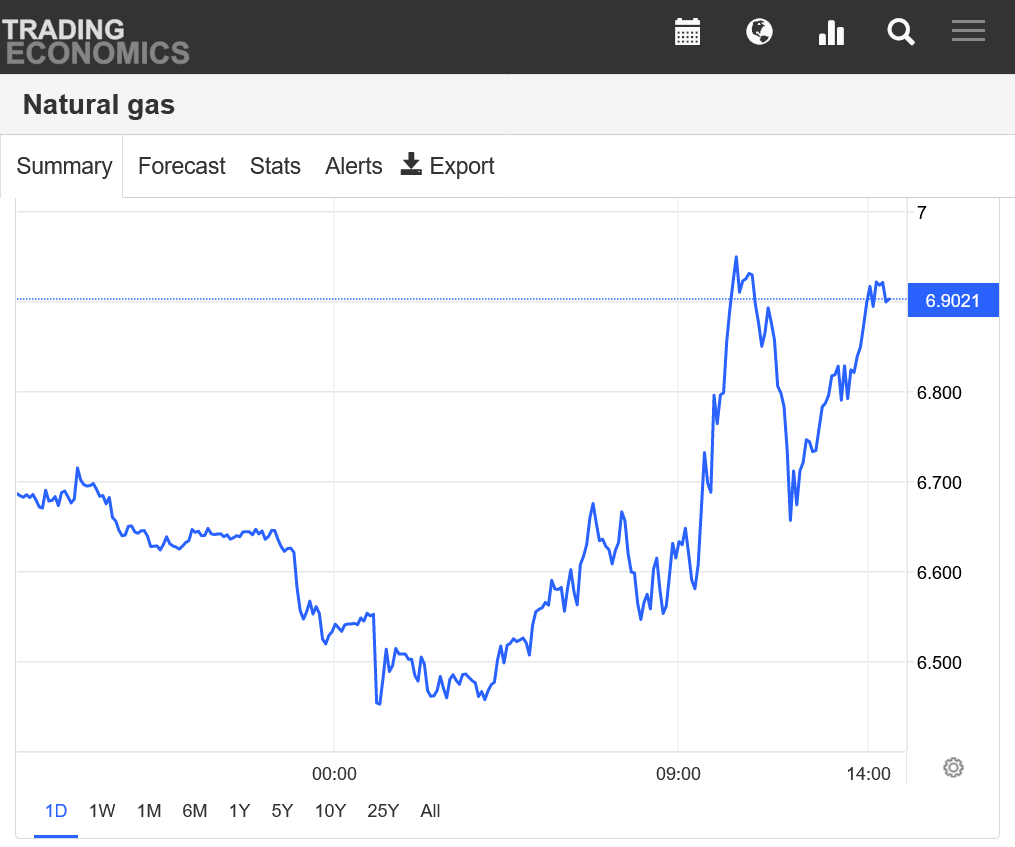


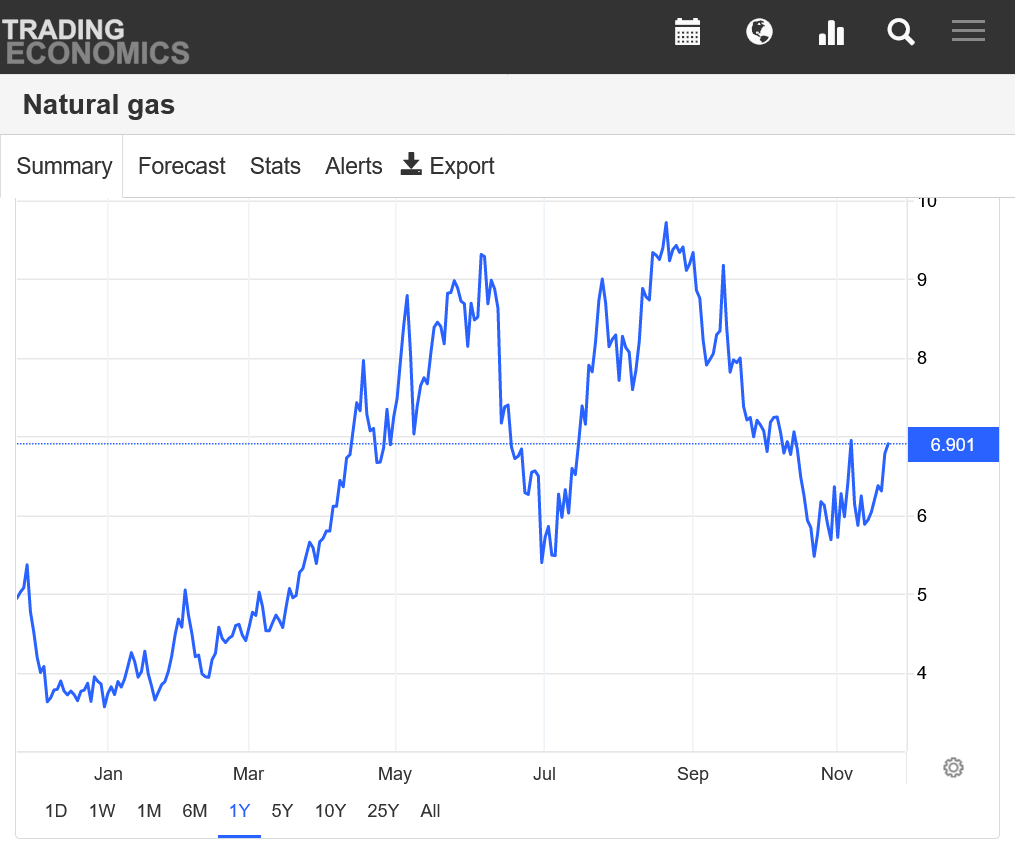
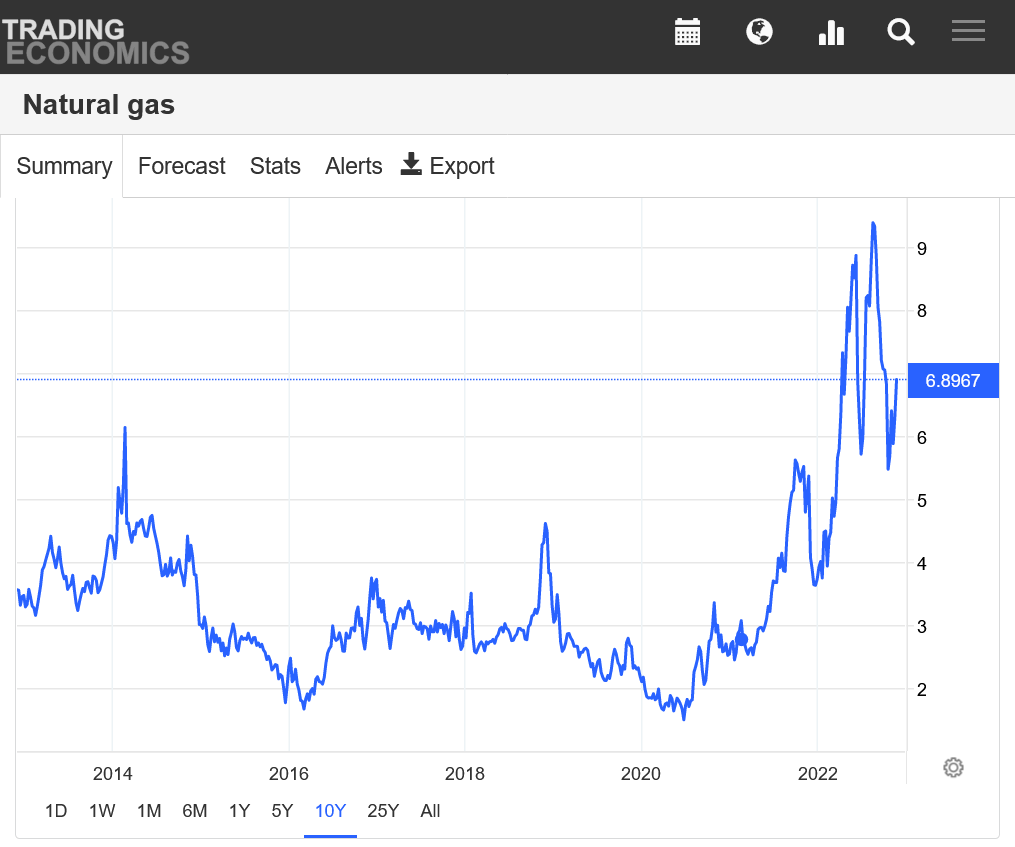

++++++++++++++++
Models are flip flopping with slight changes meaning huge HDD changes from a steep temperature gradient from northwest-cold to southeast-warm. This is actually close to the the La Nina analog. More week 2 maps are gaining a colder look to them.
NG rose steadily and strongly from 10:15 PM to 2:15 AM CST. This may be largely due to colder 0Z GEFS and EE though I'd defer to Mike on this.
After holding up well, there was an even steeper rise 6:30AM-8AM CST. From the best I can tell, the 6Z GEFS continued the colder trend. We'll see if Mike agrees.
Edit: The EIA was -80, bearish vs the WSJ average survey guess of -89. NG knee jerked down 17 cents within just 3-4 minutes of the 11AM CST release.
You nailed it, Larry!
0z GFS was +7 HDDs, (Euro +8 HDDs) followed by 6z GFS of +6 more HDDs.
++++++++++++++
NAO and AO forecast crashing lower in the last day vs previous forecast.
https://www.marketforum.com/forum/topic/83844/#83856
Arctic Oscillation Index, North Atlantic Oscillation Index.
https://www.cpc.ncep.noaa.gov/products/precip/CWlink/daily_ao_index/ao.shtml

https://www.cpc.ncep.noaa.gov/products/precip/CWlink/pna/nao.shtml

The U.S. Energy Information Administration (EIA) reported a withdrawal of 80 Bcf natural gas into storage for the week ended Nov. 18. The result came in slightly lighter than market expectations. Still, it was much steeper than the five-year average and supported already lofty Nymex natural gas futures. “We are clearly well into the heating…
++++++++++++++++++++++++
https://ir.eia.gov/ngs/ngs.html
for week ending November 18, 2022 | Released: November 23, 2022 at 12:00 p.m. | Next Release: December 1, 2022
-80 BCF bearish vs expectations but models turning much colder.
| Working gas in underground storage, Lower 48 states Summary text CSV JSN | |||||||||||||||||||||||||
|---|---|---|---|---|---|---|---|---|---|---|---|---|---|---|---|---|---|---|---|---|---|---|---|---|---|
| Historical Comparisons | |||||||||||||||||||||||||
| Stocks billion cubic feet (Bcf) | Year ago (11/18/21) | 5-year average (2017-21) | |||||||||||||||||||||||
| Region | 11/18/22 | 11/11/22 | net change | implied flow | Bcf | % change | Bcf | % change | |||||||||||||||||
| East | 866 | 882 | -16 | -16 | 891 | -2.8 | 883 | -1.9 | |||||||||||||||||
| Midwest | 1,063 | 1,084 | -21 | -21 | 1,068 | -0.5 | 1,061 | 0.2 | |||||||||||||||||
| Mountain | 203 | 208 | -5 | -5 | 210 | -3.3 | 210 | -3.3 | |||||||||||||||||
| Pacific | 232 | 241 | -9 | -9 | 262 | -11.5 | 289 | -19.7 | |||||||||||||||||
| South Central | 1,200 | 1,228 | -28 | -28 | 1,196 | 0.3 | 1,160 | 3.4 | |||||||||||||||||
| Salt | 318 | 327 | -9 | -9 | 337 | -5.6 | 317 | 0.3 | |||||||||||||||||
| Nonsalt | 882 | 901 | -19 | -19 | 859 | 2.7 | 843 | 4.6 | |||||||||||||||||
| Total | 3,564 | 3,644 | -80 | -80 | 3,626 | -1.7 | 3,603 | -1.1 | |||||||||||||||||
Totals may not equal sum of components because of independent rounding. | |||||||||||||||||||||||||
Working gas in storage was 3,564 Bcf as of Friday, November 18, 2022, according to EIA estimates. This represents a net decrease of 80 Bcf from the previous week. Stocks were 62 Bcf less than last year at this time and 39 Bcf below the five-year average of 3,603 Bcf. At 3,564 Bcf, total working gas is within the five-year historical range.
For information on sampling error in this report, see Estimated Measures of Sampling Variability table below.

+++++++++++++
This link not updated with the correct forecast
https://www.investing.com/economic-calendar/natural-gas-storage-386
12z GFS was -3 HDDs and Euro -5 HDDs but the market it on to the pattern change to much colder in week 2 and beyond and doesn't care about run to run fluctuations in HDDs that are mostly tied to a specific location of a particular air mass farther north or farther south during a particular time frame.
The overall pattern, trend and indices are all COLDER
++++++++++++++++++++++
Down -1,500 this evening with no changes in the weather.
NG has had a large drop (6.5%) over the last two hours (11AM-1PM CST). Was this due to warmer 12Z GEFS followed by a warmer 12Z Euro operational? Did they both have a large HDD drop vs their respective prior runs?
Edit at 1:20 PM CST:
1. I just realized NG closed early (12:45 PM). So, that 6.5% drop was during 11AM-12:45PM).
2. I looked at a free site that has 2m enter temperature anomalies (not HDDs) and can see clearly that the 6Z GEFS late week two was much colder than the 0Z, which looks like it helped lead to a significant rise in NG 5-6:15 AM.
3. That same site tells me that the 12Z GEFS was much warmer than the 6Z.
That's exactly right, Larry!
The GEFS model has been extremely jumpy, to use your word awhile back.
These were the HDDs for the last 4 runs:
18z- 291
0z-276
6z-290
12z-273
These were the HDDs from the European model.
12z-249
0z-248
12z-251
So if the market had stayed open longer, we likely would have seen some sort of a strong bounce/recovering because the colder EE came out AFTER the close, while the much less cold GEFS came out BEFORE the close.
Thanks, Mike. The GEFS did tend to be jumpier than the EPS from one run to the next in terms of HDDs back when I was following it closely. I agree with you that a decent bounce would very likely have occurred had the market had normal hours based on the HDDs you provided for the 12Z EE vs its earlier runs since unlike the 12Z GEFS it wasn't warmer than its prior run.
So, 12Z GEFS 273 vs 12Z EE at 251. I realize that the EE is one day shorter. So, taking that into account, the 12Z EE's 251 seems to be pretty comparable to the 12Z/0Z GEFS' 273/276 while it is warmer than the 6Z/18Z GEFS' 290/291. So, based strictly on the EE fwiw, the colder 6Z/18Z GEFS runs are less credible than the milder 12Z/0Z GEFS. Mike, what do you think?
I should have mentioned that you used that word to describe the GFS OPERATIONAL model and it couldn't be more appropriate!
Here's what the last 4 solutions showed for that model.
256, 260, 252 and 205 HDDs. A drop of 47 HDDs in one model run!!!
The maps, solutions and indices look pretty cold to me, Larry. I haven't a had a position over a weekend in........I don't remember the last time and this would be the least likely.
As noted from that last GEFS, the extremely tight temp gradient, means that small shifts in the physical location of it will pan out to huge double digit, multi day temperature changes in some locations where the gradient it steepest:
AO/NAO solidly negative.
https://www.marketforum.com/forum/topic/83844/#83856
The low skill week 3-4 forecast just out. I note that they are not weighting the MJO signal with any significance. Very steep temp gradient from north/northwest to south/southeast.
https://www.cpc.ncep.noaa.gov/products/predictions/WK34/

I don't get some of the guidance they mentioned in updated fashion but this was the last CFS for the period below:
It shows the extreme temp gradient. Much above temps to the southeast, Much below to the northwest. Since this is weeks 3-4, it's nothing to have it shift in 1 direction by 1,000 miles. When that happens, you get a situation like the last GFS operational model of -47 HDDs in just 1 model run(only that is over the more skillful weeks 1-2 using a crappy model)
The same thing happens to the best models in weeks 3-4, real quickly on a frequent basis because all the models are crappy beyond week 2(as you've reminded us of several times)

New weather discussion here:
https://www.marketforum.com/forum/topic/91060/
NGZ, the front month expires tomorrow. I note that volume is more than 3 times greater for the F/Jan contract. Actually, the difference is usually greater than that this close to expiration.
NG came out with a 1,000 spike higher after the open but has drifted off the highs for Dec and is close to the lows for the Jan.
NGZ spiked almost -5,000 in the last 90 minutes of low volume trading on Fri that featured an early close. The GFS was MUCH milder but that was quite a drop.
With a milder early December pattern in the latest forecasts arresting the market’s pre-Thanksgiving bullish momentum, natural gas futures were down sharply in early trading Monday. The expiring December Nymex contract was down 42.3 cents to $6.601/MMBtu at around 8:40 a.m. ET. Around the same time, January was off 27.6 cents to $7.054. Declines were…
+++++++++++++++++++++
AO/NAO very negative which usually transports bitter cold from high to middle latitudes.
https://www.marketforum.com/forum/topic/90609/#90990
However, the models keep it locked up in Canada with zonal flow in the US........for now.
Mike,
1) Was 12Z GEFS by any chance warmer than the 6Z and/or 0Z GEFS? I ask because I see NG fell 2.6% from 7.26 to 7.07 noon-12:50 PM CST.
2) Was 12Z EE by chance colder than 0Z EE? I see that NG rose 4.1% from 7.07 to 7.36 12:50-1:50 PM!
TIA
Edit: I just realized that the front month expired at 1:30 PM CST. Was that a factor in the late rise?
Great observations Larry!
The GFS ensemble was a whopping -11 HDDs
The EE was a tiny +1 HDDs.
The individual solutions are all over the place in the East but the -AO and Greenland type block will likely prevail and it probably will look like the colder ones.
++++++++++++
Here's another thing too. I think because of the hugely negative AO and NAO the forecasts in the East will get colder and colder this week with HDDs gradually going higher and higher. That's the main reason that we came back from the overnight crash lower in my opinion. It's also tough here too. Prices are not cheap and supplies are still gushing in, although the exports will resume soon and take a bit of that away.
Thanks, Mike. I just saw the days 14-15 of the 12Z EE and see a decent +PNA getting established then with it colder than the 0Z run in the E US. The 0Z run for then had a weaker version of a +PNA forming then with milder temps in the E US.

After falling in Friday’s session, the December Nymex natural gas contract dropped 31.2 cents day/day and settled at $6.712/MMBtu on Monday before rolling off the board. January, which takes over as the prompt month on Tuesday, slid 13.4 cents to $7.196.
NGI’s Spot Gas National Avg. shed 30.0 cents to $6.445.
NatGasWeather said forecasts over the weekend extended warmer trends for the first week of December and showed above-normal temperatures over the southern and eastern portions of the Lower 48.
“Much of the weather data favors a rather chilly U.S. pattern setting up Dec. 8-11,” a timeframe where “colder trends were observed” in the latest model runs, the firm said.
However, it’s questionable whether traders will “actually believe a colder pattern will arrive” given the data “once suggested a rather cold U.S. pattern was coming” during the first week of December “only to have it reverse notably warmer,” NatGasWeather added.
As of Monday, the near-term forecast had lost 24 gas-weighted heating degree days and 45 Bcf of natural gas demand versus pre-Thanksgiving holiday forecasts, EBW Analytics Group analyst Eli Rubin said.
This “set a decisively bearish tone,” he said.
Additionally, production topped 101 Bcf/d on Monday, within 1 Bcf/d of the record level reached earlier this fall.
Still, Rubin added, bullish catalysts abound. He noted the specter of a rail workers strike “as soon as Dec. 9,” and the Freeport LNG terminal could begin to “show signs” of returning to service in the coming weeks, a development that would help U.S. exporters meet robust European and Asian demand for liquefied natural gas.
Absent a labor agreement between management and unions by Dec. 8, a railway worker walkout could follow. This would disrupt coal deliveries and drive demand for gas as a substitute.
++++++++++++++++
The Weather is turning BULLISH natural gas NOT bearish. Here's the temps for this Thursday's EIA:

Model disparity on how long upcoming cold will last and how deeply SE it will penetrate.
then, will the east warm up or get cold after that?
im in the cold camp……for now.
++++++++
12z Euro was +10 HDDs but the market hardly went up. 18z GEFS this evening was -10 HDDS and we're down 1,000/contract. NOT very bullish.
Some sort of news was released around 9:50 CST which caused ng to spike down 2,500 in less than 3 minutes.
Maybe another delay in exports at the damaged export terminal???
+++++++++++
18z GEFS was +9 HDDs because of waking up more to the -NAO forcing, like the previous EE did. Gave us a nice bounce but keeps running into willing sellers.
metmike: Spike higher overnight, even with the EE being -3 HDDS. Maybe ahead of the EIA?? Then steady pressure since just after 8am, with a gradual drop of 4,000/contract in 3 hours since then.
https://ir.eia.gov/ngs/ngs.html
for week ending November 25, 2022 | Released: December 1, 2022 at 10:30 a.m. | Next Release: December 8, 2022
-81 BCF Expected
| Working gas in underground storage, Lower 48 states Summary text CSV JSN | |||||||||||||||||||||||||
|---|---|---|---|---|---|---|---|---|---|---|---|---|---|---|---|---|---|---|---|---|---|---|---|---|---|
| Historical Comparisons | |||||||||||||||||||||||||
| Stocks billion cubic feet (Bcf) | Year ago (11/25/21) | 5-year average (2017-21) | |||||||||||||||||||||||
| Region | 11/25/22 | 11/18/22 | net change | implied flow | Bcf | % change | Bcf | % change | |||||||||||||||||
| East | 840 | 866 | -26 | -26 | 870 | -3.4 | 868 | -3.2 | |||||||||||||||||
| Midwest | 1,040 | 1,063 | -23 | -23 | 1,046 | -0.6 | 1,043 | -0.3 | |||||||||||||||||
| Mountain | 197 | 203 | -6 | -6 | 207 | -4.8 | 208 | -5.3 | |||||||||||||||||
| Pacific | 226 | 232 | -6 | -6 | 263 | -14.1 | 288 | -21.5 | |||||||||||||||||
| South Central | 1,181 | 1,200 | -19 | -19 | 1,187 | -0.5 | 1,161 | 1.7 | |||||||||||||||||
| Salt | 314 | 318 | -4 | -4 | 335 | -6.3 | 324 | -3.1 | |||||||||||||||||
| Nonsalt | 867 | 882 | -15 | -15 | 852 | 1.8 | 838 | 3.5 | |||||||||||||||||
| Total | 3,483 | 3,564 | -81 | -81 | 3,572 | -2.5 | 3,569 | -2.4 | |||||||||||||||||
Totals may not equal sum of components because of independent rounding. | |||||||||||||||||||||||||
Working gas in storage was 3,483 Bcf as of Friday, November 25, 2022, according to EIA estimates. This represents a net decrease of 81 Bcf from the previous week. Stocks were 89 Bcf less than last year at this time and 86 Bcf below the five-year average of 3,569 Bcf. At 3,483 Bcf, total working gas is within the five-year historical range.
For information on sampling error in this report, see Estimated Measures of Sampling Variability table below.

+++++++++++++++
https://www.investing.com/economic-calendar/natural-gas-storage-386
Latest Release Dec 01, 2022 Actual-81B Forecast-84B Previous-80B
| ual | Forecast | Previous | |||
|---|---|---|---|---|---|
| Dec 01, 2022 | 10:30 | -81B | -84B | -80B | |
| Nov 23, 2022 | 12:00 | -80B | 63B | 64B | |
| Nov 17, 2022 | 10:30 | 64B | 63B | 79B | |
| Nov 10, 2022 | 10:30 | 79B | 84B | 107B | |
| Nov 03, 2022 | 09:30 | 107B | 97B | 52B | |
| Oct 27, 2022 | 09:30 | 52B | 59B | 111B | |
| Oct 20, 2022 | 09:30 | 111B | 105B | 125B | |
| Oct 13, 2022 | 09:30 | 125B | 123B | 129B | |
| Oct 06, 2022 | 09:30 | 129B | 113B | 103B | |
| Sep 29, 2022 | 09:30 | 103B | 94B | 103B | |
| Sep 22, 2022 | 09:30 | 103B | 93B | 77B | |
| Sep 15, 2022 | 09:30 | 77B | 73B | 54B |
HDDs continue to drop hard.
0z GFS was -14 HDDs vs 12z, mostly from days 5-9
0z EE was -10 HDDs vs 12z all from days 6-10
Individual solutions have an extreme range that when averaged together, cancel each other out, so that the average doesn't look like very many of the individual solutions. That means low confidence in anything except at least modest cold and likely more than the ensemble mean and HDDs indicate.
12z GEFS was -10 HDDs vs the 0z and -15 HDDs vs the 6z(that had been +5 HDDs vs the previous 0z).
So NG is getting crushed -$5,000/contract!
-$10,000/contract from very early Thursday morning!
++++++++
18z GEFS was another -10 HDDs. -50 HDDs from the peak GEFS 48 hours ago!
NG opened a whopping nearly 40 cents down from the Fri close? Did I see that right? Were the ensemble models much warmer vs 12Z Fri runs?
Thanks Larry,
in Louisville KY at a cheerleading competition with my grand daughter.
-13,000 from the early Thursday highs.
some places and several days in the east went from much below average temps 3.5 days ago in the forecast to above average Today.
I don’t have the 18z model output right now.
however, it looks like it will be shifting much colder late in week 2.
++++++++++
update-18z gefs was +2 HDDs vs the 12z and the 12z EE was +4 HDDs vs the previous 0z.
I’m thinking the HDDs may start going back up now as the colder end of period days replace the near term days.
theres a huge gap lower this evening from the fri low of 6.222 and tonights high of 5.926 If I remember it right.
that could end up being an exhaustion selling gap and crap if the forecast beyond week 2 keeps getting colder and colder and the gap gets filled.
continuing warmer would support a potential downside break away gap With supplies the rest of the month continuing to gush in and gain on previous years for the same weeks.
GEFS was milder.
0z was -12 HDDs vs the previous run but the market went up and filled the bottom of the gap. 6z was another -4 HDDs.
EE was almost a carbon copy.
models still teasing the mid month colder pattern but the milder change until then compared to last week is one of the biggest bearish shockers that I can remember for natural gas in 3 decades of trading based on temperatures affecting demand and price.
shocker to the market and to me. My forecast from last week was a massive bust For this upcoming period. Just sheer luck to not lose any money From standing on the sidelines.
+++++++++++
12z GEFS similar, EE coming out even milder. NG -$7,000 vs the close Friday. WOW!
Clearly the big gap lower last night was a downside break away gap.
+++++++++++++++++
EE -8 HDDs but above average HDDs the last 4 days from the potential change to colder. I just have to go with that because of how impressive this high level blocking pattern emerged with such gusto. It didn't result in cold in the East because the -PNA(West Coast) that Larry's been emphasizing over came the forcing at midlatitudes from the -NAO, so the cold was forced to come out in a different place on the planet.
500mb height anomalies below. This is around 3.5 miles up(between 16,000-20,000 feet)
https://www.psl.noaa.gov/map/images/ens/z500anom_nh_alltimes.html
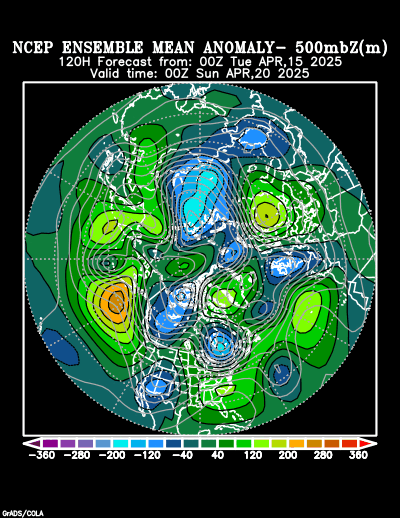
The 0z GEFS was +1 HDD vs the 18z run but was -5 HDDs vs the 12z run.
The 0z EE was another -11 HDDs vs the 12z run.
The GEFS (which had been the colder model) is down over 50 HDDs since the peak in the middle of last week. The EE is down around 30 HDDs. The EE is now slightly colder.
The price of NG is now -$17,000/contract lower than it was very early Thursday morning, less than 3 trading days ago(less than 5 actual days counting the weekend).
This has got to be one of the biggest % drops in so little time in history!
++++++++++++++++
GEFS has been getting colder the last 3 runs. Now +13 HDDs for the 18z run vs the 0z run. EE has been getting warmer. -7 HDDs for the 12z vs the 0z.
Massive disparity and spread in individual solutions at day 15.
0z GEFS another +13 HDDs vs the previous 18z run.
0z EE +10 HDDS vs the 12z run.
NG +$3,500 from the lows early on Tuesday afternoon after the milder EE came out.
Temps for Thursday's EIA. Should be on the bearish side compared to weeks in a similar time frame because of mild temps in the eastern half of the country where a lot of people live and heat their homes with NG.

Latest Release Dec 08, 2022 Actual-21B Forecast-31B Previous-81B
https://www.investing.com/economic-calendar/natural-gas-storage-386
-21 was a bit BEARISH
| Release Date | Time | Actual | Forecast | Previous | |
|---|---|---|---|---|---|
| Dec 08, 2022 | 10:30 | -21B | -31B | -81B | |
| Dec 01, 2022 | 10:30 | -81B | -84B | -80B | |
| Nov 23, 2022 | 12:00 | -80B | 63B | 64B | |
| Nov 17, 2022 | 10:30 | 64B | 63B | 79B | |
| Nov 10, 2022 | 10:30 | 79B | 84B | 107B | |
| Nov 03, 2022 | 09:30 | 107B | 97B | 52B |
+++++++++++++++++++++
https://ir.eia.gov/ngs/ngs.html
for week ending December 2, 2022 | Released: December 8, 2022 at 10:30 a.m. | Next Release: December 15, 2022
-21 a bit BEARISH!
| Working gas in underground storage, Lower 48 states Summary text CSV JSN | |||||||||||||||||||||||||
|---|---|---|---|---|---|---|---|---|---|---|---|---|---|---|---|---|---|---|---|---|---|---|---|---|---|
| Historical Comparisons | |||||||||||||||||||||||||
| Stocks billion cubic feet (Bcf) | Year ago (12/02/21) | 5-year average (2017-21) | |||||||||||||||||||||||
| Region | 12/02/22 | 11/25/22 | net change | implied flow | Bcf | % change | Bcf | % change | |||||||||||||||||
| East | 834 | 840 | -6 | -6 | 846 | -1.4 | 852 | -2.1 | |||||||||||||||||
| Midwest | 1,028 | 1,040 | -12 | -12 | 1,022 | 0.6 | 1,023 | 0.5 | |||||||||||||||||
| Mountain | 193 | 197 | -4 | -4 | 206 | -6.3 | 205 | -5.9 | |||||||||||||||||
| Pacific | 217 | 226 | -9 | -9 | 266 | -18.4 | 284 | -23.6 | |||||||||||||||||
| South Central | 1,191 | 1,181 | 10 | 10 | 1,173 | 1.5 | 1,157 | 2.9 | |||||||||||||||||
| Salt | 327 | 314 | 13 | 13 | 329 | -0.6 | 327 | 0.0 | |||||||||||||||||
| Nonsalt | 864 | 867 | -3 | -3 | 843 | 2.5 | 829 | 4.2 | |||||||||||||||||
| Total | 3,462 | 3,483 | -21 | -21 | 3,513 | -1.5 | 3,520 | -1.6 | |||||||||||||||||
Totals may not equal sum of components because of independent rounding. | |||||||||||||||||||||||||
Working gas in storage was 3,462 Bcf as of Friday, December 2, 2022, according to EIA estimates. This represents a net decrease of 21 Bcf from the previous week. Stocks were 51 Bcf less than last year at this time and 58 Bcf below the five-year average of 3,520 Bcf. At 3,462 Bcf, total working gas is within the five-year historical range.
For information on sampling error in this report, see Estimated Measures of Sampling Variability table below.

The colder models, especially the GEFS have continued the past 24 hours.
We've now eroded the bottom half of the bearish gap lower from the Friday last week close to the open Sunday Night.
Closing it would be a gap and crap selling exhaustion formation/signature.
We need to get above 6.226-ish to completely close the gap and this current area is tough resistance but more cold will do it.
Prices +7,000/contract from the lows 2 days ago.
There's a massive disparity/extreme in individual ensemble solutions 2 weeks out.......between bitter cold with a polar vortex unusually far south to mild, zonal flow.!
The GFS ensembles have cross polar flow on most solutions which would bring some really frigid air from Siberia, flushing it into Canada, poised to invade the US.
We closed that gap and closed above it to make it a gap and crap selling exhaustion formation.
We had a weekly reversal higher, closing around $9,000/contract above the lows.
1. 1 week
2. 1 month
3. 1 year
4. 10 years
5. 30 years
https://tradingeconomics.com/commodity/natural-gas

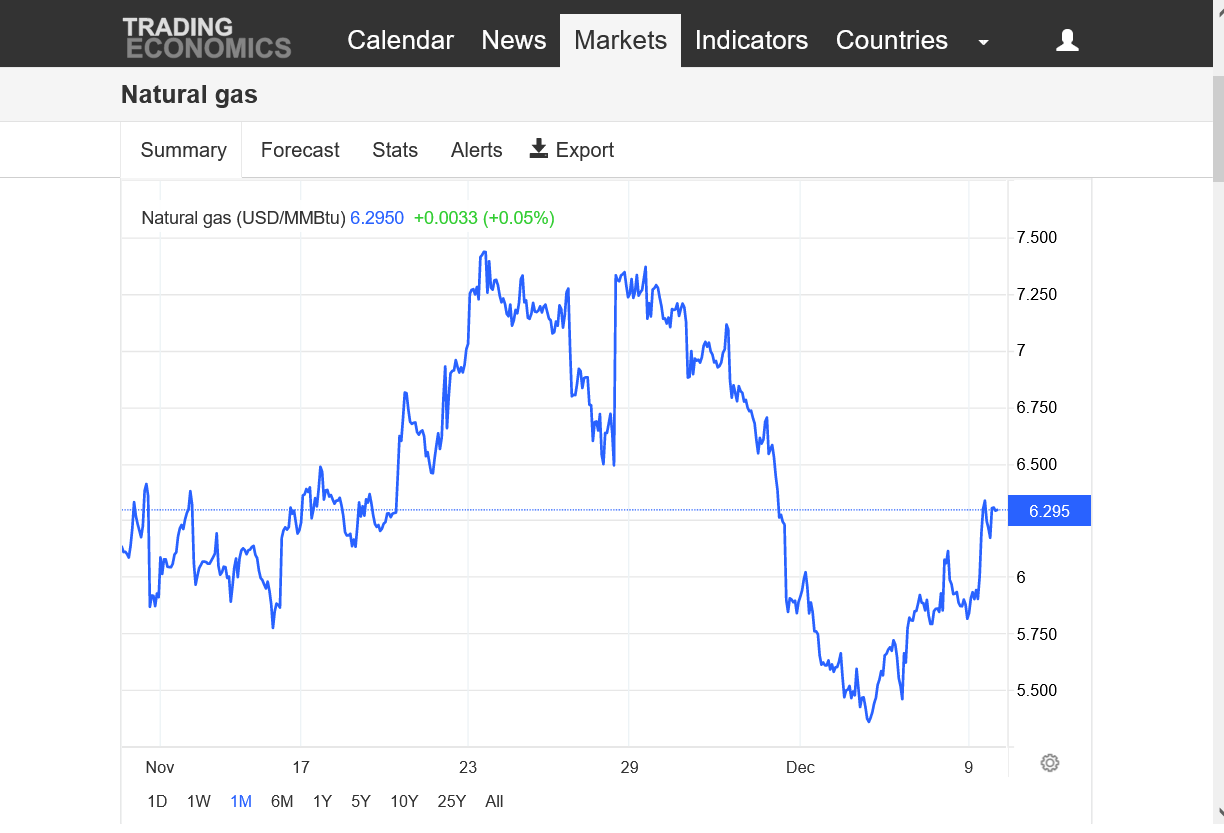

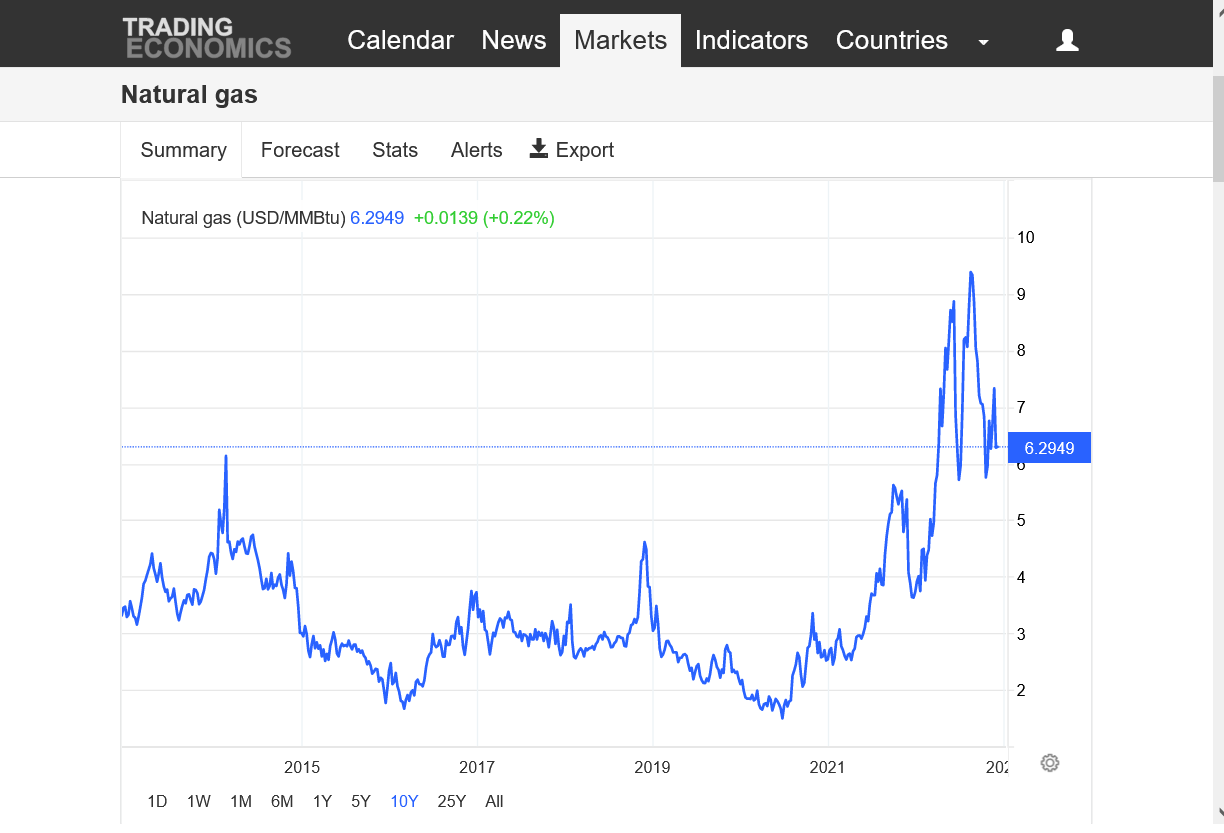
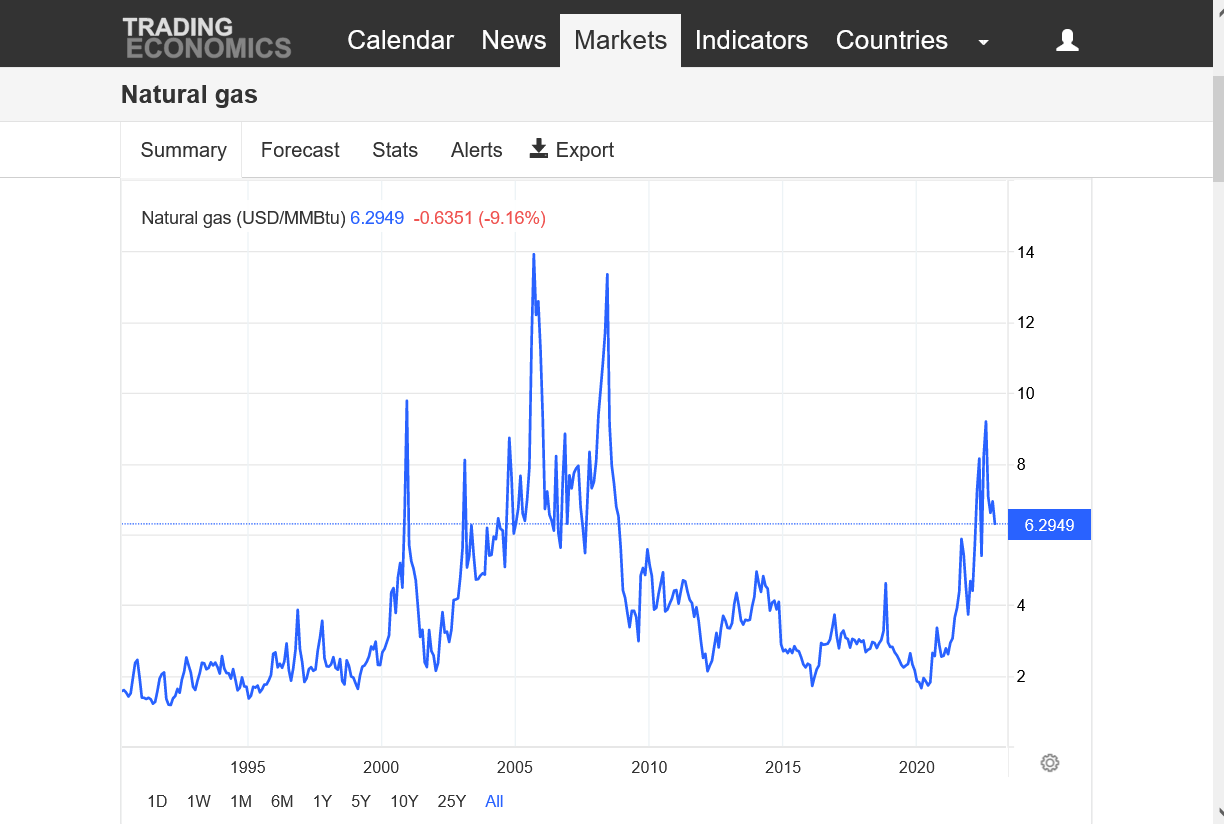
Something that only Larry can truly appreciate.
The last 18z run of the jumpy GFS operational model was -56 HDDs lower vs the previous run(left side below). I don't remember a change that great. The previous one was +40 HDDs which was about as extreme as it gets.
The issue is the extreme cold from cross polar flow flushing air from Siberia across most of Canada. At least the southern part of the frigid air mass will dump into the West to NorthCentral US and probably points southeast. The gradient is extreme between milder air in the East and the bone chilling cold. Changes in the steering currents in week 2 are resulting in adjustments to the location of the air mass that make a difference of 30+ degrees for some regions for numerous days. The ensemble means, as usual are showing more consistency.
The European, Canadian and CMC ensembles are not as cold as the 12z Friday which was the last model we traded. the GFS enemble is a bit colder than that but that 12z Friday GFS model was a mild fluke that spiked ng down $2,000/contract in a flash, $1,500 of it in 1 minute at 11:01am!!!

Hey Mike,
Yep, the ole jumpy wild and whacky GFS! That's extra crazy bat shoot insane! Thanks for posting that.
I'm going to start a new NG thread shortly.
Here it is: