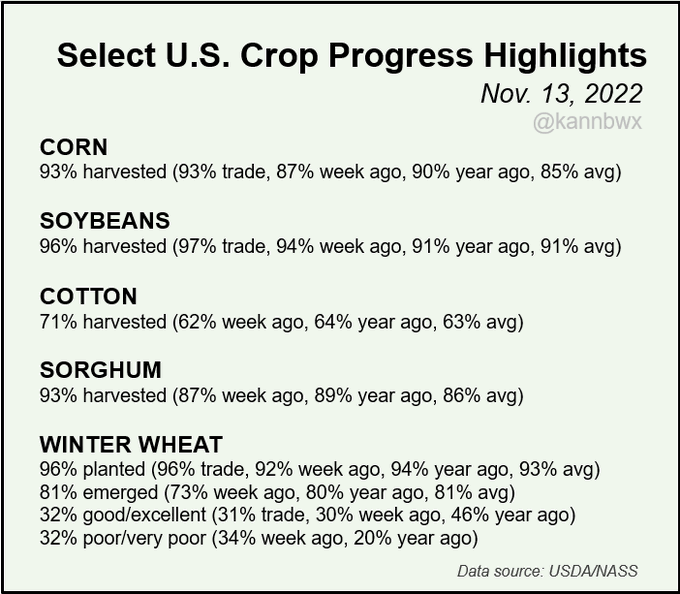
U.S. harvest 2022 is near completion with #corn & #soybeans still ahead of normal pace. 81% of winter #wheat has emerged and although the conditions have improved slightly, they are still very low historically. Crop has a long way to go.
++++++++++++++++++++++++
Complete reports here:
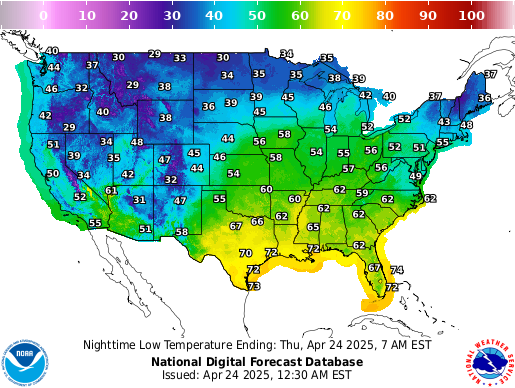
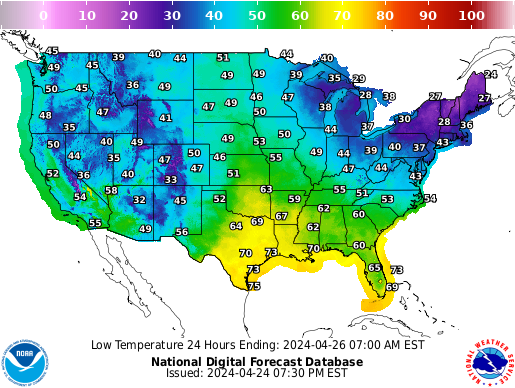
The Winter wheat crop is not dormant yet and getting hurt this week from record cold.
This is why wheat was so strong on Monday.
https://www.sunflower.k-state.edu/agronomy/wheat/winter_damage.html
Good top growth of wheat doesn't necessarily indicate good root development. Poor root development is a concern where conditions have been dry. Where wheat plants have a good crown root system and two or more tillers, they will tolerate the cold better. If plants are poorly developed going into winter, with very few secondary roots and no tillers, they will be more susceptible to winterkill or desiccation, especially when soils remain dry. Poor development of secondary roots may not be readily apparent unless the plants are pulled up and examined. If plants are poorly developed, it may be due to dry soils, poor seed-to-soil contact, very low pH, insect damage, or other causes.
+++++++++++++++++++++
https://ipad.fas.usda.gov/rssiws/al/us_cropprod.aspx
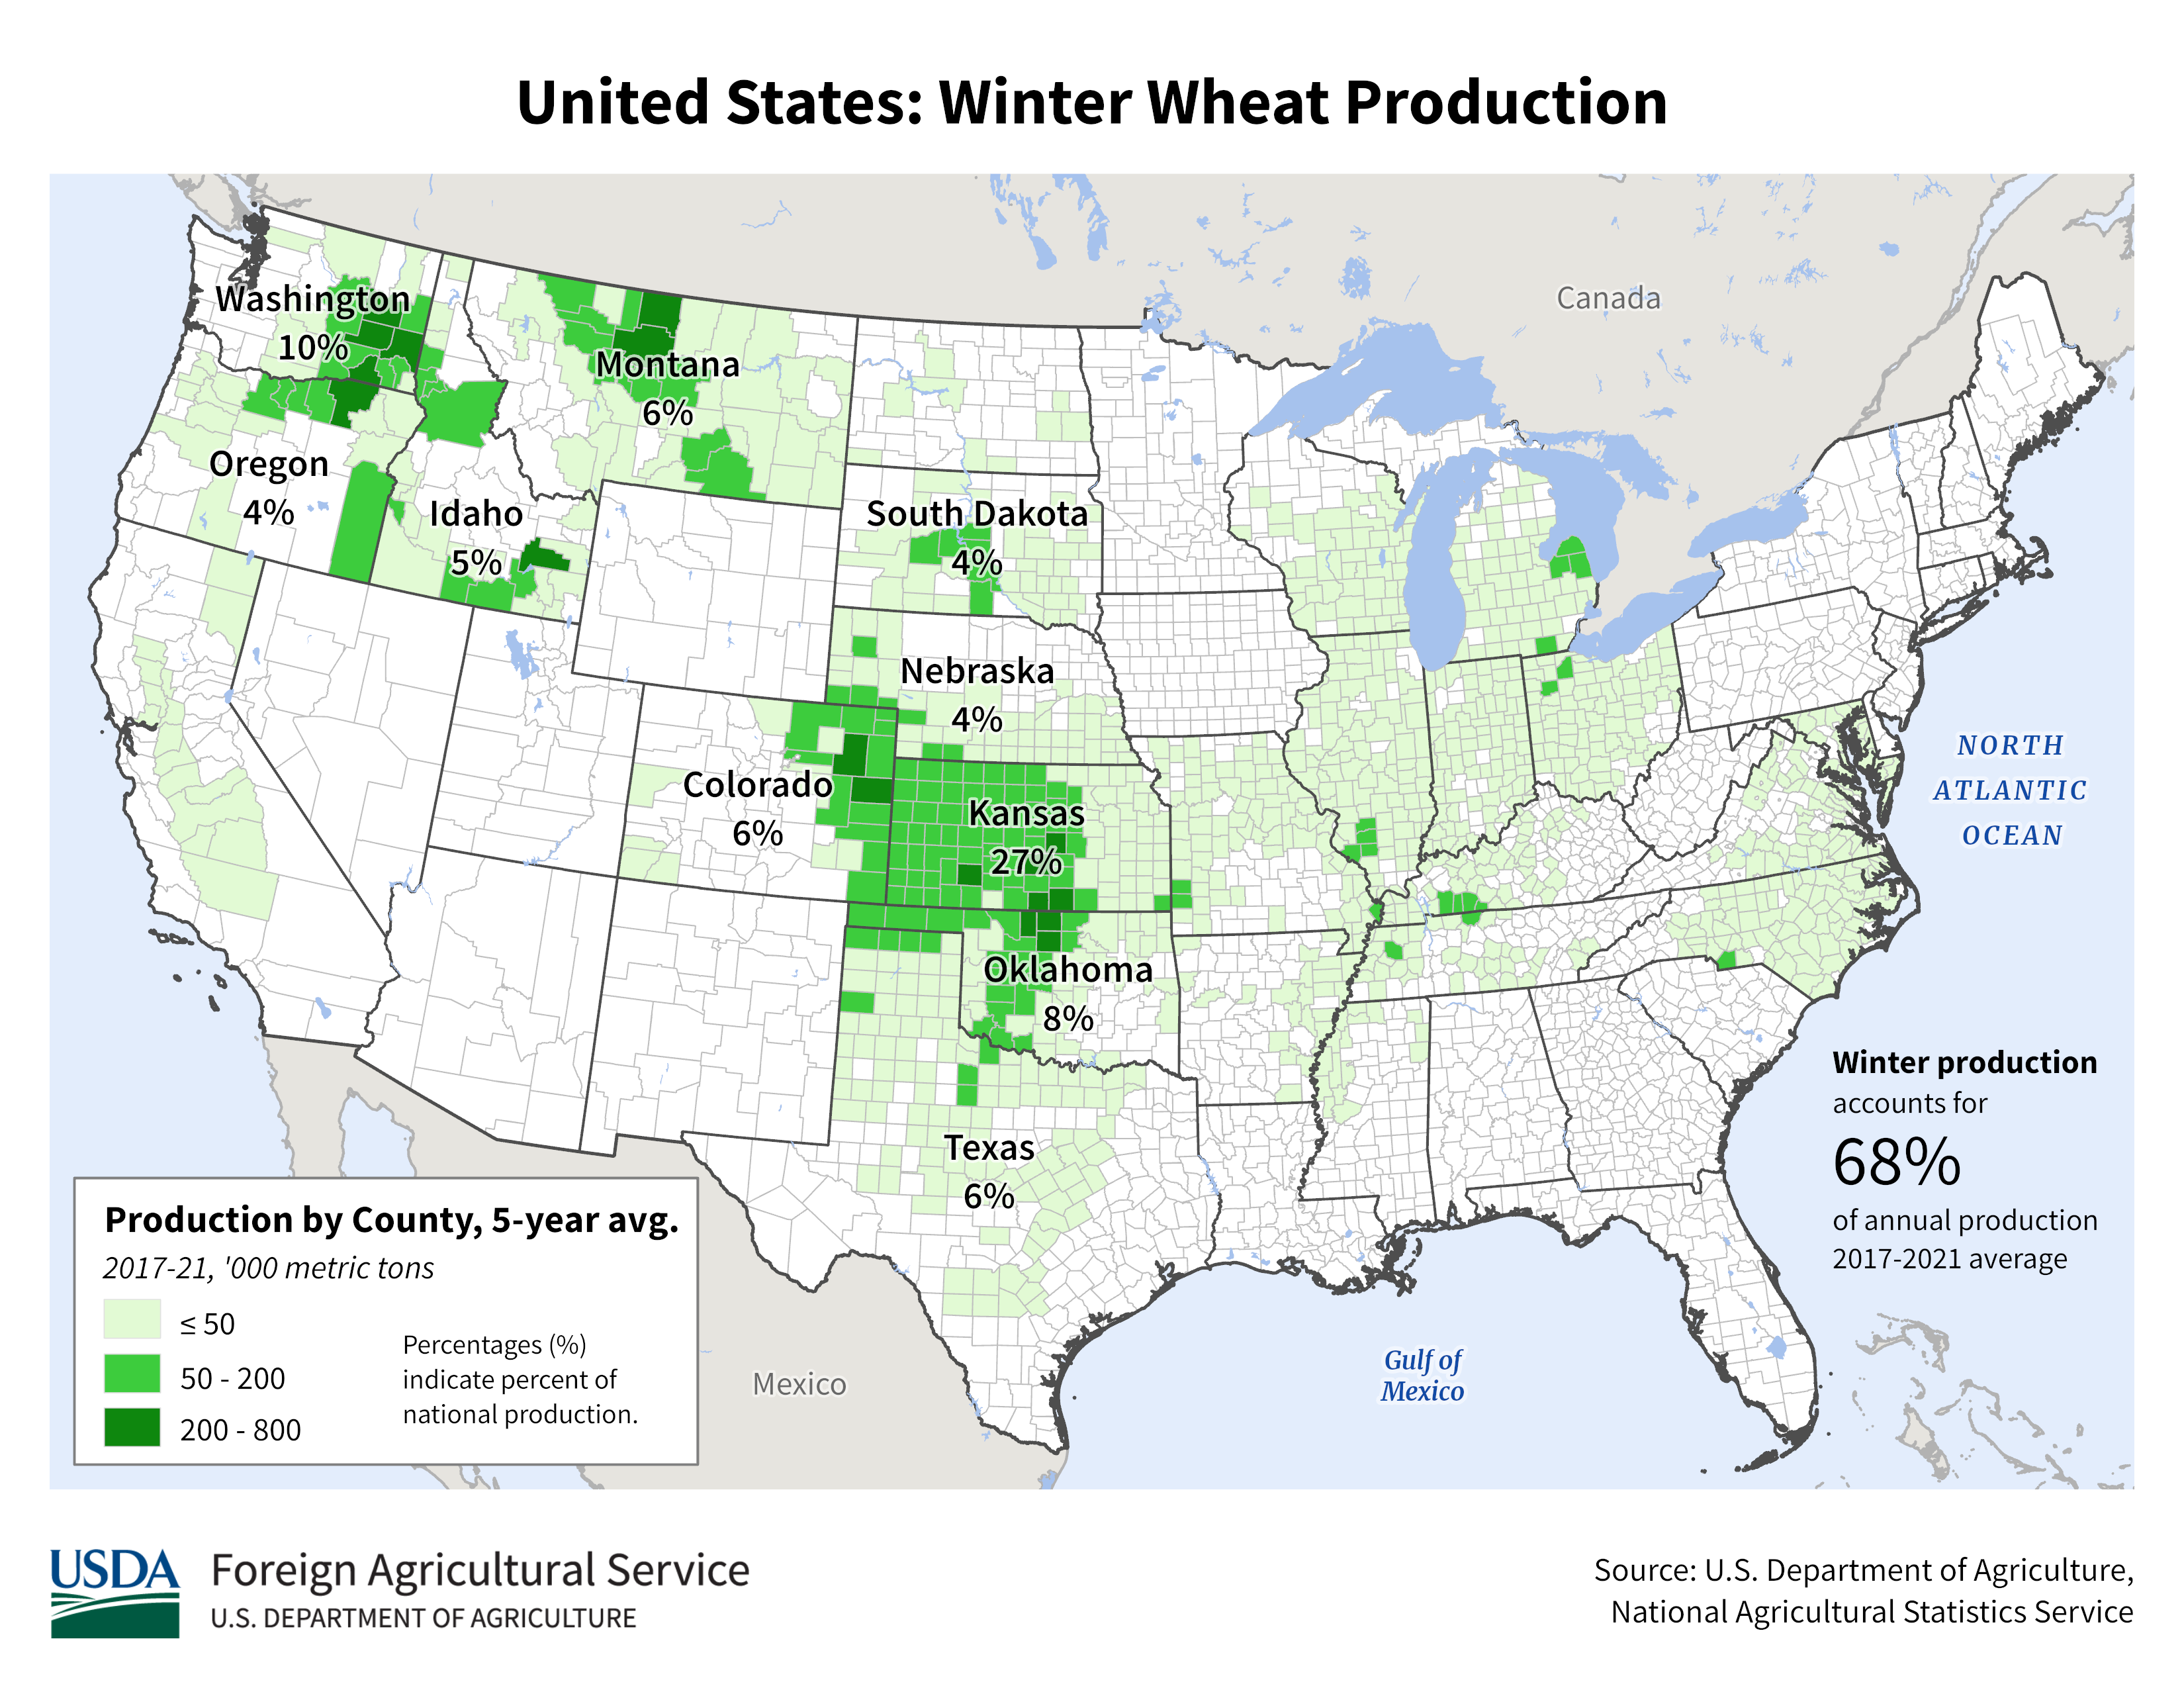
https://www.nass.usda.gov/Charts_and_Maps/graphics/WW-PR-RGBChor.pdf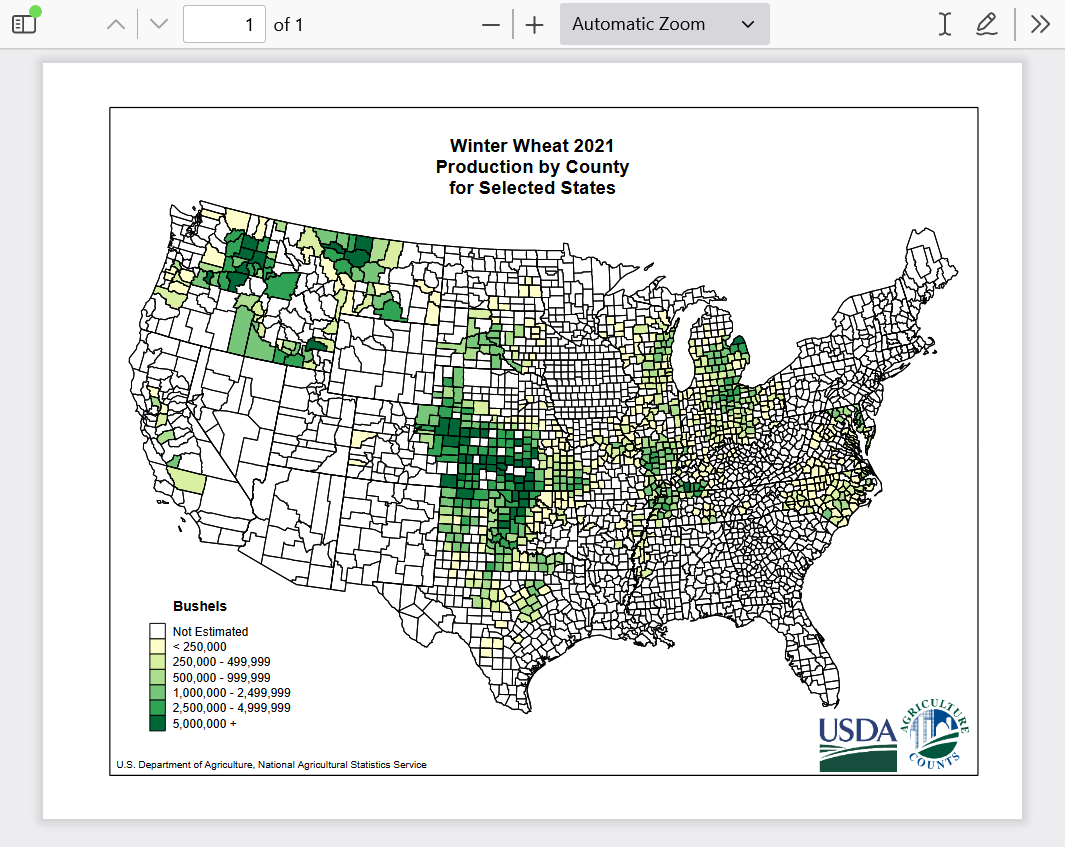
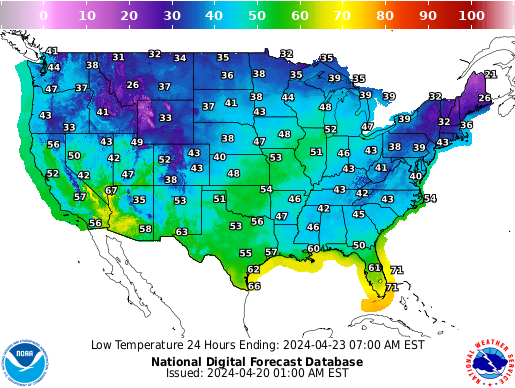
https://graphical.weather.gov/sectors/conus.php?element=T
Low temps night 1:
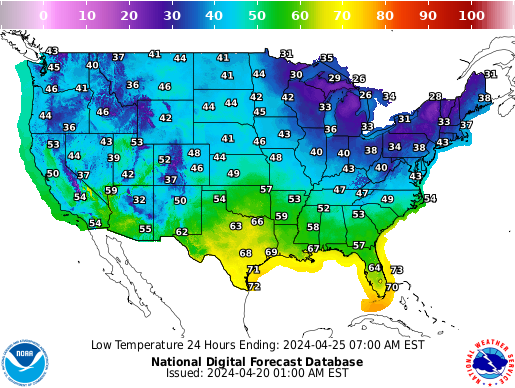
Low temps night 2:
Low temps night 3:

Low temps night 4:
Low temps night 5:

Low temps night 6:
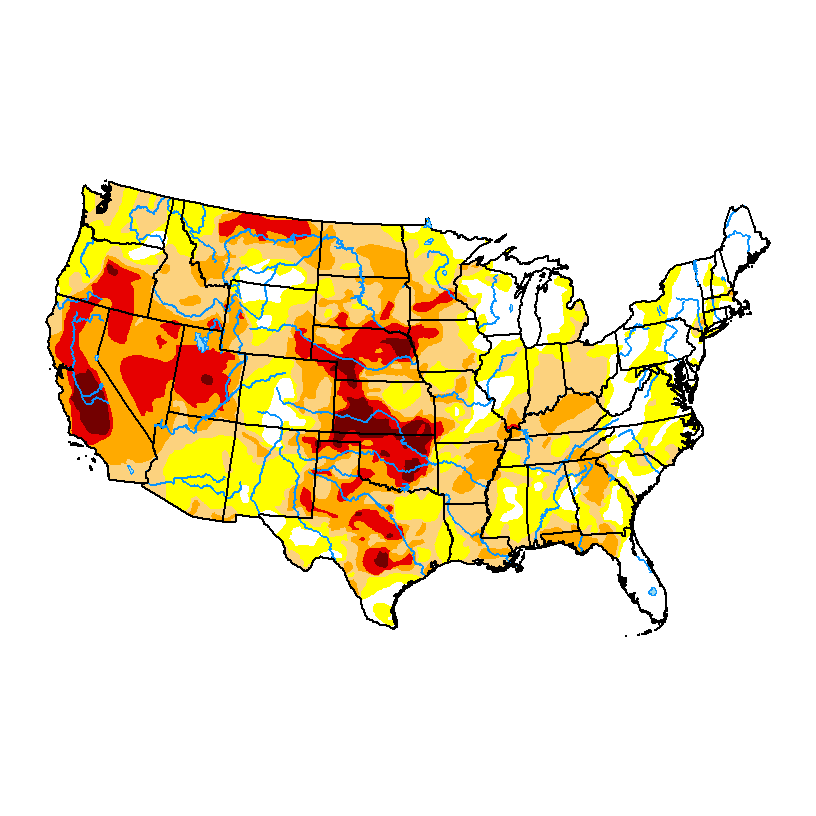
Soilmoisture anomaly:
These maps sometimes take a day to catch up to incorporate the latest data(the bottom map is only updated once a week).
https://www.cpc.ncep.noaa.gov/products/Soilmst_Monitoring/US/Soilmst/Soilmst.shtml#
![]()


++++++++++++++++++++++++++++
https://mrcc.purdue.edu/cliwatch/watch.htm#curMonths

November 8, 2022 Below
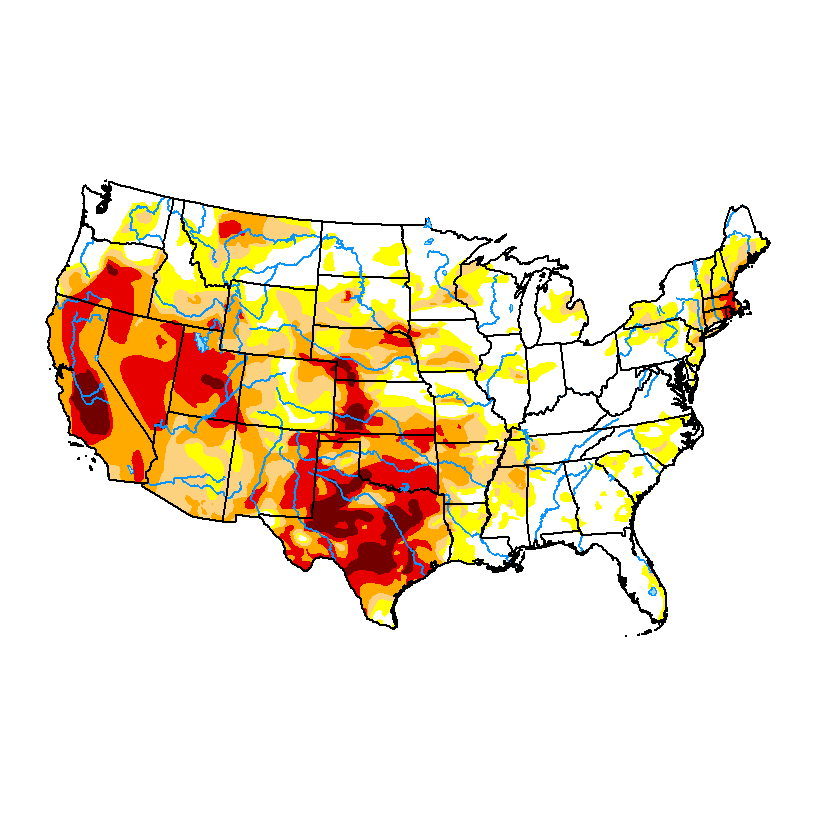
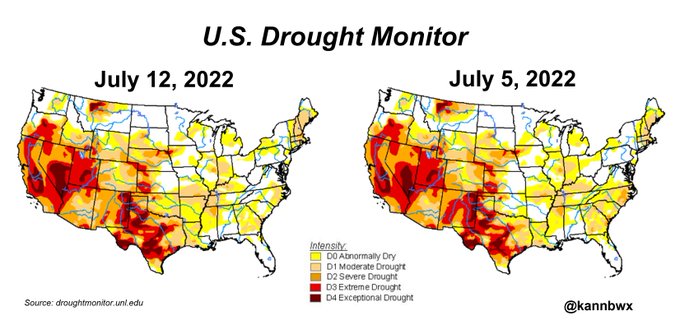
Drought worsening in some places!!
https://droughtmonitor.unl.edu/Maps/CompareTwoWeeks.aspx
AUGUST 16, 2022 BELOW
Drought monitor previous years:
The drought was not caused by climate change/global warming…..just the opposite.
its the result of the current, extremely long lived La Niña which is cold water anomalies in the tropical pacific. The opposite of a global warming pattern.
this is part of why global warming has paused the past 6 years
the best opportunity to end the drought will come from the slight, mostly beneficial warming resuming(with an El Nino, ideally) which caused the previous 3 decades of growing weather to be the best in the last 1,000 years.
add the beneficial CO2 during that time and growing conditions on the planet were the best since well before humans existed.
that’s why we’ve had massive global greening!
https://www.marketforum.com/forum/topic/69258/
La Nina conditions:
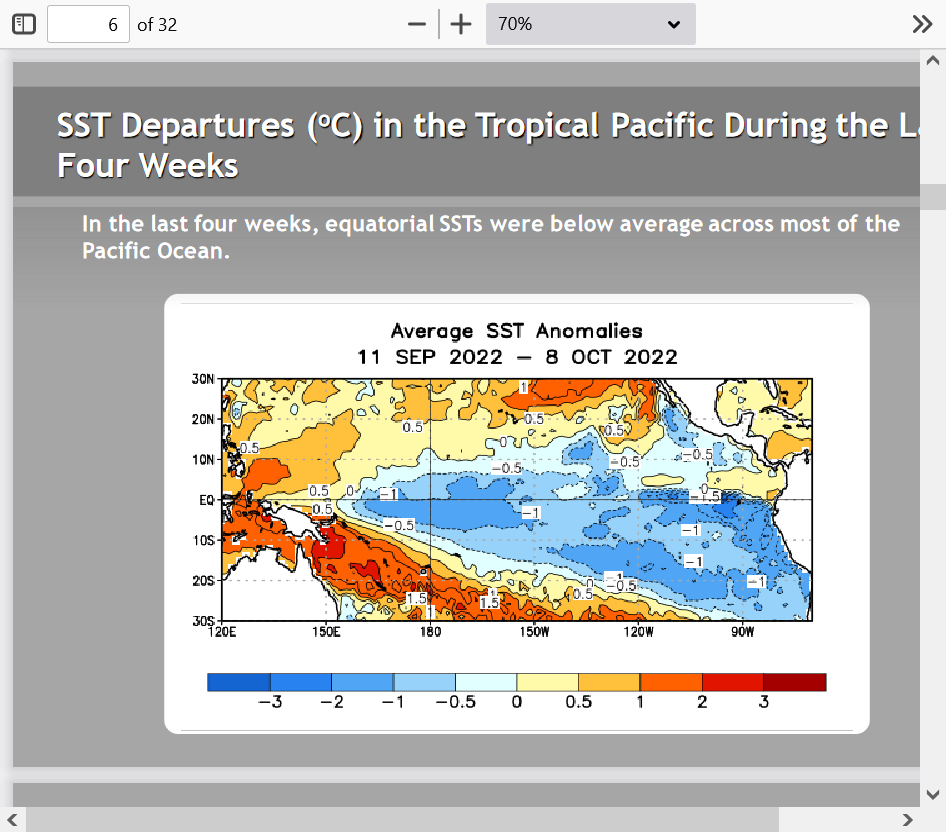
https://www.ospo.noaa.gov/Products/ocean/sst/anomaly/index.html

++++++++++++++++++++++++++++++++++++++
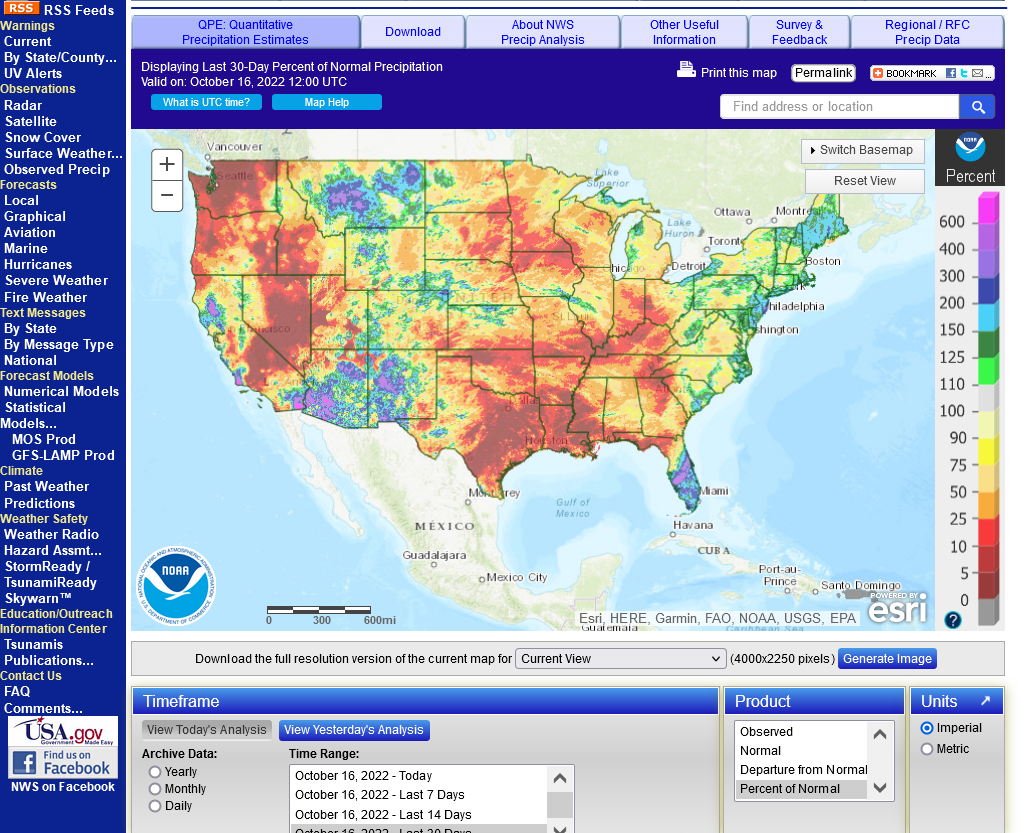
https://water.weather.gov/precip/
% Average of Rainfall the past 30 days
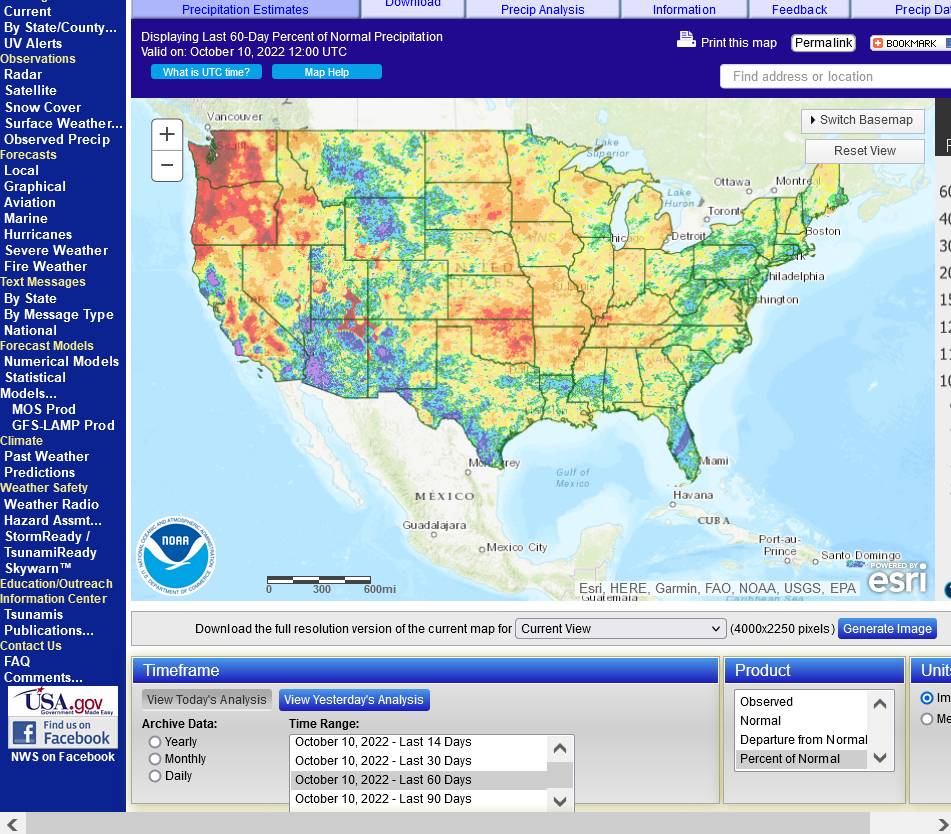
% Rain the past 60 days
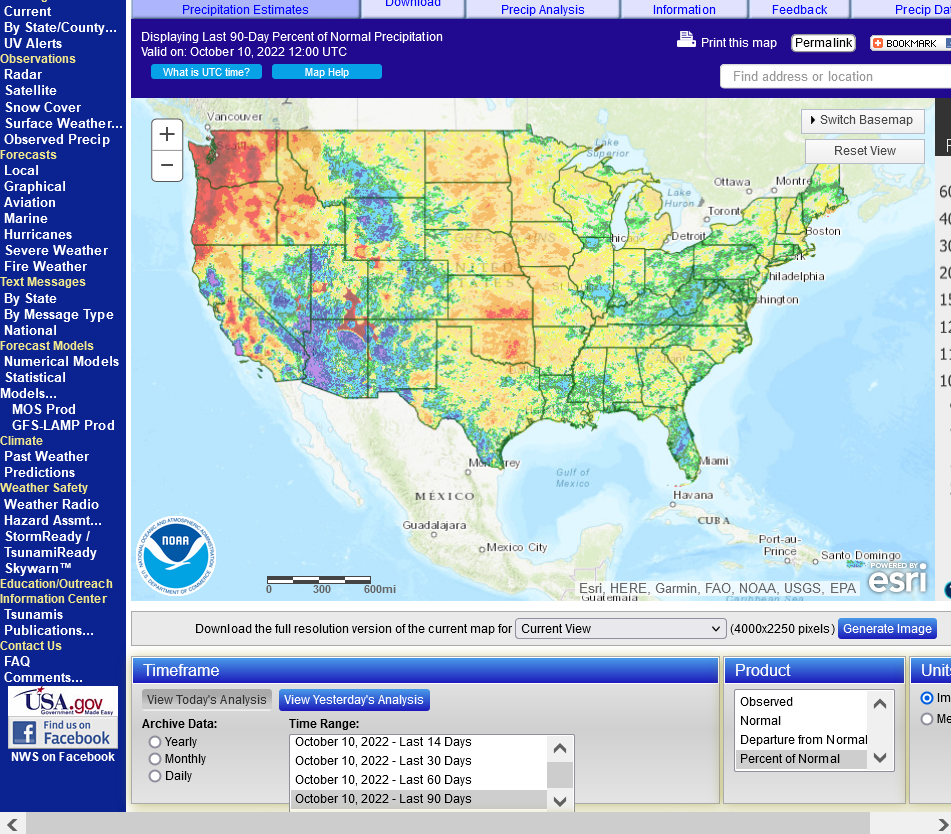
% Rain of Average the past 90 days
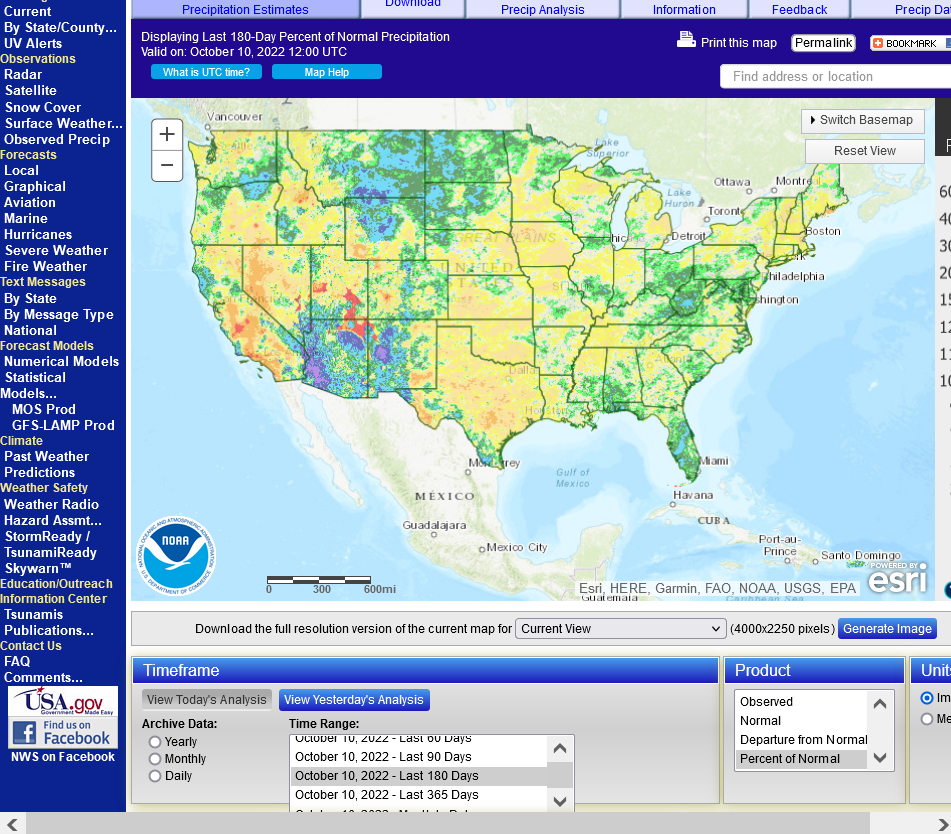
%Average of Rain the past 180 days
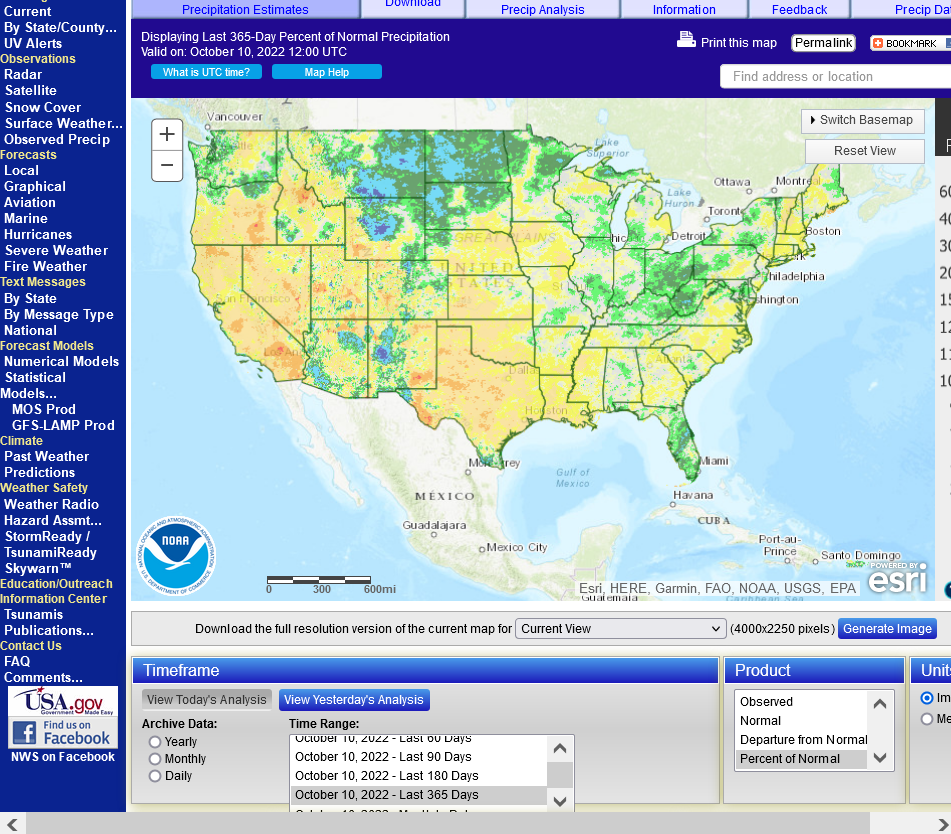
%Average Rain the past 365 days
Forecasts:
Day 1 below:
http://www.wpc.ncep.noaa.gov/qpf/fill_94qwbg.gif?1526306199054

Day 2 below:
http://www.wpc.ncep.noaa.gov/qpf/fill_98qwbg.gif?1528293750112

Day 3 below:
http://www.wpc.ncep.noaa.gov/qpf/fill_99qwbg.gif?1528293842764

Days 4-5 below:
http://www.wpc.ncep.noaa.gov/qpf/95ep48iwbg_fill.gif?1526306162

Days 6-7 below:
http://www.wpc.ncep.noaa.gov/qpf/97ep48iwbg_fill.gif?1526306162

7 Day Total precipitation below:
http://www.wpc.ncep.noaa.govcdx /qpf/p168i.gif?1530796126

Extended weather.
https://www.cpc.ncep.noaa.gov/products/predictions/610day/ | ||||||||
| 6 to 10 day outlooks | ||||||||
| Click below for information about how to read 6-10 day outlook maps Temperature Precipitation | ||||||||
| Click below for archives of past outlooks (data & graphics), historical analogs to todays forecast, and other formats of the 6-10 day outlooks ArchivesAnalogsLines-Only FormatGIS Data | ||||||||
Temperature Probability | ||||||||
Precipitation Probability | ||||||||
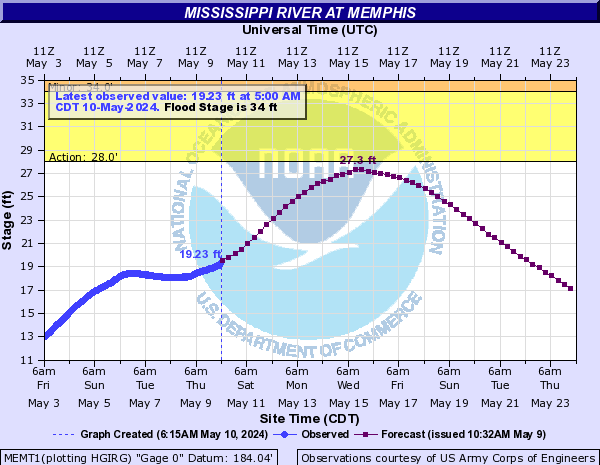
In addition, the dry weather has been causing the Mississippi River to experience very low levels but it's forecast to rise this week recent and falling precip.
https://www.wlox.com/2022/11/02/low-mississippi-river-levels-impact-state-national-economy/
https://water.weather.gov/ahps2/hydrograph.php?gage=memt1&wfo=meg


