Mike,
I think it is best to start a new wx thread due to the old one's extreme length.
Looking at the indices going into the first 10 days of December:
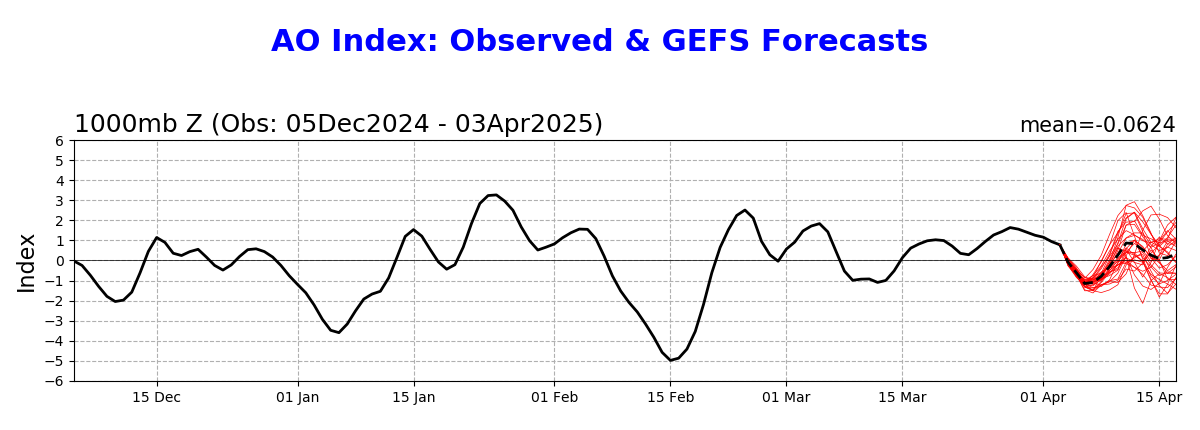
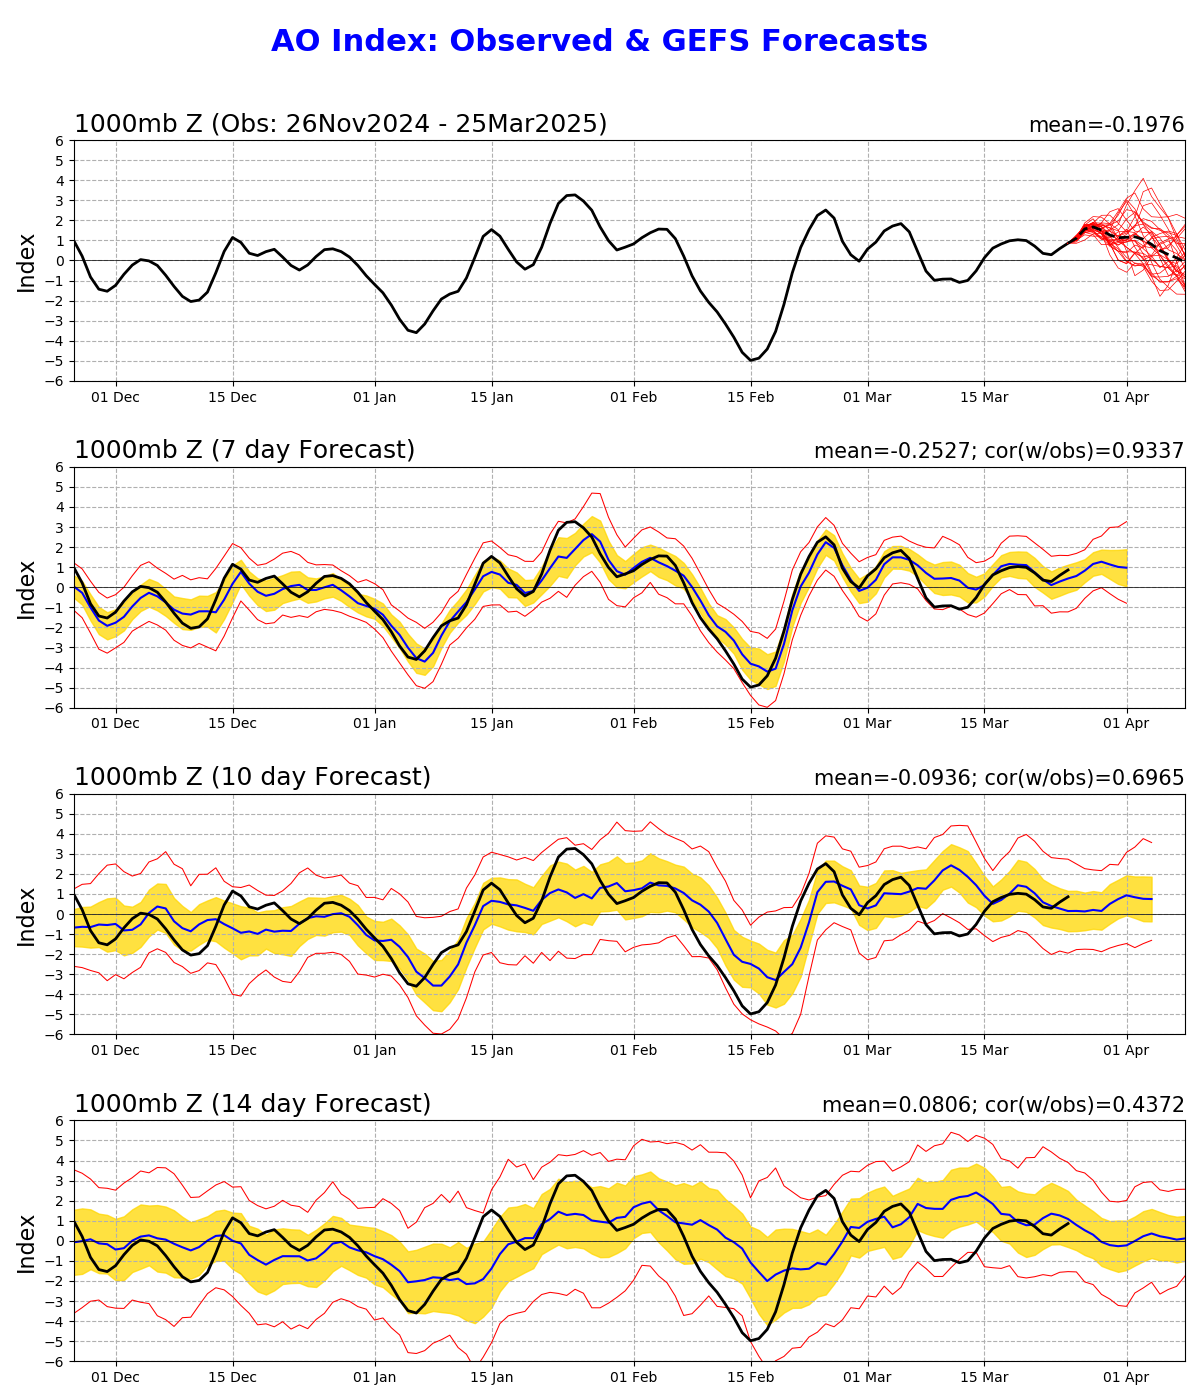
1) AO looking to plunge per 0Z 11/27/22 GEFS to very low levels (mean of -3 SD), which favors cold for much of the US. Here's the link to the latest 0Z GEFS based forecast (changes daily though):
https://www.cpc.ncep.noaa.gov/products/precip/CWlink/daily_ao_index/ao.gefs.sprd2.png
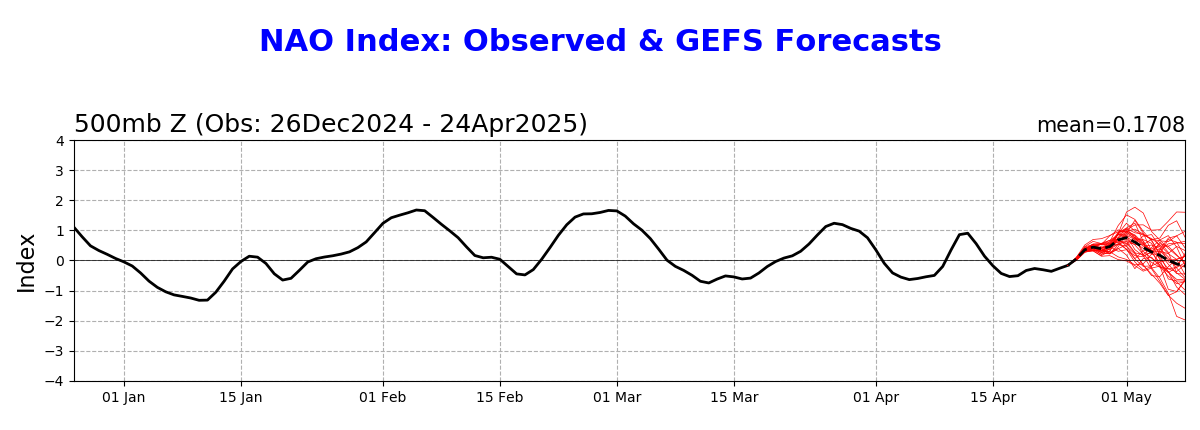
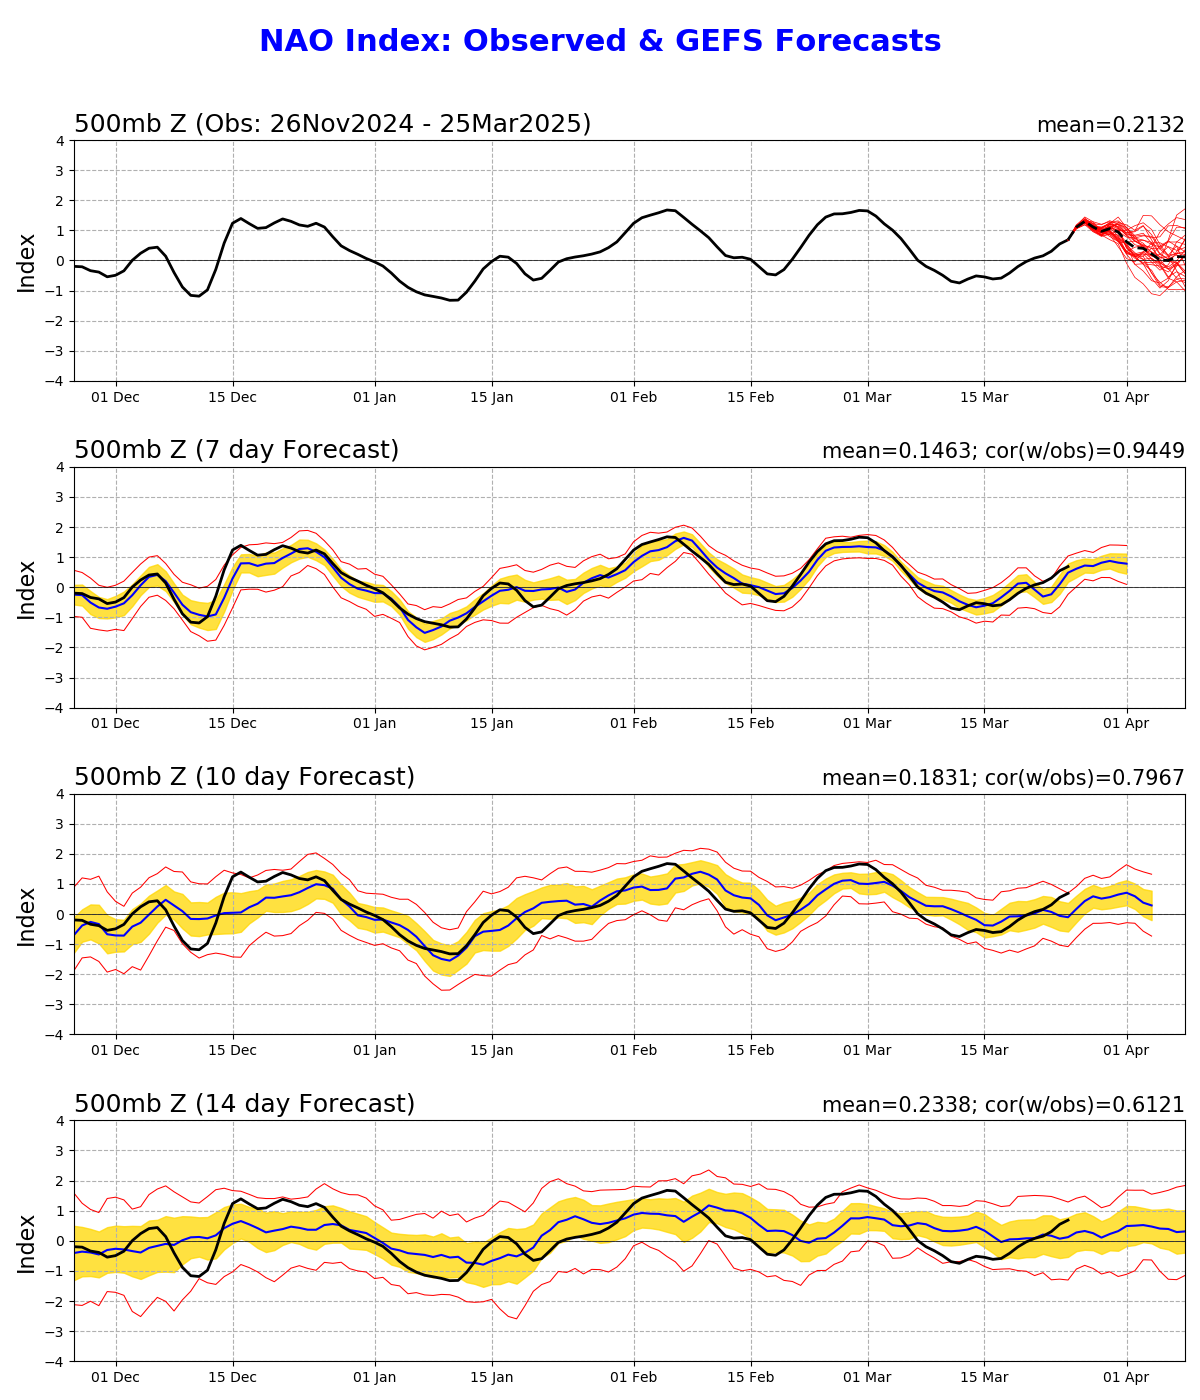
2) NAO looking to plunge per 0Z 11/27/22 GEFS to very low levels (mean of -1.5 SD), which favors cold for much of the E US, especially Midwest/NE):
https://www.cpc.ncep.noaa.gov/products/precip/CWlink/pna/nao.gefs.sprd2.png
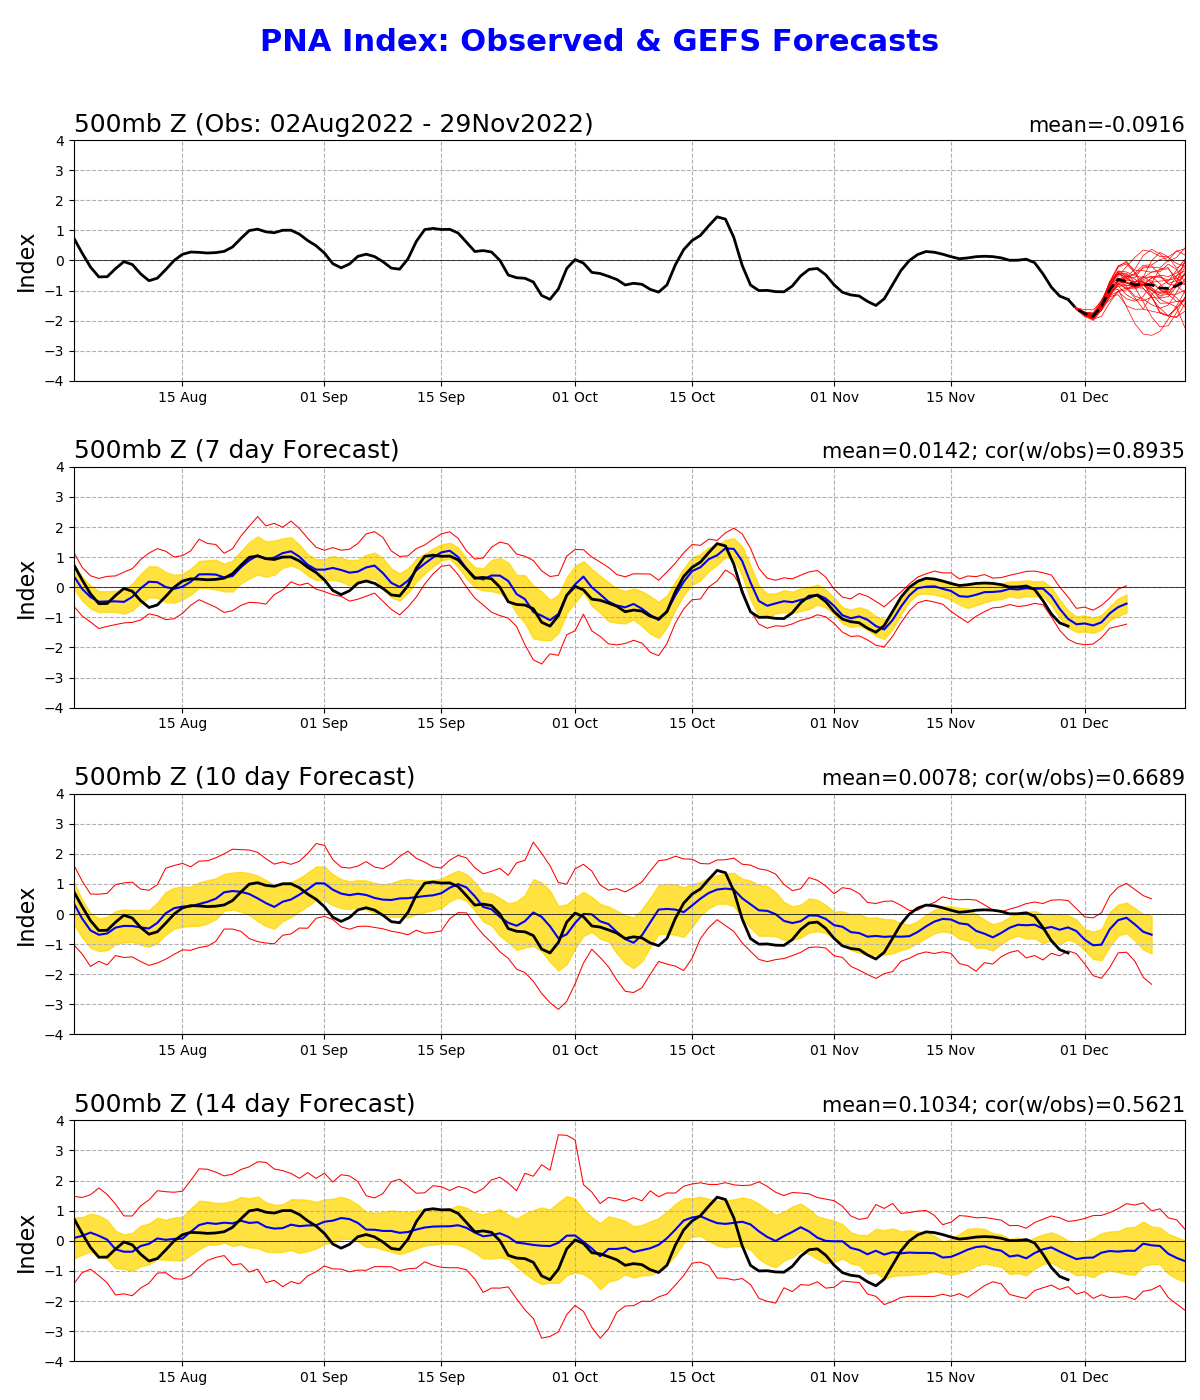
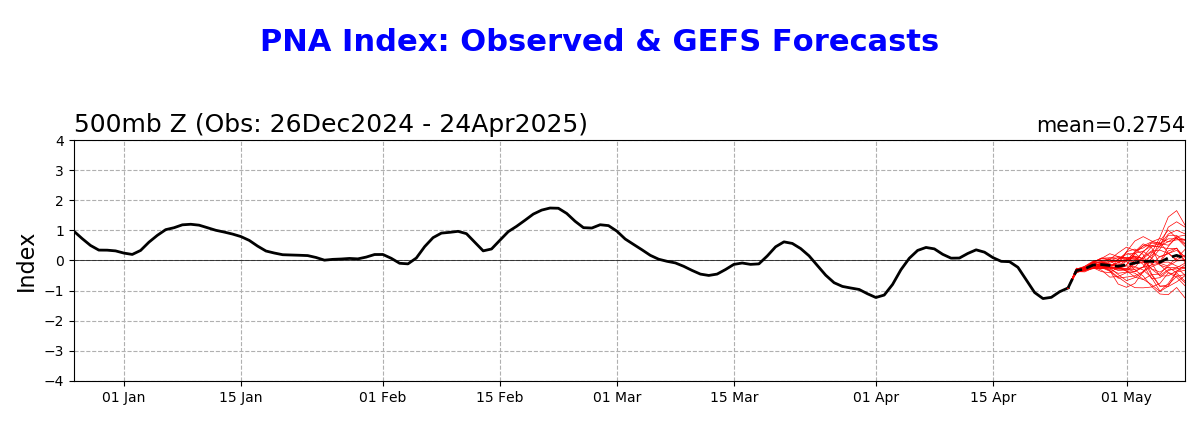
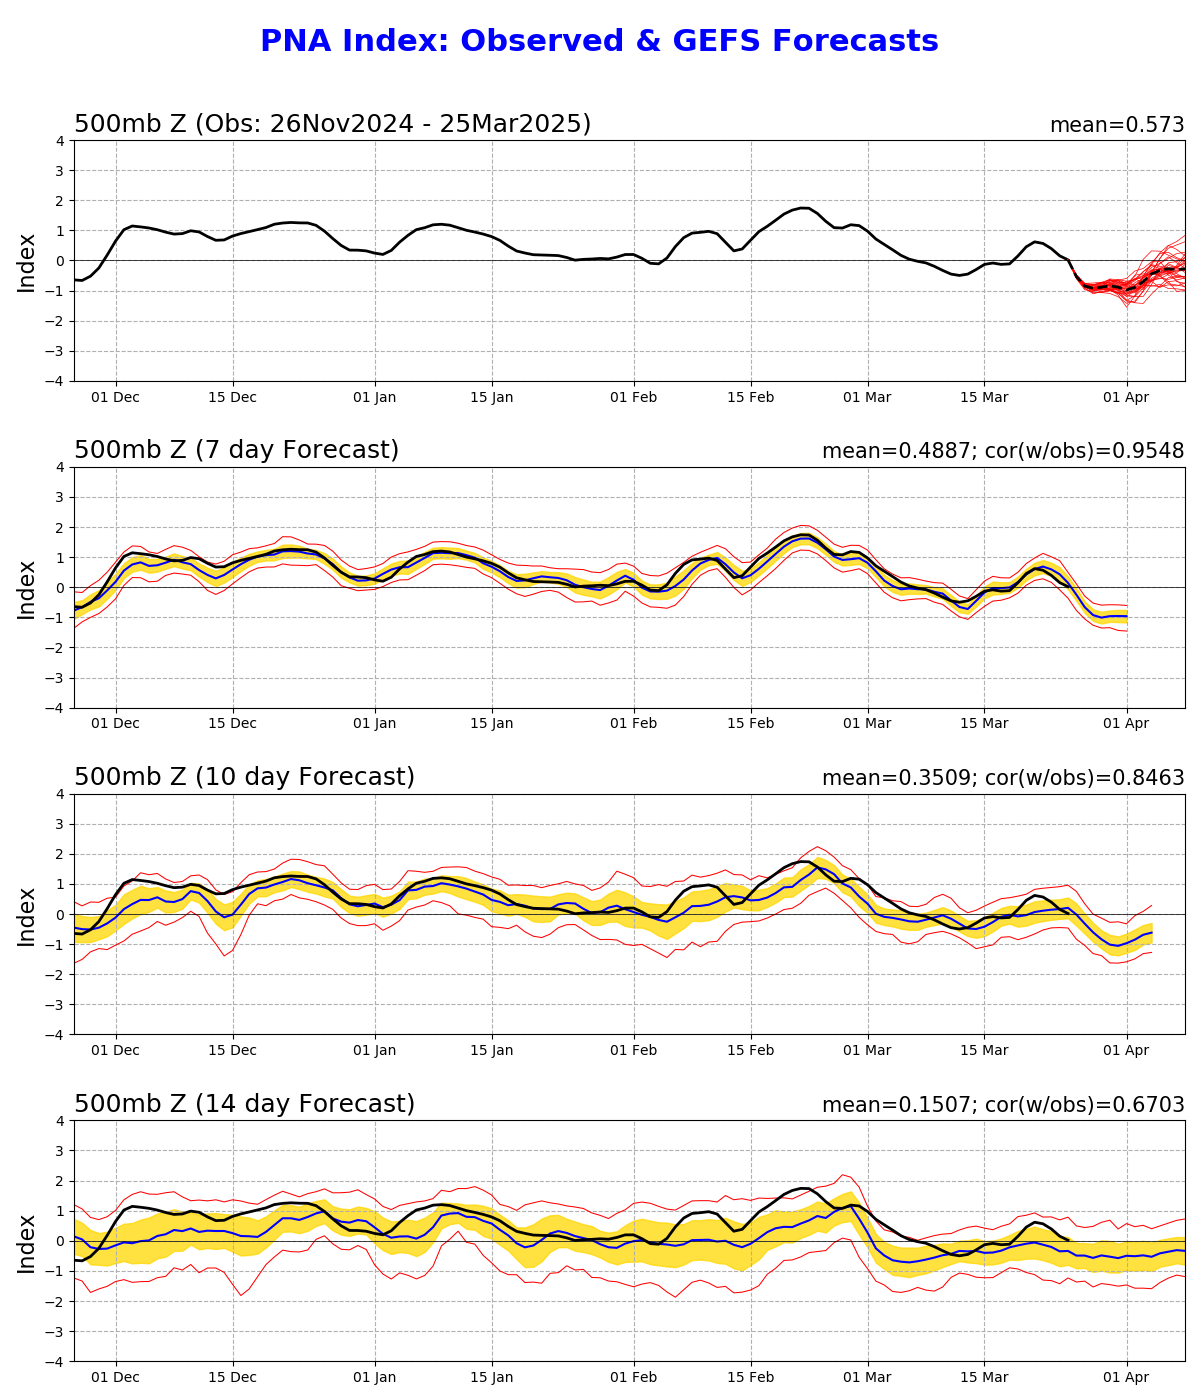
3) PNA starts off very low (sub -1), which favors cold in NW half of the US and mild in the SE half of the US due to a typical strong upper ridge near or just SE of Florida (aka SE ridge or "SER"). So, during that period, there's a conflict in much of the E US (especially lower Midwest, Mid Atlantic, and SE US) between the cold favoring strong -AO/-NAO and the mild favoring -PNA. So, there looks to be a battle then, especially in the lower Midwest to Mid Atlantic. The SE looks to not get into a cold dominating pattern then due to the SER favoring mild and thus fighting back the cold favored from the -AO/-NAO.
But by mid to late week two, the PNA is forecasted to rise to the slightly negative to nearly neutral range, which would significantly lessen the mild tendencies of the strong -PNA and its associated strong SER. So, by then, the lower Midwest to Mid Atlantic (most of the E US) would have a better chance for cold to dominate. The battleground would then shift to the deep SE US/Florida. With it being La Niña, it isn't easy for the SE to get cold due to a typically dominant SER. But that's just a tendency.
Here's the link to the latest 0Z GEFS based PNA forecast (changes daily though):
https://www.cpc.ncep.noaa.gov/products/precip/CWlink/pna/pna.gefs.sprd2.png
Thanks much, Larry!
I agree with the extreme length of the other one. Easily a record length of posts and many of the posts had multiple links/maps.
Weather May-November 2022
103 responses |
Started by metmike - April 30, 2022, 8:01 p.
https://www.marketforum.com/forum/topic/83844/
I've actually been using it as an extremely effective way to brief myself on all the weather updates for conditions and forecasts for every period that gets automatically updated around the clock at one side.
There are dozens of main links and maps that are located on that same thread. I just scroll thru them several times a day, instead of going to dozens of separate links to get each source individually.
Often, I ignore numerous maps to get to the more important ones that day. You brought up the NAO, AO and PNA.
At the other thread, I just scroll down to that page(s) in a few seconds and have that.
During severe weather.........the radars and surface obs and Severe Storm Forecast maps.
But I agree with you. It's a very bad dynamic for conversation/comments which is what a forum is all about. Scrolling down thru 200 maps to see a new comment is way too long.
There hasn't been a heck of a lot of demand for pure weather discussions outside of you recently, so I was not changing it.
We(me) are here to serve YOU and everybody else though and this was a great idea to help do that.
Very much appreciated.
As you noted above and me at the last post on the mile long thread, the solidly negative AO and NAO look pretty bullish for cold,
There’s a moderate chance of tornadoes in the south today with a few possibly being the most violent, long track high end type.
more on that later this morning
https://www.marketforum.com/forum/topic/91095/
the other weather thread has all the maps.
on NG weather, there’s a huge disparity on models regarding how long the upcoming cold will last
6z GEFS was a whopping +19 HDDs. This caused extremely volatile, up and down action with willing sellers on new highs and buyers on new lows in NG.
The 12z model came out with -5 HDDS vs the 6z model but more than the previous ones.
With me still in the cold camp because of the -AO and -NAO but lets face it, the NG just does not want to go higher here and there are numerous model solutions that like a NON bullish pattern late in week and only a brief intrusion of the major cold, then mild, zonal flow.
If those solutions are correct, $7+ is too expensive with NG supplies still gushing in and us having gained back much of the deficit in storage during the refill season.
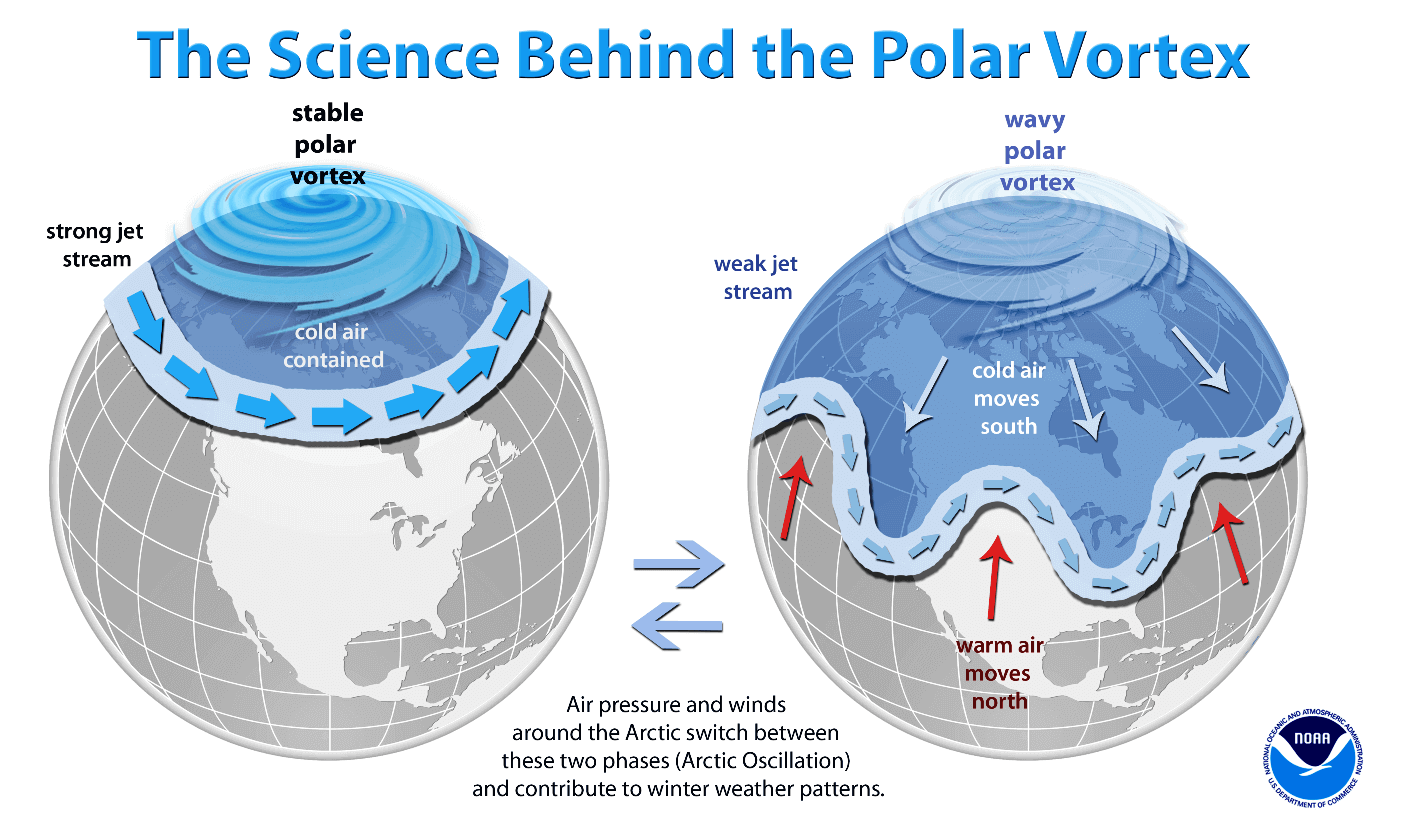
Eric Snodgrass mentions weak polar vortex with this high latitude blocking pattern. Potential for it to be dislodged and shift unusually far south.
https://www.youtube.com/watch?v=g9SDK_14Kfg
Main weather from Eric......he's the best! 11-28-22
https://www.youtube.com/watch?v=c-oCNc8kUhw
11-29-22 Morning update:
++++++++
As Winter begins, a major blocking pattern emerges over the Northern Hemisphere. High-pressure systems will push into the polar regions, creating a series of weather changes. The circulation will be disrupted, releasing colder air from the north and creating an actual split of the lower Polar Vortex.
++++++++++++++++++
December will start with a continued double-blocking weather pattern. Both high-pressure systems will press further into the polar regions. The low-pressure area over North America will bring down cold air across the United States, and a cold wave will spread over central and northern Europe.
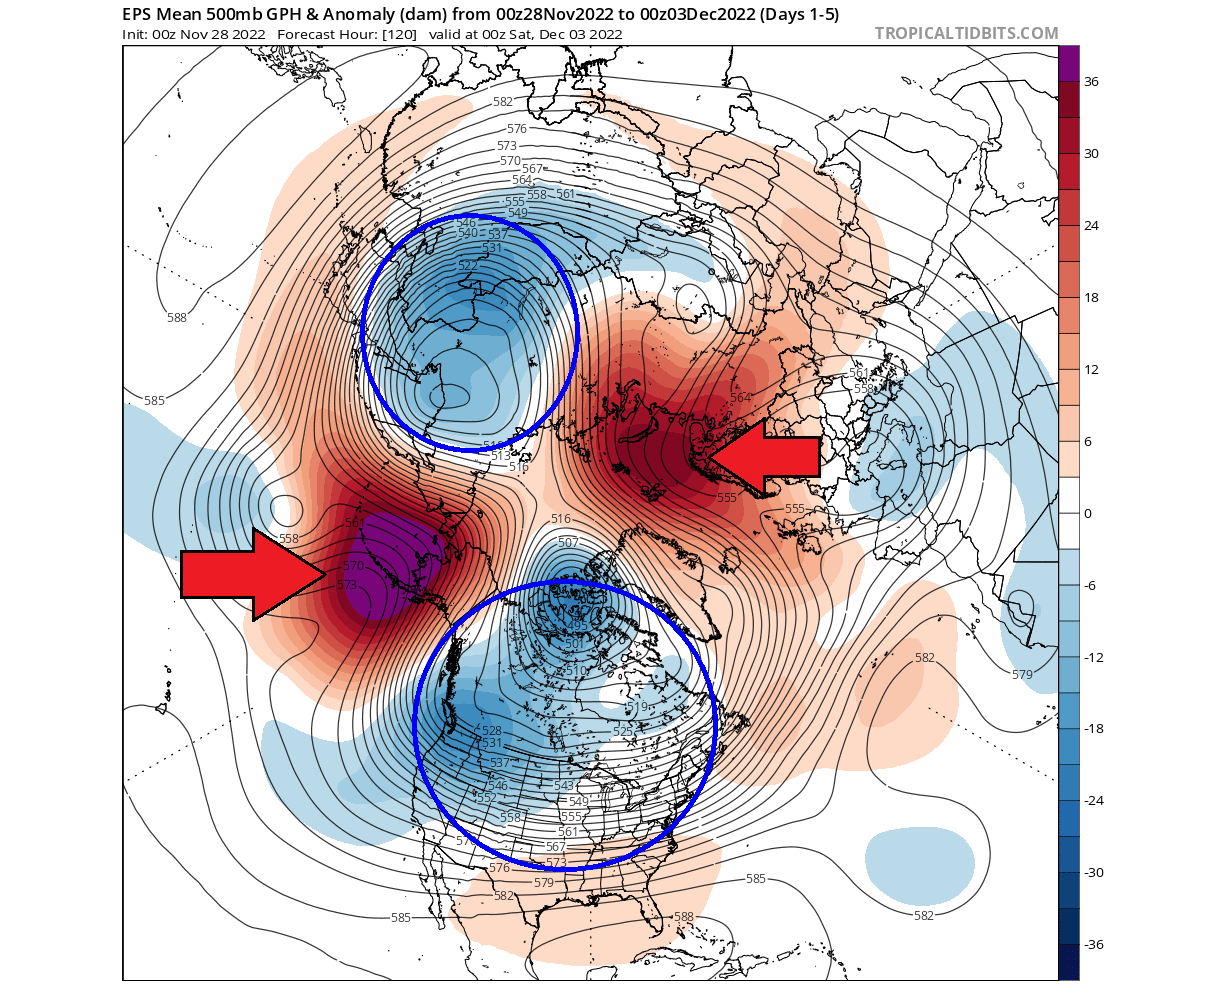
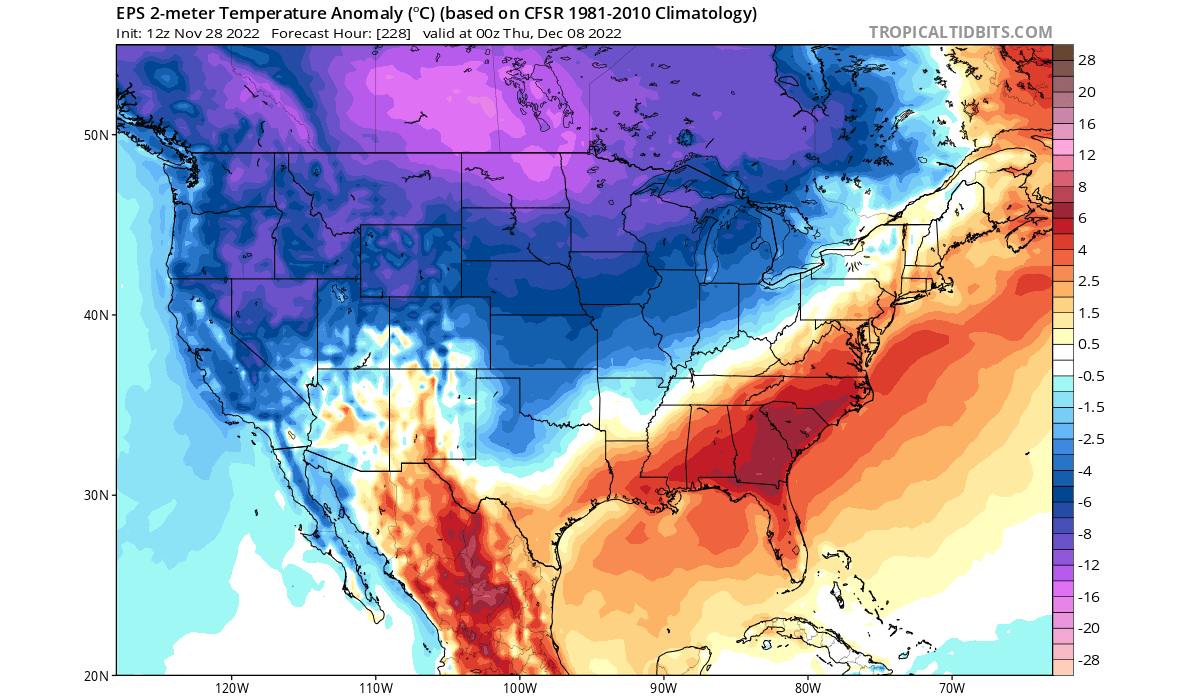
Looking at the temperatures, we can see the cold wave over Europe. But notice the strong warm anomalies reaching into the Arctic circle, pushing the cold air out into Siberia and especially into western Canada and the northern United States.

Looking closer at the United States and southern Canada, you can see the cold wave spreading across the eastern United States. The cold air is sourced from southwestern Canada, first into the Midwest and then further towards the south and southwest.
+++++++++++++++++++++++
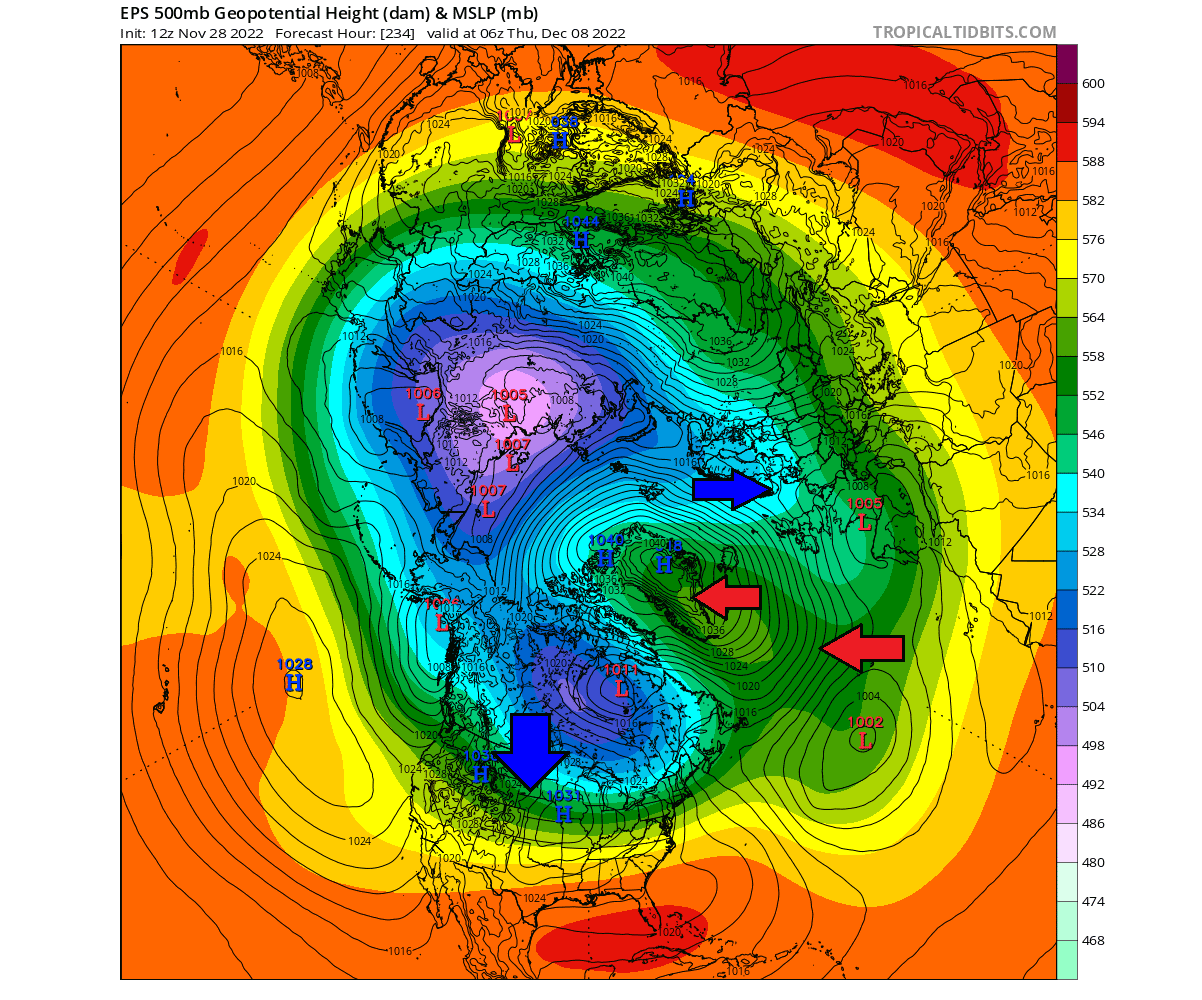
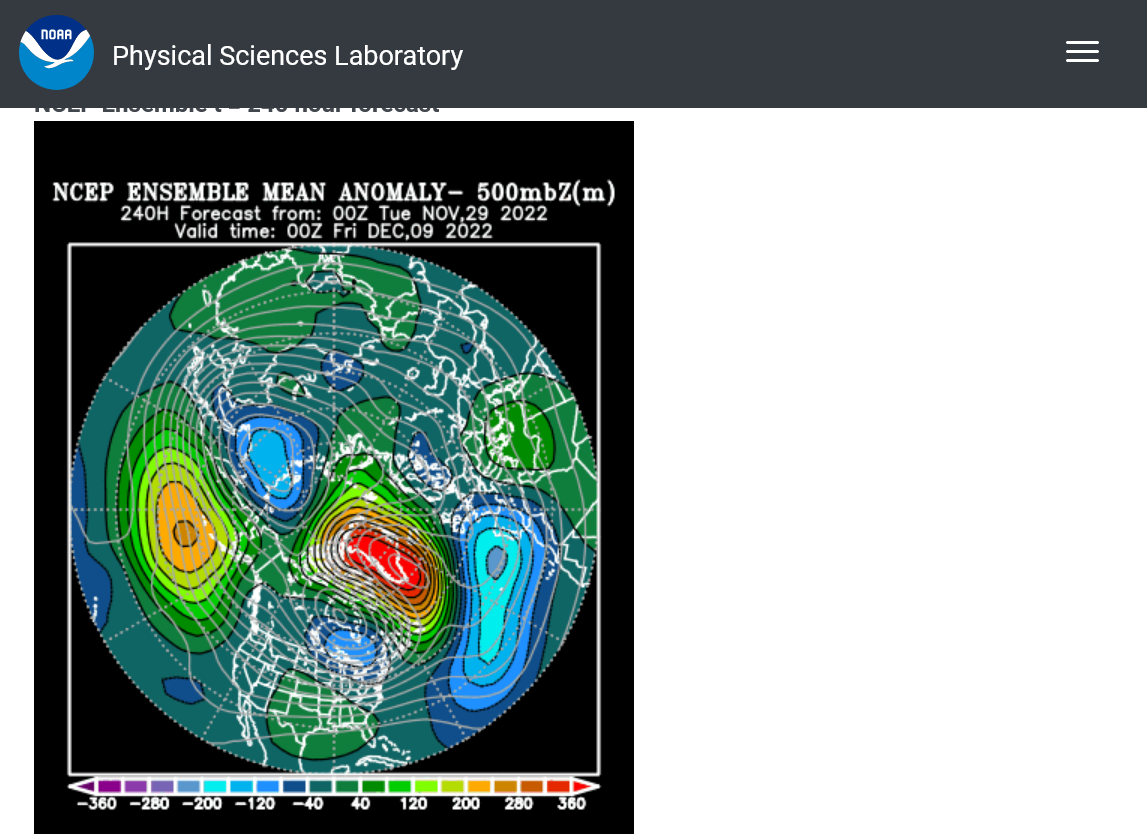
But the strong high-pressure anomalies are also growing in vertical influence and will start to compress the stratospheric Polar Vortex. The image below shows the Polar Vortex at the 50mb pressure level (19km/12miles) in the lower Stratosphere. Notice the effect of the two blocking systems, having a compressing effect all the way upwards into the Stratosphere.

Looking at the raw geopotential height, you can see just how strongly the Greenland blocking-high pushes into the polar circulation. It transports warmer air along, displacing cold air out into northern Europe and the northern United States.
You can see that even better in the temperature anomaly pattern, with warm anomalies rising into Greenland. Colder air is forecast over northern Europe, with strong cold air pooling over western Canada and the northern United States.
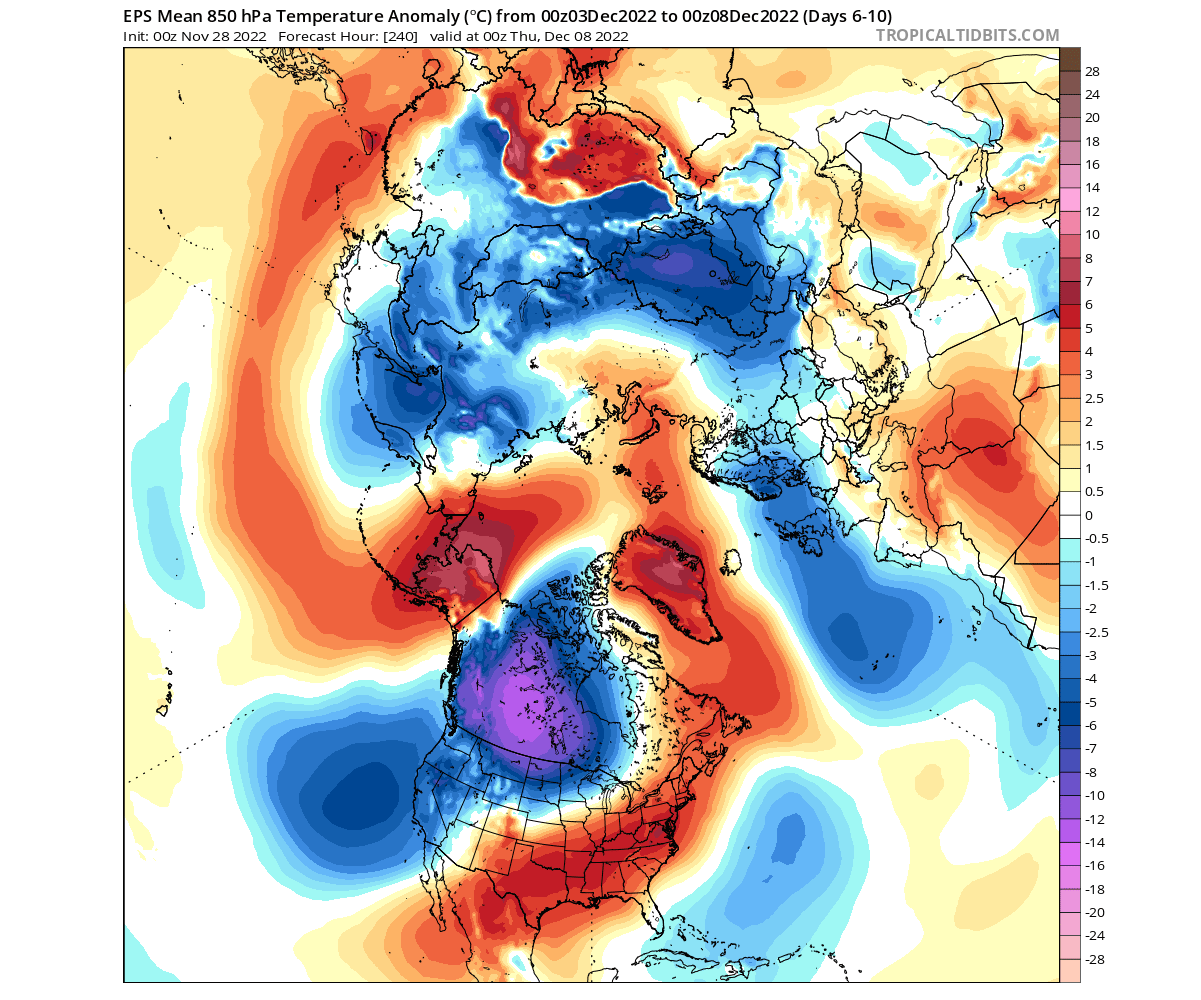
Looking closer at the cold air over North America, the forecast shows another cold air wave spreading across much of the central and northern United States in this period. Warmer than normal weather will prevail over the southeast and up the east coast.

++++++++++++++++++++++

Enough with the preamble, let’s get to the outlook! As noted above, CPC favors a similar temperature pattern taking shape this winter as they forecast before the last two winters.

I'm surprised with a strong high level block aka extreme positive anomalies in the higher latitudes, that the extended forecast and models aren't even colder than this.
https://www.psl.noaa.gov/map/images/ens/z500anom_nh_alltimes.html
Extended weather.
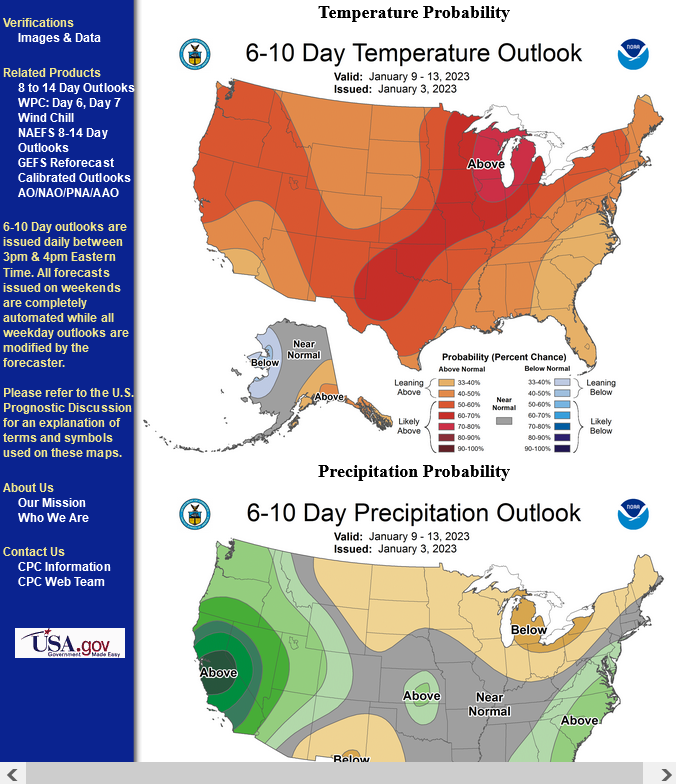
https://www.cpc.ncep.noaa.gov/products/predictions/610day/ | |||||||
| 6 to 10 day outlooks | |||||||
| Click below for information about how to read 6-10 day outlook maps Temperature Precipitation | |||||||
| Click below for archives of past outlooks (data & graphics), historical analogs to todays forecast, and other formats of the 6-10 day outlooks ArchivesAnalogsLines-Only FormatGIS Data | |||||||
Temperature Probability | |||||||
| Precipitation Probability | |||||||
| |||||||
Mike said: "I'm surprised with a strong high level block aka extreme positive anomalies in the higher latitudes, that the extended forecast and models aren't even colder than this."
-------------------------------------------------------------------------------------------
Hey Mike,
I understand your surprise. Is it because the forecasted continuation of the rather strong -PNA is keeping the forecast from being colder in the SE 1/2 of the US? Are the models wrong? Are they not allowing for enough influence from the strong -NAO/-AO to counteract the -PNA? Will the models come in colder later?
PNA correlation to 2m temps in Dec:
PNA forecast (from GEFS 0Z 11/29/22 run):
Larry,
You nailed it exactly!
It's the battle between these 2 streams for control of temps.
The northern stream dictated by the -NAO/-AO and the Pacific stream by the PNA. As you mentioned, a -PNA features a stronger Pacific, west to east, sw to ne flow downstream that OPPOSES or DEFLECTS the north to south push from the northern stream.
A +PNA tends to have a north to south component downstream which ASSISTS a -AO/-NAO in transporting air from the high latitudes to the middle latitudes.
I noted you pointing out the importance of the PNA from the get go in this thread too.
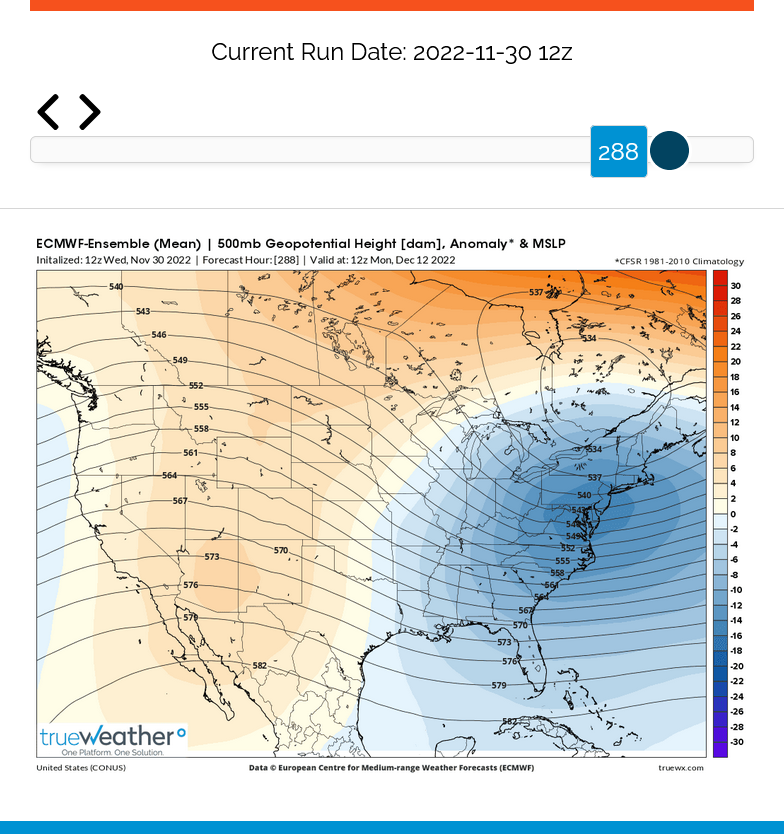
Note that today's 12Z EE is even more emphatic about the possibility of the establishment of a +PNA around December 12th than was yesterday's 12Z (although today's 0Z had gone away from yesterday's 12Z. Let's see if a trend of EE runs toward a +PNA towards midmonth gets established.
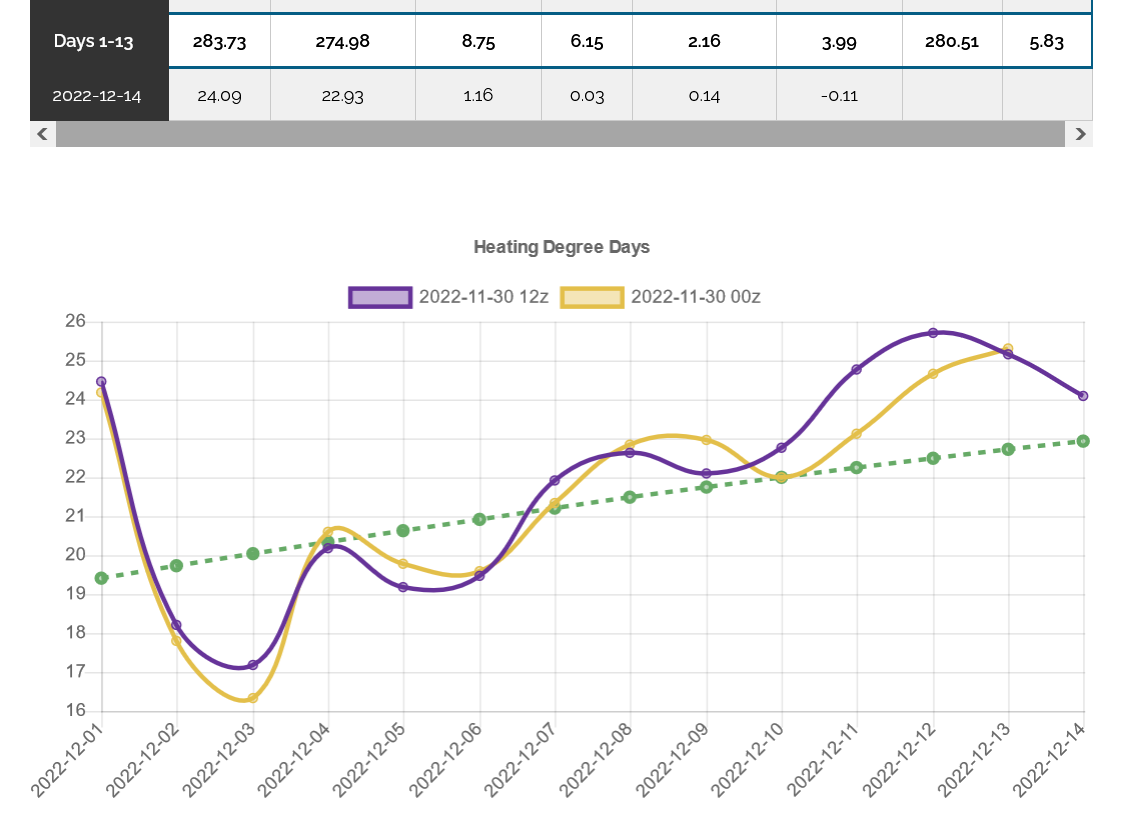
Exactly why the 12z EE was +10 HDDs, all from the final 5 days in the 2 week forecast!
https://www.marketforum.com/forum/topic/83844/#83856
Arctic Oscillation Index, North Atlantic Oscillation Index, Pacific North American Index.
https://www.cpc.ncep.noaa.gov/products/precip/CWlink/daily_ao_index/ao.shtml
https://www.cpc.ncep.noaa.gov/products/precip/CWlink/pna/nao.shtml
https://www.cpc.ncep.noaa.gov/products/precip/CWlink/pna/pna.shtml
++++++++++++++++++++++++++++++++++++++++++++
GFS ensemble mean anomalies at 2 weeks.
https://www.psl.noaa.gov/map/images/ens/z500anom_nh_alltimes.html
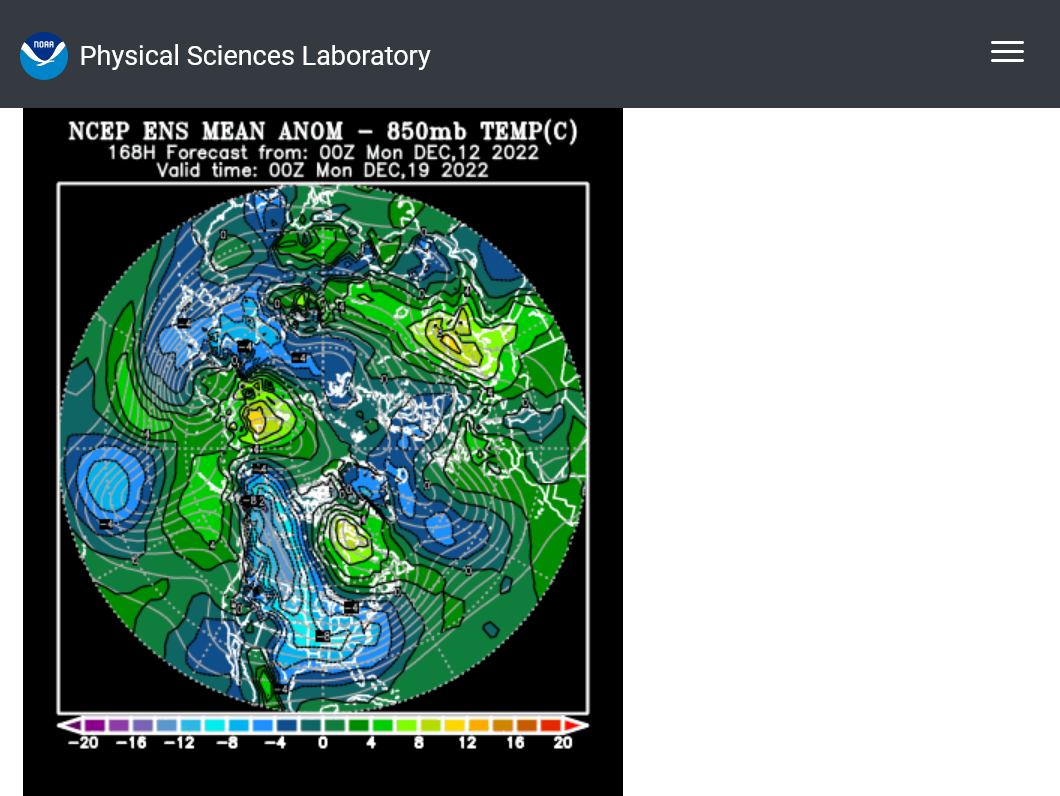
2 week 850 temp for ensemble mean anomaly
https://www.psl.noaa.gov/map/images/ens/t850anom_nh_alltimes.html
I continue to believe the models and solutions are not cold enough for this particular high latitude blocking pattern, especially in the east.
It's extremely difficult to keep the very heavy/dense cold air in the high latitudes from moving from north to south, bodily from the high latitudes to the mid latitudes with this pattern!
What do you think, Larry?
Hey Mike,
Great question! I don't have an answer at least yet, but I like to look at analogs to give me clues. Consider this for the NAO:
Per the 0Z 11/30/22 GEFS run, the first half of December is forecasted to have an average NAO of near -1.1. That would by a good margin be the strongest -NAO in the first half of December since 2010. Looking back to 1950, here are the strongest -NAOs for the first half of December:
1. 1963: -1.5
2. 2009: -1.3
3. 2010: -1.2
4-6. 1977, 1989, 1995: -1.1
7. 2002: -1.0
The remainder since 1950 are -0.8 or weaker.
So, based on today's GEFS, 2022 is looking to be at about tied for 4th with 1977, 1989, and 1995 for the strongest -NAO for the first half of December since 1950. Only 2010, 2009, and 1963 were stronger than this forecast and there's a slight chance that it could reach 2010's strength.
Daily NAO data since 1950:
https://ftp.cpc.ncep.noaa.gov/cwlinks/norm.daily.nao.cdas.z500.19500101_current.csv
Since 1963 and 2009 were during El Niño, 2022 is aiming to be tied for 2nd for the strongest non-Nino -NAO in the first half of December since 1950 (behind only 2010). The only La Niña in this list of strong -NAOs in the first half of December are 2010 and 1995.
To try to answer your question, you or I (if either of us gets the time) can look back at the average temperature in the US during 12/1-15 for each of these 7 years and perhaps give more weight to the La Niña years of 2010 and 1995.
Unbelievably great work, Larry!
I'm so glad that you started this new weather thread to stimulate conversation/discussion about weather.
Believe it or not, I remember December 1989 extremely well!!!
It's why I decided to start trading commodities. I was on television back then and forecasting weather using the limited tools. No NAO, AO or PNA back then.
The drought of 1988 first tuned me in and got me interested, then the coldest December in history causing heating oil prices to shoot thru the roof clinched it.....especially since I'd recognized the pattern weeks before it hit using pattern recognition not weather models........that only went out for 72 hours back then.
The pipes also froze under the house we were living in as temps stayed below 0 F for several consecutive days.
Here's something I just did:
So, are these not so cold models right in the E US? Or are they underestimating the cold potential of the forecasted -1.1 NAO for 12/1-15? Which is more likely? I don't know but consider this for RDU's 12/1-15 temperature anomalies for the seven years since 1950 with a -NAO of -1 or stronger:
1963: very cold -7
1977: cold -5
1989: very cold -7
1995: cool -2
2002: very cold -9
2009: cool -2
2010: very cold -12
*Average: cold -6
*None were mild. All were colder than normal with 5 of 7 cold to very cold.
RDU data:
More great work Larry!
I also need to finish this thread:
https://www.marketforum.com/forum/topic/90490/#90583
Then in 1989 we had a record cold December and the news headlines often discussed heating oil prices spiking higher from cold that I'd predicted many days(weeks) earlier.
The 12z GEFS was 0 HDDs vs 6z and +4 HDDs vs the 0z.
The 12z EE was +3.5 HDDs vs the 0z which has caused the bounce in the last 30 minutes with it entirely coming from days 10-11-12.
That was from a much deeper, cutoff low in far SE Canada with a trough extending all the way down the East Coast (from the -NAO).
+++++++++++++++++++
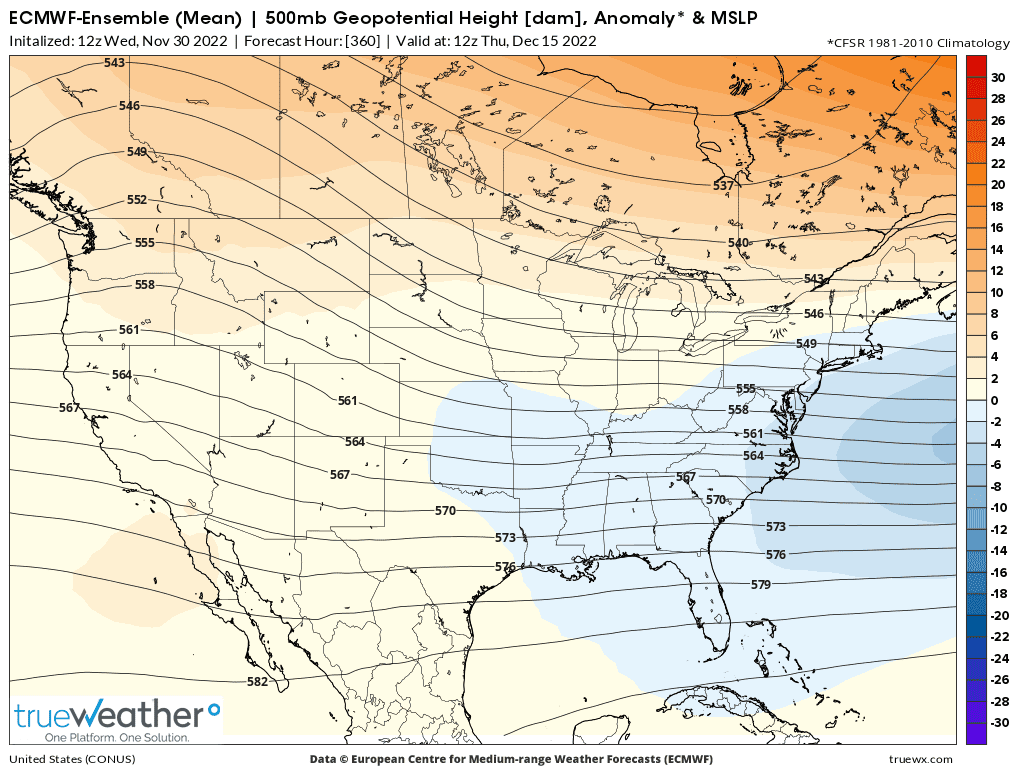
But look how quickly the magnitude of the negative anomalies weakens by day 15/360 hours. Still a cold pattern and strong -NAO and and actually a +PNA pattern!
The GEFS is more zonal than this.
Who would have thought that NG would be down sharply with an EE solution Like this. Been saying NG wasn’t acting right for the amount of cold all week.
Guidance today keeps the block but wants to send much of the cold over to the other side of the N. Hemisphere later in week 2.
in fact, it looks like NC to E Canada might have near record warmth so air masses coming from there that are usually very cold in December, might not be that cold With this odd pattern.
https://www.marketforum.com/forum/topic/91060/#91148
Such an extraordinarily unusual pattern.
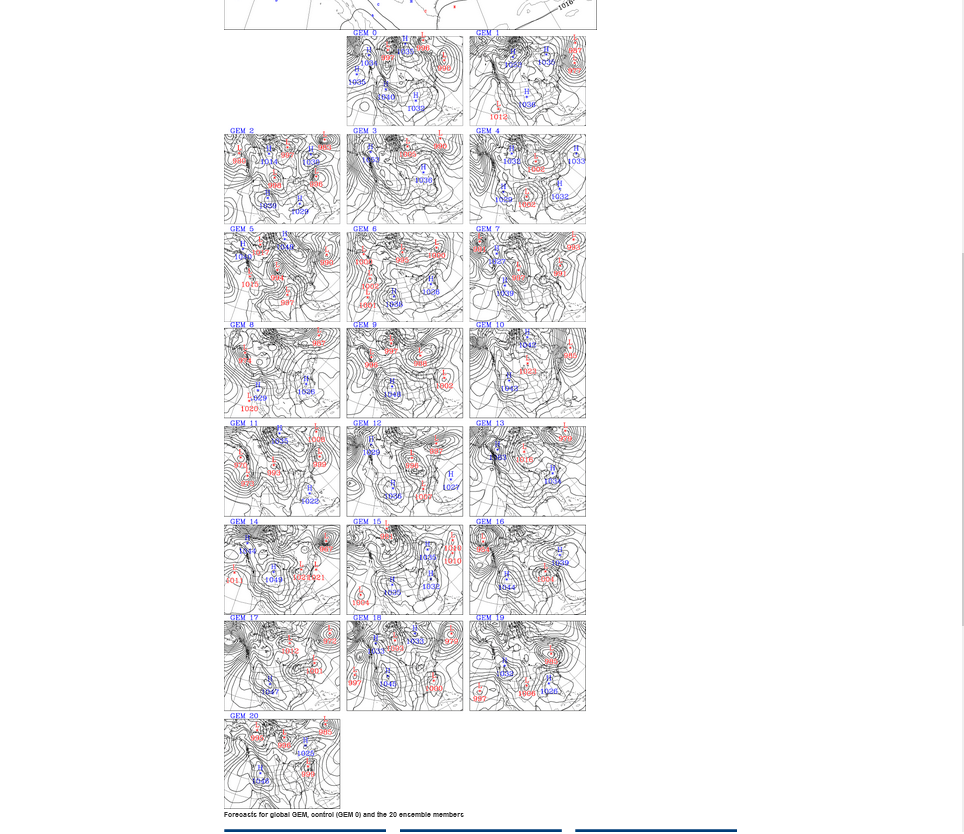
Look at all the extreme variations on the just out 12z Canadian ensembles(end of period=384 hours).
The opposite extremes end up cancelling each other other and making the average not look extreme........even though the majority of solutions don't actually look like the average.
https://weather.gc.ca/ensemble/charts_e.html?Hour=384&Day=0&RunTime=12&Type=gz
I said this earlier in this thread regarding the upcoming very strong -NAO:
"So, are these not so cold models right in the E US? Or are they underestimating the cold potential of the forecasted -1.1 NAO for 12/1-15? Which is more likely? I don't know but consider this for RDU's 12/1-15 temperature anomalies for the seven years since 1950 with a -NAO of -1 or stronger:
1963: very cold -7
1977: cold -5
1989: very cold -7
1995: cool -2
2002: very cold -9
2009: cool -2
2010: very cold -12
*Average: cold -6
*None were mild. All were colder than normal with 5 of 7 cold to very cold.
RDU data:
https://www.weather.gov/wrh/Climate?wfo=rah "
---------------------------------
Here's a new post:
Today's 0Z GEFS based forecast for 12/1-15 is for an NAO of ~-1.0, which would be about tied for 7th lowest NAO since 1950. The quoted post above shows an average at RDU of a cold 6 colder than normal for 12/1-15 for the 7 NAOs since 1950 of -1.0 or lower.
OTOH, today's GEFS based forecast for 12/1-15 is for a PNA of ~-1.0. This would be for 12/1-15 the 4th lowest PNA since 1950 and the lowest since 1973! Here are the RDU temperature anomalies for the six 12/1-15 periods since 1950 with a PNA of -0.8 or lower:
1956 (PNA -1.1): quite mild +7
1961 (PNA -1.05): normal -1
1972 (PNA -1.2): mild +4
1975 (PNA -0.9): normal 0
2012 (PNA -0.8): quite mild +7
2021 (PNA -0.8): mild +4
*Average: mild +4
*None were cold and 4 of 6 were mild to quite mild.
So, there is a forecasting conundrum for the first half of this month with the strong -NAO analogs averaging a cold -6 and the strong -PNA analogs averaging a mild +4. This illustrates the complexity of the pattern and thus the higher level of difficulty of the models sorting this out. This tells me to keep confidence in any one model run (including ensembles) lower than normal and to expect larger than normal changes from run to run.
Great stuff Larry!
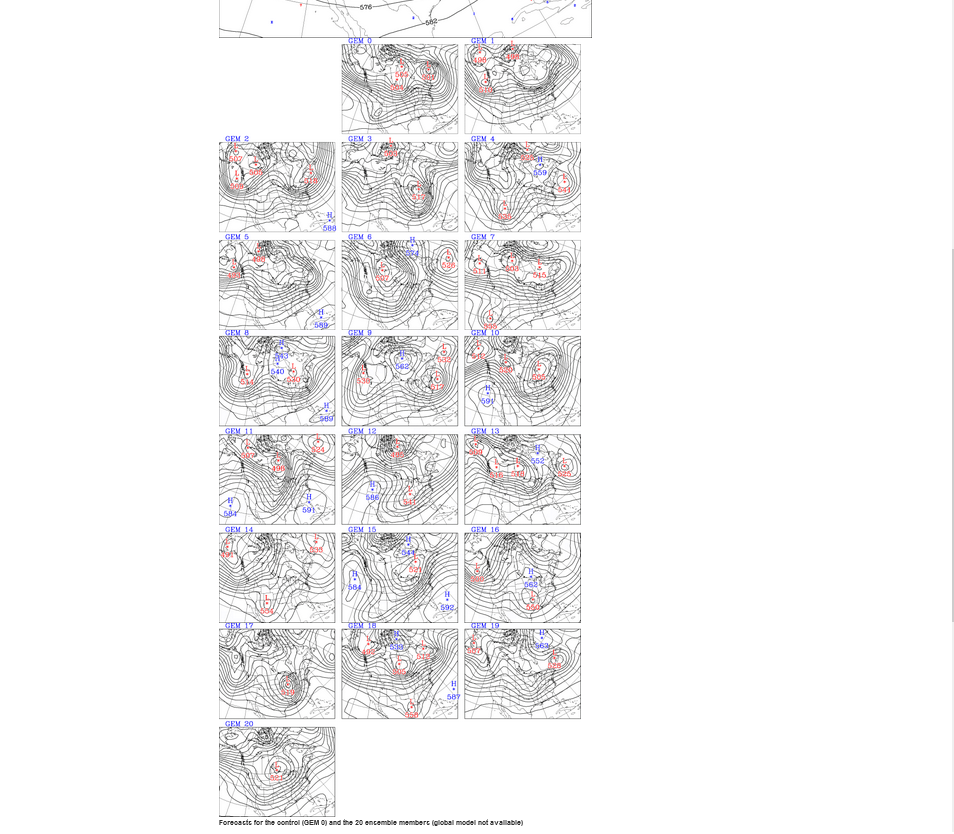
The Canadian model is interesting in that it predicts the extremely cold temps to be in the West. This is the last map at 384 hours from the just updated 12z model.
Very impressive highs on surface map from the dense, frigid cold.
https://weather.gc.ca/ensemble/charts_e.html?Hour=384&Day=0&RunTime=12&Type=pnm
2nd link is 500mb maps
https://weather.gc.ca/ensemble/charts_e.html?Hour=384&Day=0&RunTime=12&Type=gz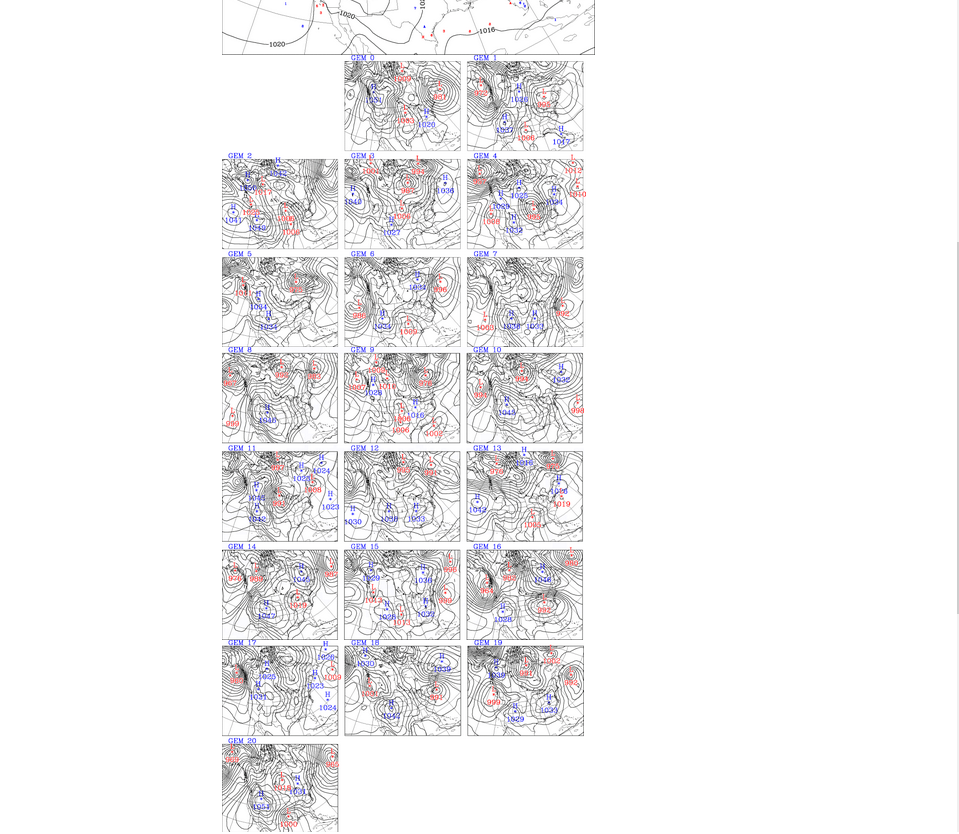
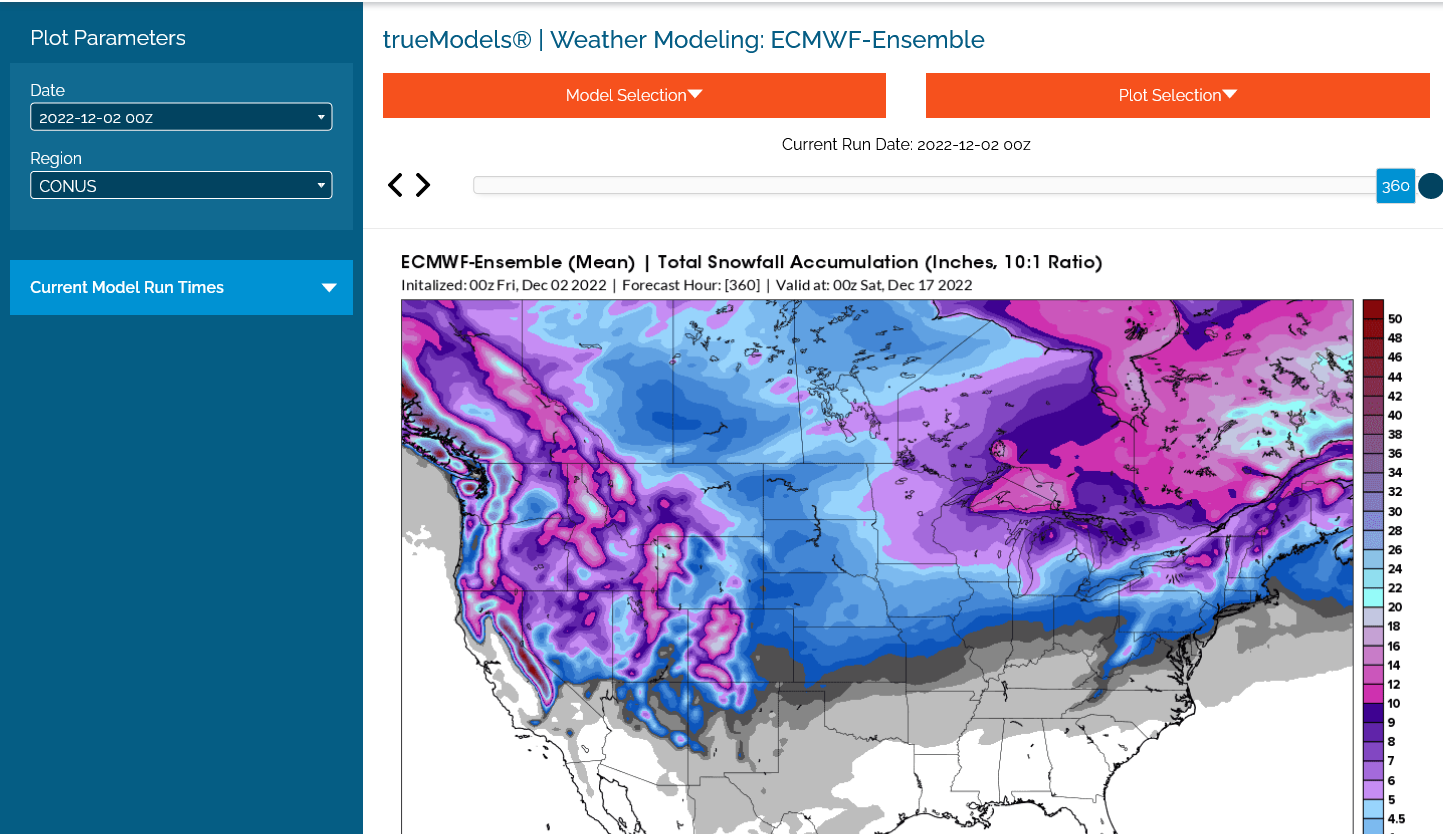
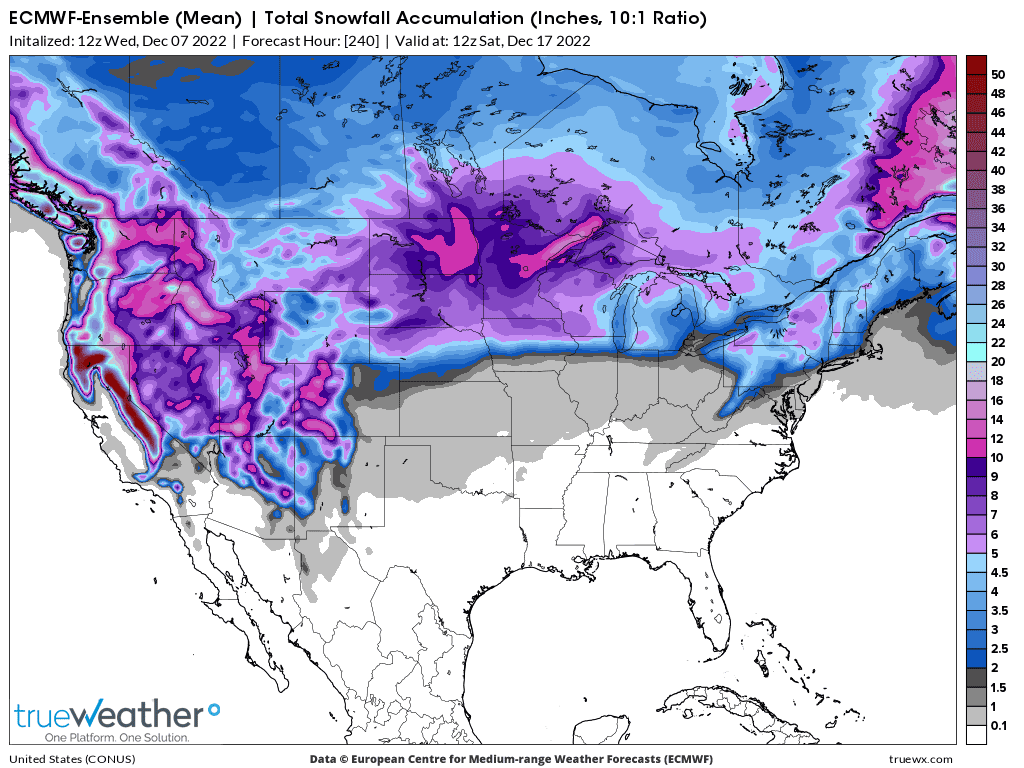
Another thing to consider is how much snow will pile up.
The very low angled sun in December won't be moderating air masses that much and deep snow pack will not just reflect the sun back out during the day but offers optimal long wave heat loss at night. If the source region of the air masses coming from north to south is over deep snowpack that air is going to be much colder than if the ground were bare or had less snow.
This was the 0z EE total snow forecast thru 360 hours.
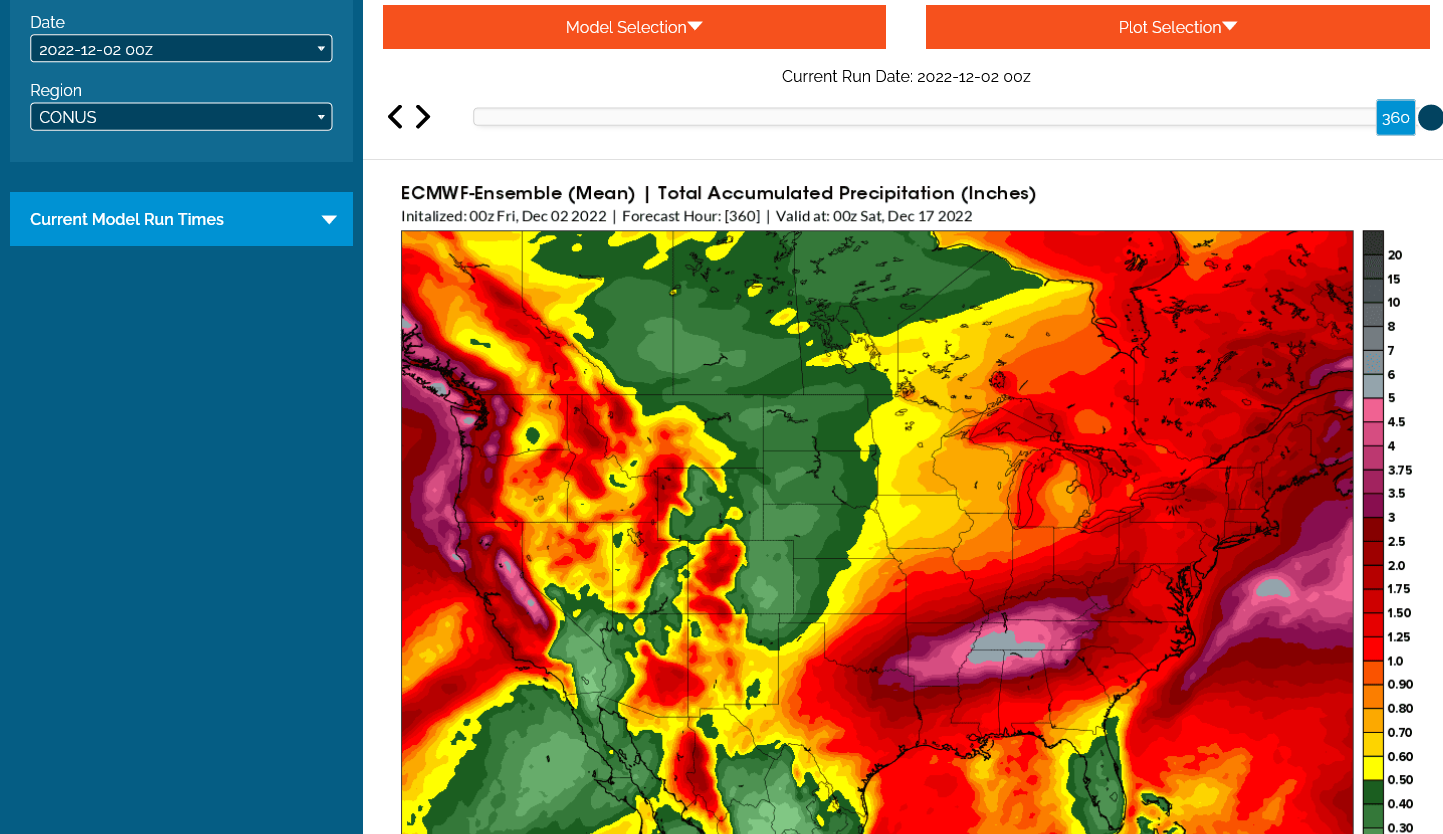
The total liquid precip is interesting because of the 5+ inches in the TN Valley. -NAO flow regime is typically very dry in the Midwest(N/NW flow). Often, the stronger it is, the farther south the dryness but there is often a set up for Pacific waves coming from the west to temporarily dig the deep, -NAO trough far enough west and amplify it to generate huge N'oreasters or snow storms farther south and west than that.
Larry, this pattern, to me is setting off a strong potential "ICE STORM" signal in my head. The dense cold air at the surface from the -NAO is able to undercut milder air aloft. The heavy rain in the TN valley tells us there will be SIGNIFICANT moisture return(from the -PNA) into an area not far from -NAO driven cold surface air(which can go farther south than models expect.
The outcome? Warm aloft/cold surface = freezing rain on the northern fringe of the rain shield and sleet where the depth of the cold is great enough for the rain to freeze BEFORE reaching the surface.
Mike,
I see that the 12Z EE late week two is significantly colder than recent runs and is downright cold in much of the E US. But is it for real this time or is it another headfake?
I'm leaning in that direction, Larry but last week at this time thought we would be MUCH, MUCH colder the next 10 days than we're going to be.
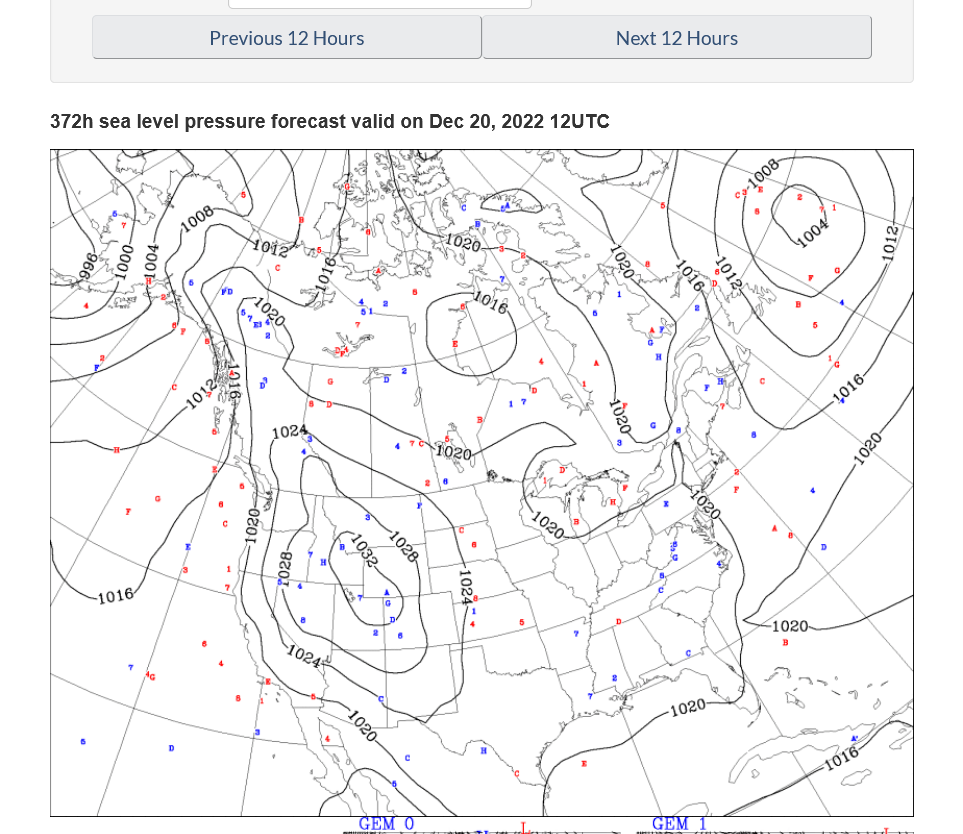
Latest surface pressure at the start of week 3 from 0z Canadian ensembles. Most have cold Canadian highs dominating, especially favored in the West.
https://weather.gc.ca/ensemble/charts_e.html?Hour=372&Day=0&RunTime=00&Type=pnm
Ensemble average below. Coldest air in the west.
Oz GEFS was -12 HDDs bs 18z, the -4 HDS warmer yet on the 6z run.
EE was unchanged. What a huge warm bust compared to last week!o
NAO climbs towards 0 from deep negative but stays negative.
AT the same time….so does the PNA…going from extremely negative to almost 0.
AO stays at an extremely negative value strongly favoring transport of cold in the high latitudes moving to mid latitudes….but at what longitude will this happen?? Has been the impossible to answer question.
+++++++++++++++++
Another item to keep in mind is that forecasts for AO, NAO and PNA are also from models and the models busted REALLY BAD on the extreme SUSTAINED -NAO. Instead of staying extremely low, we spiked down briefly and are increasing but still negative........so they East can turn cold later this month with a near 0 PNA then.
++++++++++++++++++
Re: Re: Re: Re: Re: Re: Re: Re: Re: Weather 11/27/22+
https://www.marketforum.com/forum/topic/91060/#91151
By WxFollower - Nov. 30, 2022, 1:56 p.m.
Per the 0Z 11/30/22 GEFS run, the first half of December is forecasted to have an average NAO of near -1.1. That would by a good margin be the strongest -NAO in the first half of December since 2010. Looking back to 1950, here are the strongest -NAOs for the first half of December:
1. 1963: -1.5
2. 2009: -1.3
3. 2010: -1.2
4-6. 1977, 1989, 1995: -1.1
7. 2002: -1.0
The remainder since 1950 are -0.8 or weaker.
+++++++++++
Latest forecasts below
https://www.cpc.ncep.noaa.gov/products/precip/CWlink/daily_ao_index/ao.shtml
https://www.cpc.ncep.noaa.gov/products/precip/CWlink/pna/nao.shtml
https://www.cpc.ncep.noaa.gov/products/precip/CWlink/pna/pna.shtml
500 mb from 384 hour GEFS shows the tremendous spread and uncertainty in 2 weeks.
The mean/average comes out not too far from zonal with a slight ridge/West, trough/Central-East.
http://www.meteo.psu.edu/fxg1/ewall.html
http://www.meteo.psu.edu/fxg1/ENSHGT_12z/f384.gif
https://mag.ncep.noaa.gov/Image.php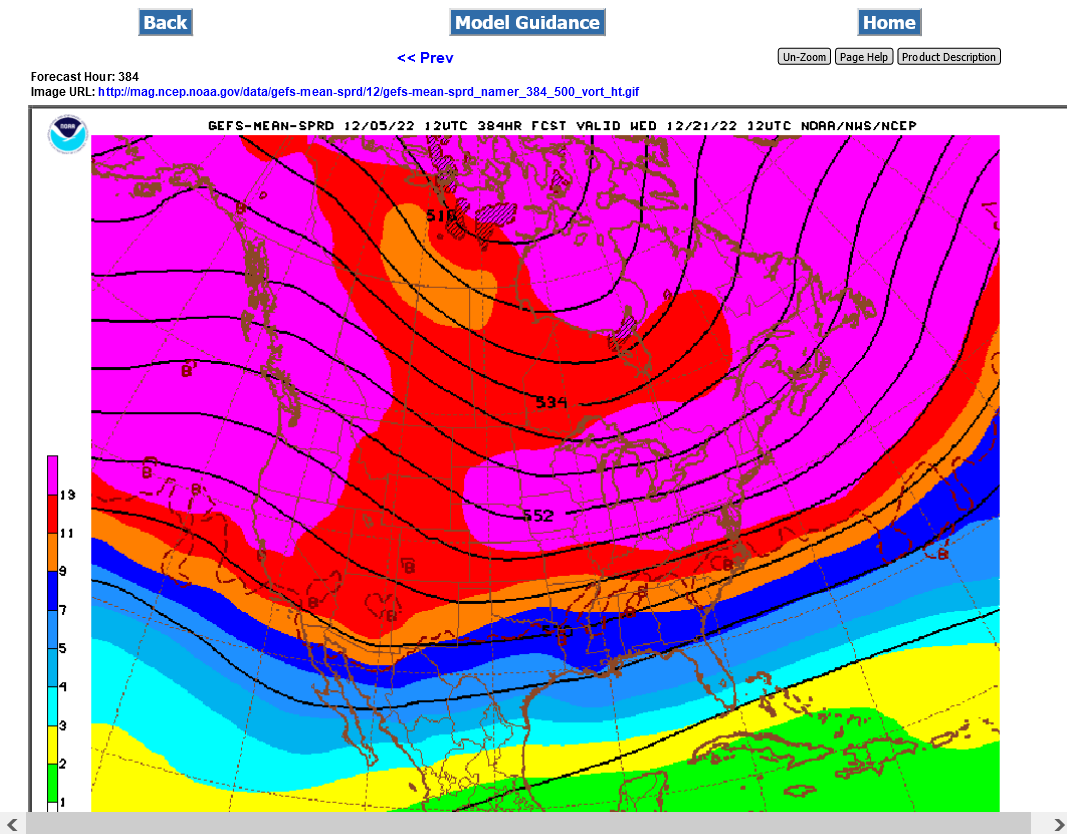 +++++++++
Just out EE at 360 hours. Looks like cold will increase. Amplifying ridge-West, trough-East. 2 week out though.
The GEFS NAO forecast for 12/1-15 has risen from -1.1 on the 11/30 run to -0.8 to -0.9 on today's run.
The 0z GEFS was +1 HDD vs the 18z run but was -5 HDDs vs the 12z run.
The 0z EE was another -11 HDDs vs the 12z run. The GEFS (which had been the colder model) is down over 50 HDDs since the peak in the middle of last week. The EE down around 30 HDDs. The EE is now slightly colder.
Models much colder in week 2, despite rapidly increasing NAO and AO. But the PNA increasing is a big cold plus.
https://www.marketforum.com/forum/topic/90609/#91297
By metmike - Dec. 7, 2022, 2:42 a.m.
0z GEFS another +13 HDDs vs the previous 18z run.
0z EE +10 HDDS vs the 12z run.
Total snowfall forecast the next 10 days.
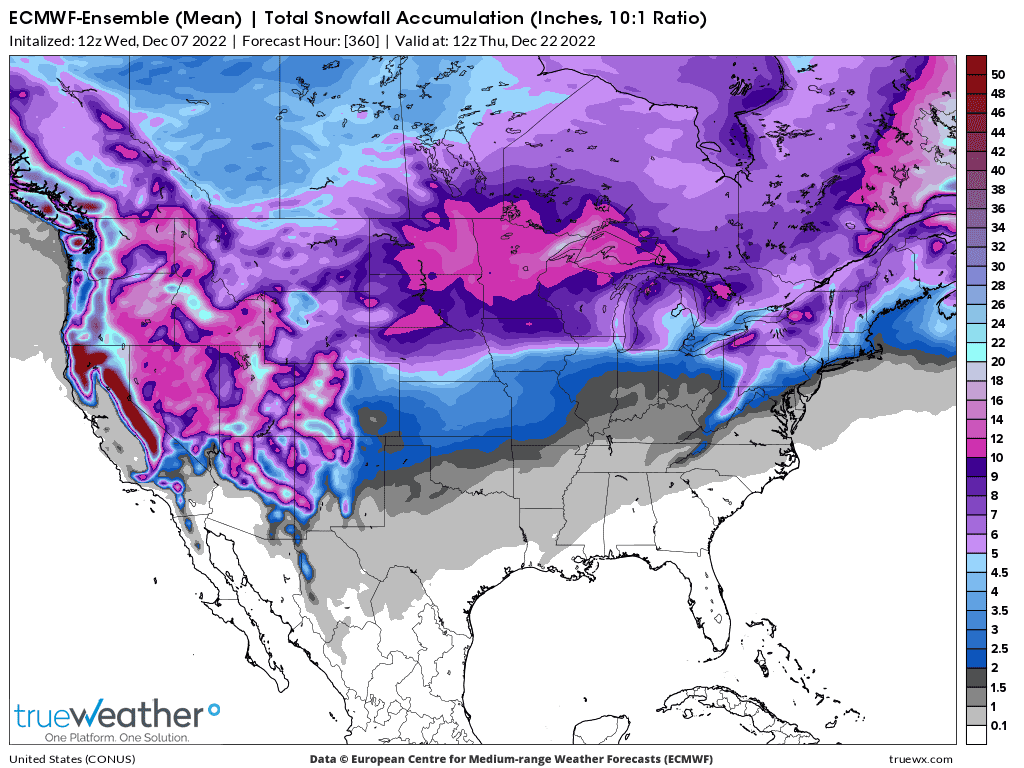
Snow the next 15 days below
Hey Mike,
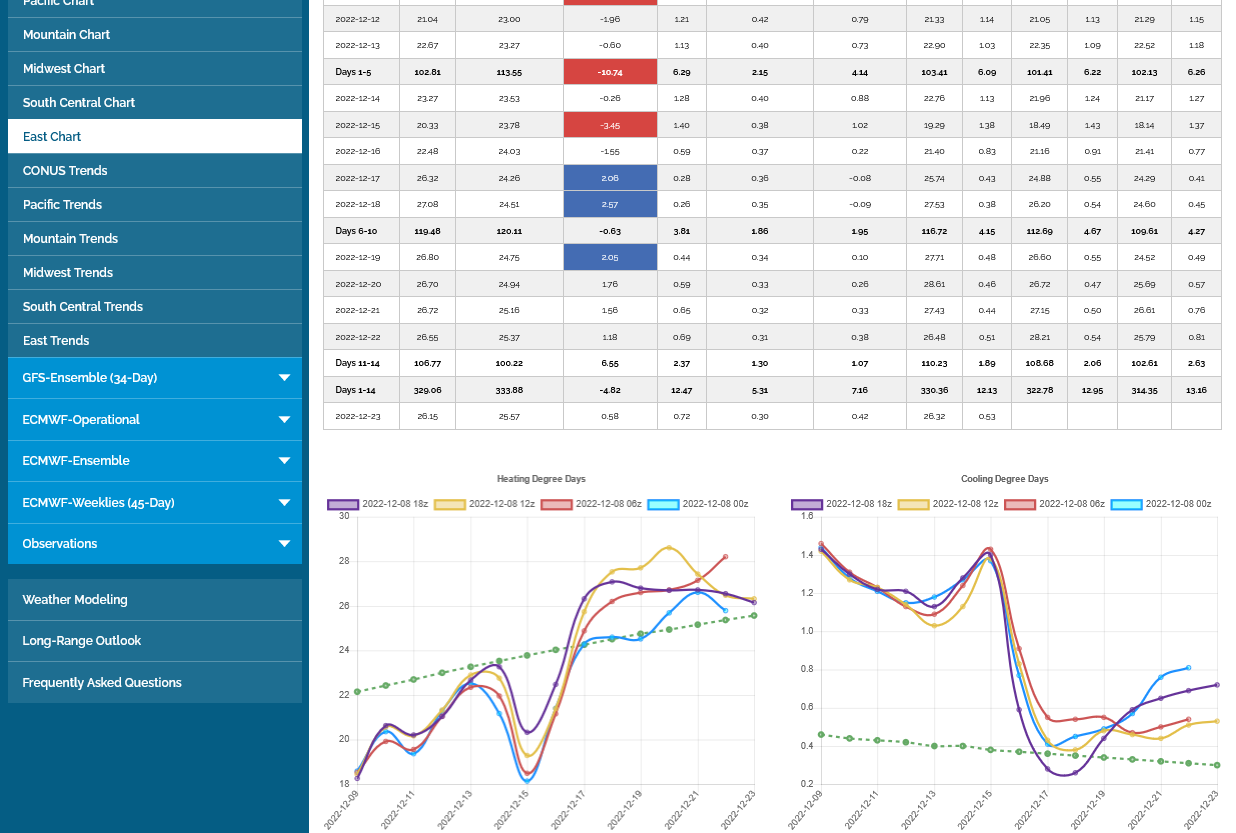
What was the HDD comparison for the 12Z EE vs 0Z EE? I see there was a quick big (over 3%/20 cents) NG drop from 1:05 to 1:25 PM CST! That is just after the 6-10 day maps are released at the fastest sites. Was the 6-10 day portion significantly warmer?
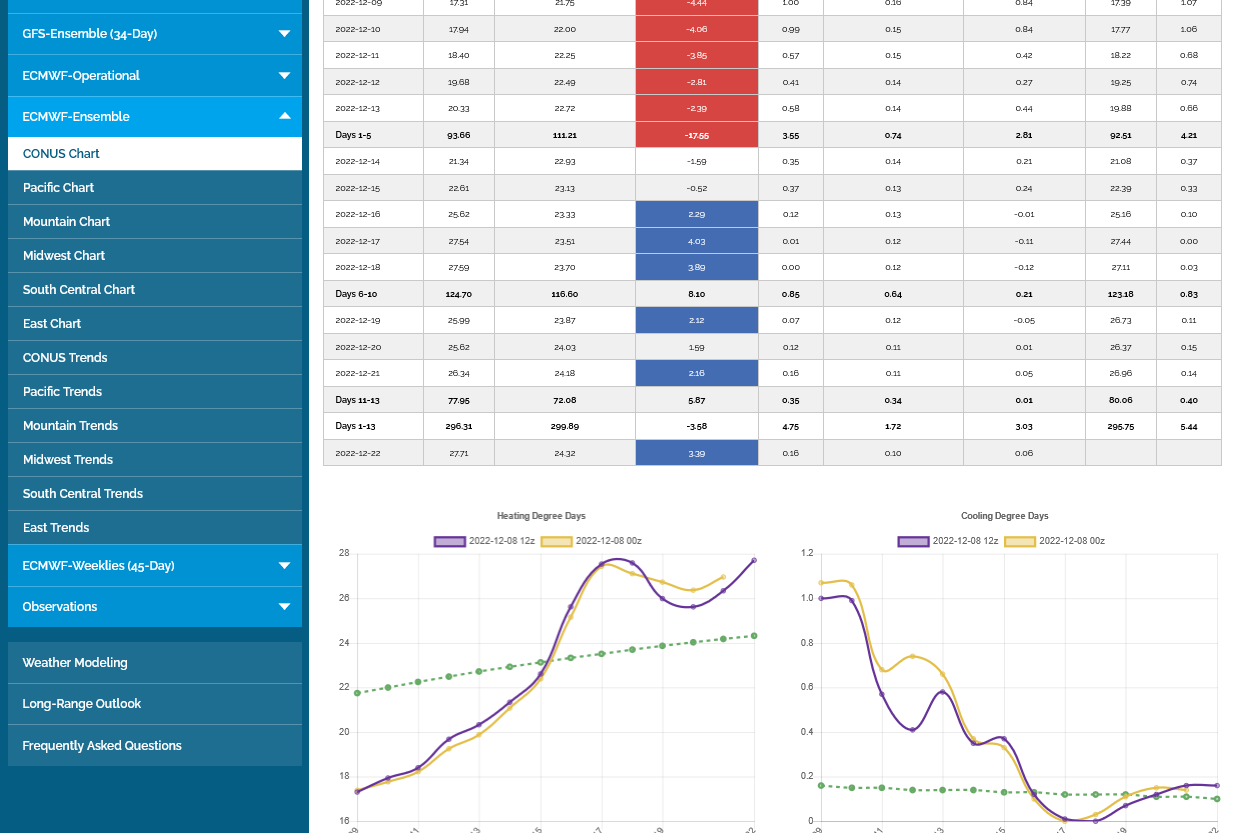
Here they are Larry:
The 2nd graph is the last 2 EE.
The one below that is the last for GEFS, including the just out 18z run.
Bullish weather for NG but we couldn't fill the downside gap from Sunday Night with the huge spike higher today.
Got close, filling much of the gap but missed filling it by $600/contract. EIA was bearish again.

+++++++++++++++++++++++++++++
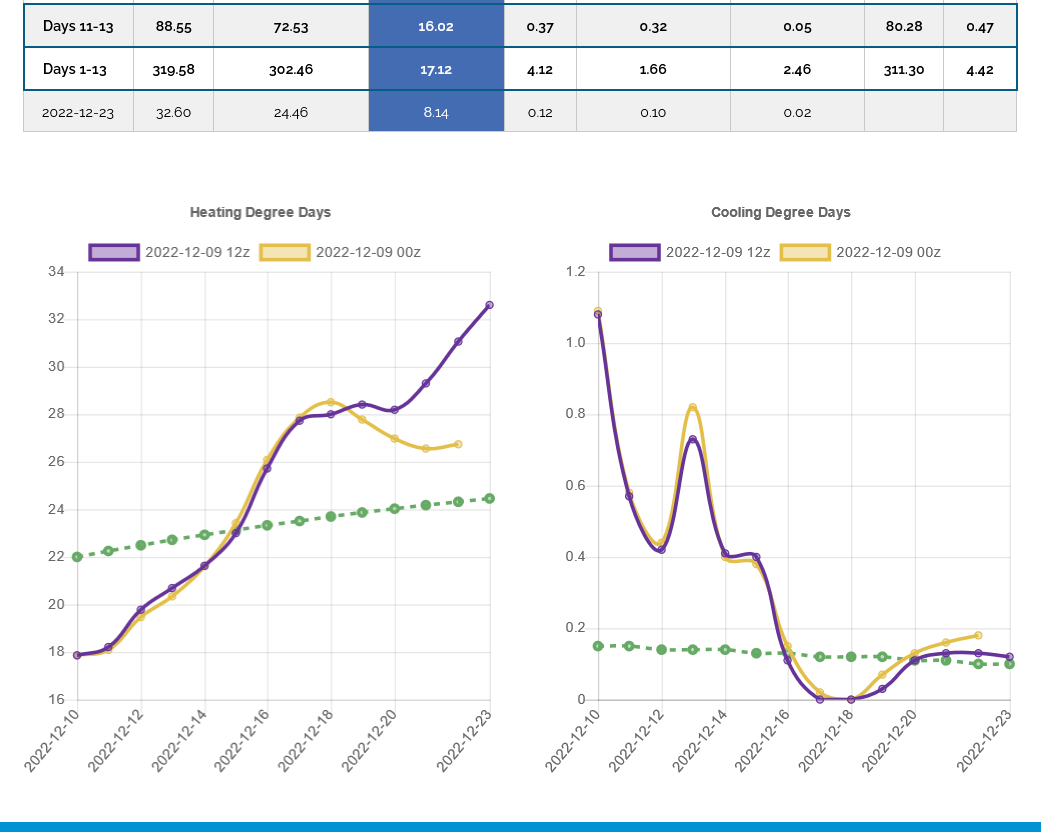
The 12Z EE is MUCH colder than the 0Z EE 12/22+ and it is much colder when the run ends. Just in advance of this, NG rose nearly 3%.
Mike, how much did the HDDs rise?
Here you go Larry!
I've been swamped starting chess again for this season at 5 schools this week. Just got back from the last one with 100 students from K-6 at just that school (McCutchanville Elementary)! Whew!
Explanation for the upcoming pattern here:
https://www.marketforum.com/forum/topic/91385/#91411
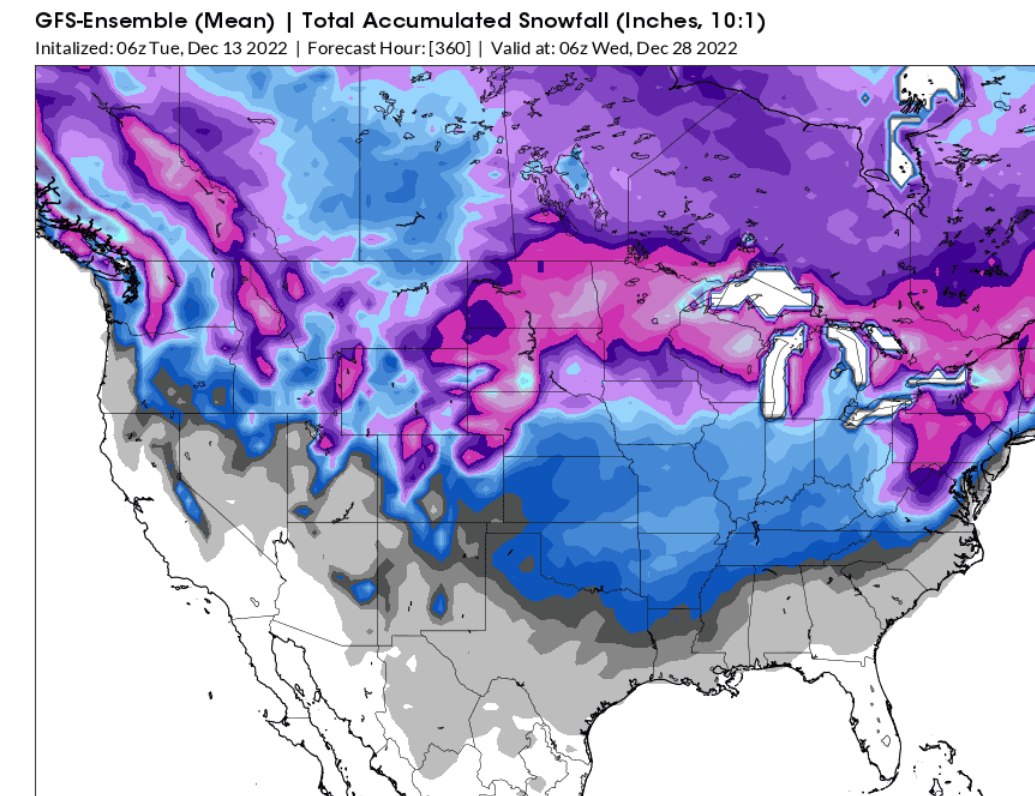
Latest snow forecast for the next 2 weeks:
Mike,
It had looked, especially on the EE, like it might get pretty cold in the E half of the US near midmonth with a return of a solid +PNA. However, today's 0Z EE and other ensembles have softened that and also suggest the cooling would likely be shortlived as the Pacific jet roars right back.
Other than for the big cold of late last month, the models have been doing this a lot since late November. A pro met. I have talked to thinks that record high SSTs in Indonesia/Maritime Continent over the last few winters have been the main culprit in models being cold biased in the E US.
Barring a change back to a colder 12Z EE, I expect NG to open lower this evening based on the above.
Excellent post!
I agree completely with all of that, Larry!
We aren't going to have major cold invasions with guidance that looks like this:
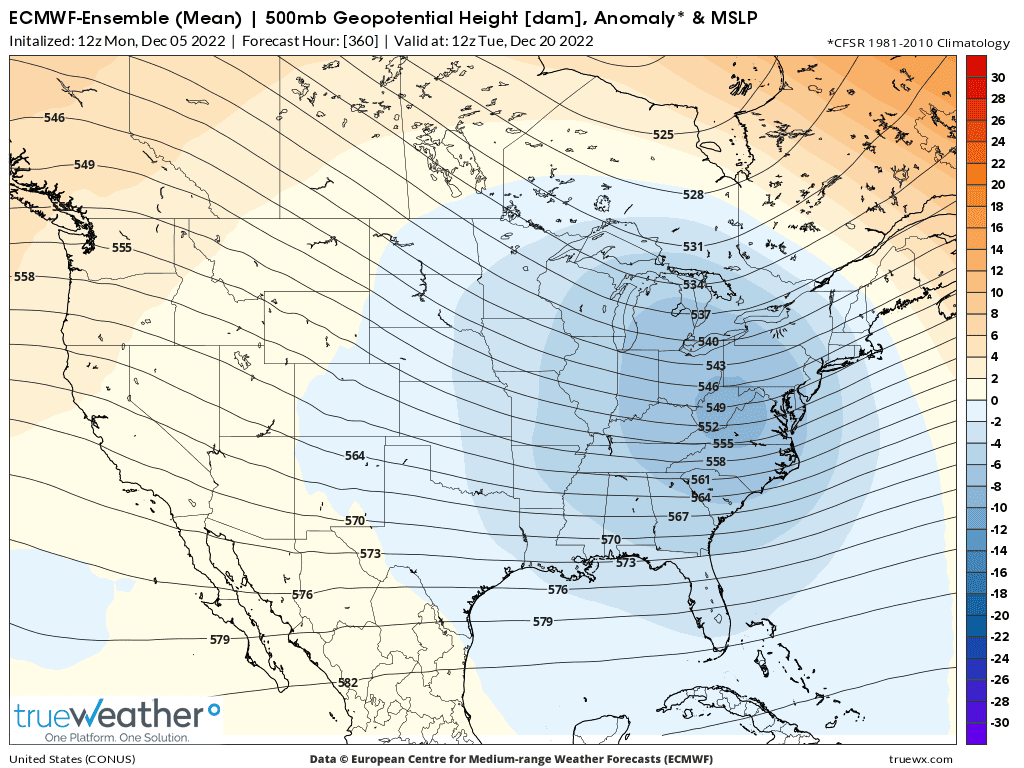
This is what the pattern looked like, as predicted 1 week before the December cold wave:
https://www.marketforum.com/forum/topic/91423/
Upper level pattern anomalies below:
https://www.psl.noaa.gov/map/images/ens/z500anom_nh_alltimes.html
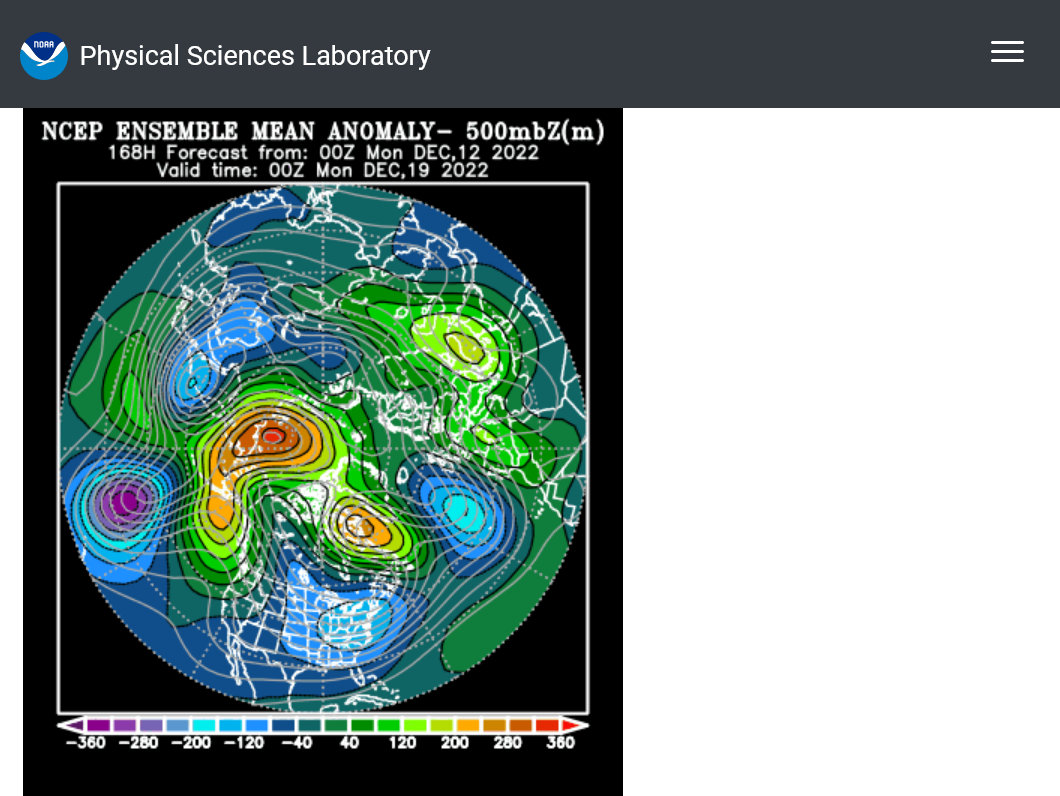
Temperature anomalies 1 mile up below
https://www.psl.noaa.gov/map/images/ens/t850anom_nh_alltimes.html
+++++++++++++++
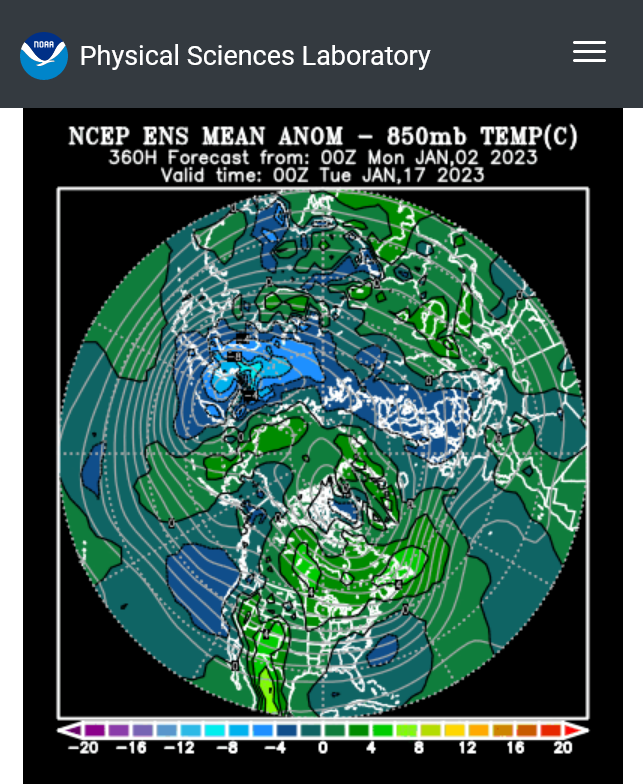
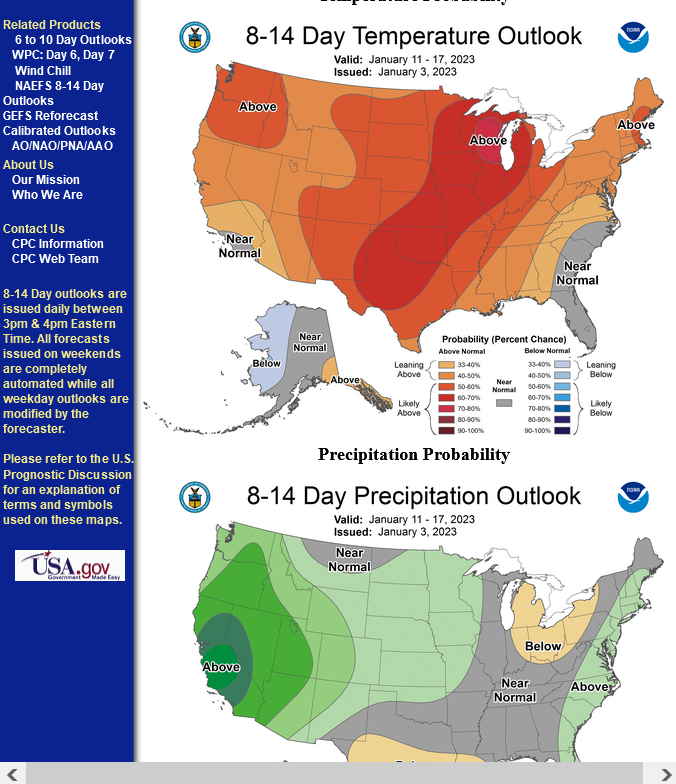
This is what the same maps look like now at 2 weeks, at the end of the important guidance time frame going out to mid-January. COMPLETELY DIFFERENT!
https://www.psl.noaa.gov/map/images/ens/z500anom_nh_alltimes.html
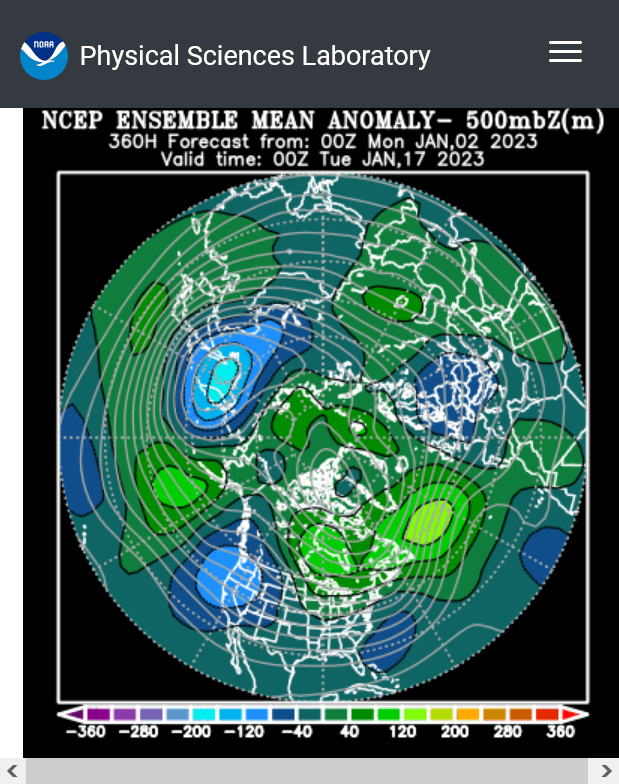
https://www.psl.noaa.gov/map/images/ens/t850anom_nh_alltimes.html
Indices:
Thanks, Mike. The 12Z EE still has a decent +PNA induced cold shot in especially the SE US ~1/13-16, but the run then abruptly ends the +PNA as the roaring Pacific flow takes over. This would normally look bearish to me for NG. Do you know if HDDs have fallen for the same days on the 12Z Friday ensemble runs? The other caveat is that NG has already fallen drastically in recent days and may need a breather, especially with the huge draw expected on this week's EIA. Yes, that should already be dialed in, but I know that NG often is weird this way and sometimes waits for the report release before making its next move.
Those are all wonderful, very relevant points, Larry.
Are you back trading natural gas?
1. I was in Detroit all of last week with family and not able to track HDDs.
2. Thanks for alerting us to the huge draw down coming up this Thursday. Are you sure that there were 24 more HDD's for this week vs the previous one? I totally get that the Southeast counts alot but that's the only place that was a bit colder, while the rest of the country was MUCH colder, many places by incredibly wide margins.
https://www.marketforum.com/forum/topic/91385/#91816
Temps for this Thursday's EIA report.
Previous week:
3. How long do we go before NG has dropped below fair value and runs out of traders that want to sell/cover longs, no matter how mild the forecast is? Seasonals are typically down here.
With the ng market having dropped to less than half the price of just a few months ago, this might be good value for commercials that want to lock in a decent price.
What's the current status of our exports and the damaged facility?
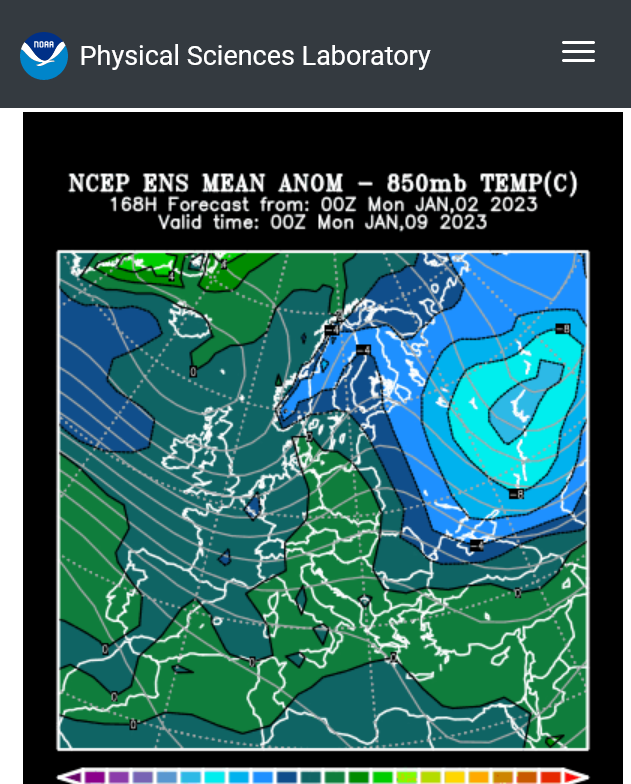
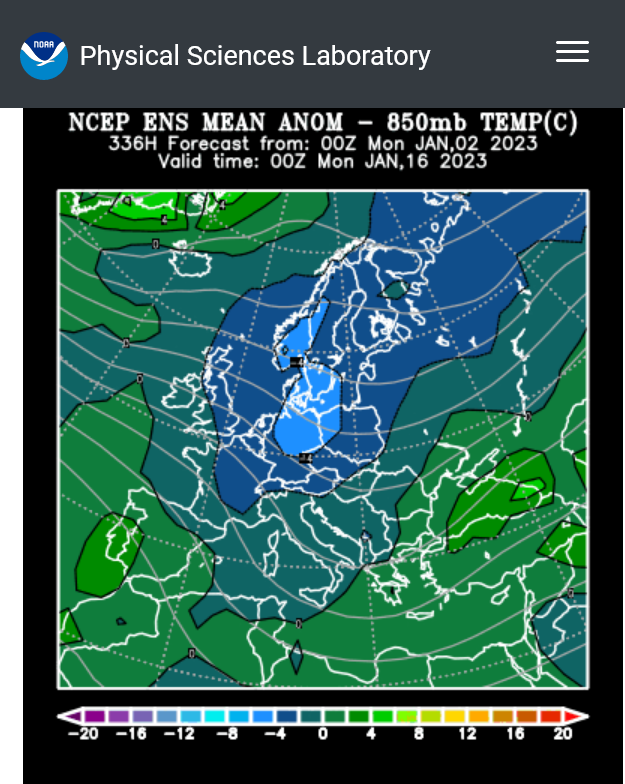
What's the ng situation in Europe right now? Looks colder there mid-month and N.Asia looks to get the brunt of the cold this month. Global prices/exports could put a bottom in for how low US prices get:
https://www.psl.noaa.gov/map/images/ens/t850anom_eu_alltimes.html
Mike said:
"Those are all wonderful, very relevant points, Larry.
Are you back trading natural gas?
1. I was in Detroit all of last week with family and not able to track HDDs.
2. Thanks for alerting us to the huge draw down coming up this Thursday. Are you sure that there were 24 more HDD's for this week vs the previous one? I totally get that the Southeast counts alot but that's the only place that was a bit colder, while the rest of the country was MUCH colder, many places by incredibly wide margins."
-------------------/
Hey Mike,
Thank you. I'm not back trading it, but I still enjoy following it.
1. Family much more important than tracking HDDs as we know!
2. Here's the reason. When I look at EIA weeks, I look at DDs for weeks ending on Thursday rather than Friday. That's because most of Friday is into the subsequent EIA week. From the methodology:
"The Form EIA-912 requests information on the volumes of working gas in storage as of 9:00 a.m. Central Standard Time (CST) Friday of the previous week from a sample of underground natural gas storage operators."
Together with the idea that there's normally a lag between temperature changes outside and the impact on inside heating or cooling needs rather than being instantaneous, I feel that using weeks that end on Thursday is a much better way to predict the EIAs than using weeks that end on Fridays.
This means that I looked at the week ending 12/29 vs the week ending 12/22 instead of comparing week ending 12/30 to week ending 12/23. Would you please post those two maps? If you do that, you'll see that the 12/29 week is colder than the 12/22 week east of a line from Houston to Chicago.
Thanks much, Larry! I just learned something. From now on, I'll post the week ending Thursday.
1 day usually doesn't make much difference but in this case, the 1 day difference is as great as it ever was, going from near record warmth, to near record cold, then back to near record warmth.
Here's the next report, last day being Thursday of last week:
++++++++++++++++++
Last report ending the previous 7 days.
Compare those maps to using a day later. Big changes for just 1 day for the high population centers in the areas that you mentioned!
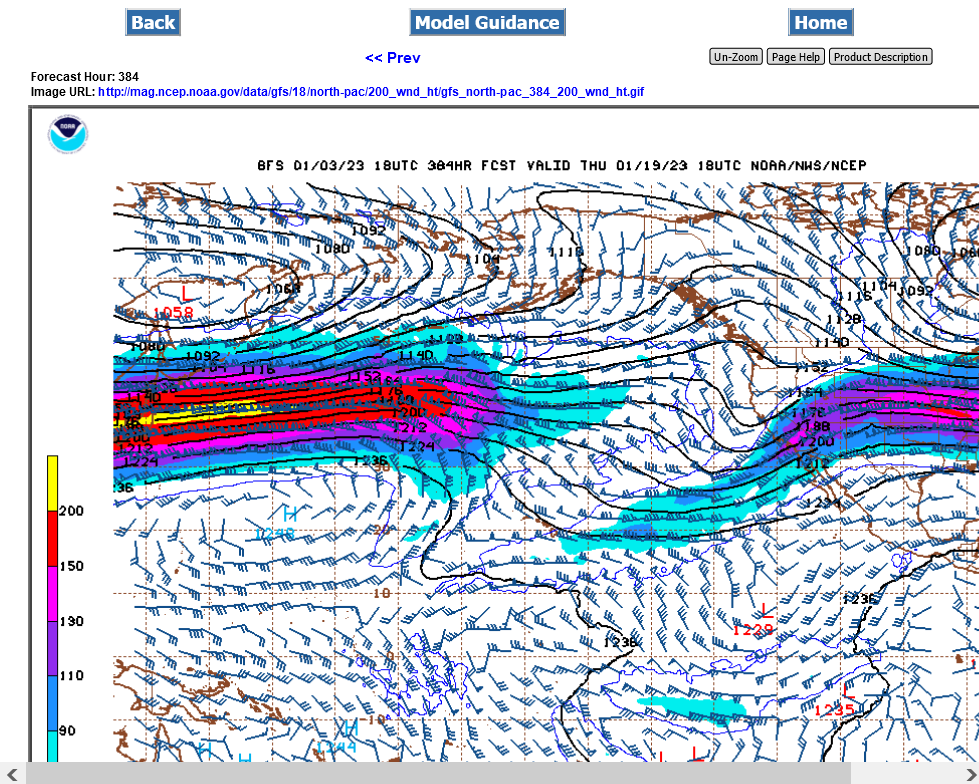
This weather pattern is suggesting to us that the current La Nina is rapidly coming to an end.
The atmosphere is taking on the El Nino signature big time!
Regardless of what the models or Pacific ocean temp profiles indicate, the atmosphere is acting just like it does when we have El Nino in the Pacific.
I've not seen this configuration for several Winters.
Look at that jet stream roaring across the Pacific. The yellow is a 200+ knot jet streak which is 240+ MPH!
You rarely see that and it's usually during El Nino's in the Pacific. It's aimed at the US, which will flood the entire US with mild, oceanic air and bombard the entire West Coast with heavy precip all the way to S.California which is typical of El Nino NOT La Nina.
To me, this signals the demise of the long lived La Nina!!
This should also bring a chance for drought relief in Argentina!
Ding, Dong the La Nina is (almost)dead, which La Nina, the 3 year old La Nina!
This will likely also mark the end of the multi year pause in the mostly beneficial global warming.
2022 was the 7th warmest year.
https://www.marketforum.com/forum/topic/91894/
I predict that 2023 will be warmer with high confidence and there will likely be less drought in the US because of it.