KEY EVENTS TO WATCH FOR:
Friday, December 16, 2022
9:45 AM ET. December US Flash Manufacturing PMI
PMI, Mfg (previous 47.6)
9:45 PM ET. December US Flash Services PMI
PMI, Services (previous 46.1)
10:00 AM ET. November State Employment and Unemployment
N/A Latest deadline for new funding deal to avert U.S. Govt. shutdown
The STOCK INDEXES? http://quotes.ino.com/ex?changes/?c=indexes
The STOCK INDEXES: The March NASDAQ 100 was lower overnight as it extends the decline off Tuesday's high. Overnight trading sets the stage for a lower opening when the day session begins trading.Stochastics and the RSI are neutral to bearish signaling that sideways to lower prices are possible near-term. If March extends this week's decline, the November 9th low crossing at 10,932.75 is the next downside target. Closes above the 20-day moving average crossing at 11,813.65 would signal that a short-term low has been posted. First resistance is the 50% retracement level of the August-October crossing at 12,229.32. Second resistance is the 62% retracement level of the August-October crossing at 12,618.67. First support is the November 9th low crossing at 10,932.75. Second support is November's low crossing at 10,746.75.
The March S&P 500 was lower overnight as it extends the decline off Tuesday's high. Overnight trading sets the stage for a lower opening when the day session begins trading. Stochastics and the RSI are oversold but remain neutral to bearish signaling that sideways to lower prices are possible near-term. Closes below the 50-day moving average crossing at 3903.24 would open the door for additional weakness possibly into the end of the year. If March extends the aforementioned decline, the November 9th low crossing at 3735.00 is the next downside target. Closes above the 20-day moving average crossing at 4019.18 would signal that a short-term low has been posted. First resistance is the 75% retracement level of the August-October declinecrossing at 4153.96. Second resistance is the 87% retracement level of the August-October decline crossing at 4254.67. First support is the 50-day moving average crossing at 3903.24. Second support is the November 9th low crossing at 3735.00.
INTEREST RATES http://quotes.ino.com/ex changes/?c=interest"
INTEREST RATES: March T-bonds was lower overnight as it consolidates some of its recent gains. Overnight trading sets the stage for a lower opening when the day session begins trading. Stochastics and the RSI are overbought, diverging but remain neutral to bullish signaling that sideways to higher prices are possible near-term. If March extends the rally off October's low, the 62% retracement level of the August-October decline crossing at 133-30 is the next upside target. Closes below the 20-day moving average crossing at 128-31 would signal that a short-term top has been posted. First resistance is Thursday's high crossing at 132-15. Second resistance is the 62% retracement level of the August-October decline crossing at 133-30. First support is the 20-day moving average crossing at 128-31. Second support is the 50-day moving average crossing at 124-26.
March T-notes were higher overnight and sets the stage for a higher opening when the day session begins trading. Stochastics and the RSI have turned neutral to bullish signaling that sideways to higher prices are possible near-term. If March extends the rally off October's low, the 62% retracement level of the August-October decline crossing at 116.232 is the next upside target. Closes below the 20-day moving average crossing at 113.266 would signal that a short-term top has been posted. First resistance is the 50% retracement level of the August-October decline crossing at 115.090. Second resistance is the 62% retracement level of the August-October decline crossing at 116.232. First support is the 20-day moving average crossing at 113.266. Second support is the 50-day moving average crossing at 112.106.
ENERGY MARKETS? http://quotes.ino.com/ex?changes/?c=energy ""
ENERGIES:Januarycrude oil was lower overnight as it consolidates some of the rally off last-Friday's low. Overnight trading sets the stage for a lower opening when the day session begins trading. Stochastics and the RSI are poised to turn neutral to bearish with additional weakness that would signal sideways to lower prices are possible near-term. If January renews the decline November's high, the 62% retracement level of the 2020-2022 rally crossing at $63.80 is the next downside target. Closes above the 20-day moving average crossing at $76.74 would signal that a short-term low has been posted while opening the door for additional weakness near-term. First resistance is the 20-day moving average crossing at $76.74. Second resistance is the 50-day moving average crossing at $82.29. First support is last-Friday's low crossing at $70.08. Second support is the 62% retracement level of the 2020-2022 rally crossing at $63.80.
January heating oil was lower overnight as it consolidates some of the rally off last-Wednesday's low. Overnight trading sets the stage for a lower opening when the day session begins trading. Stochastics and the RSI are neutral to bullish signaling that sideways to higher prices are possible near-term. If January extends this week's rally, the 50-day moving average crossing at $3.3695 is the next upside target. Closes below the 10-day moving average crossing at $3.0220 would signal that a short-term top has been posted. First resistance is the 50-day moving average crossing at $3.3695. Second resistance is December's high crossing at $3.4103. First support is the 20-day moving average crossing at $3.1498. Second support is the 10-day moving average crossing at $3.0220.
January unleaded gas was lower overnight as it consolidates some of the rally off Wednesday's low. Overnight trading sets the stage for a lower opening when the day session begins trading. Stochastics and the RSI are turning neutral to bearish signaling that sideways to lower prices are possible near-term. If January renews the decline off November's high, the 50% retracement level of the 2020-2022 rally crossing at $1.9894 is the next downside target. Closes above the 20-day moving average crossing at $2.2358 would signal that a short-term low has been posted. First resistance is the 20-day moving average crossing at $2.2358. Second resistance is the 50-day moving average crossing at $2.3826. First support is Monday's low crossing at $2.0204. Second support is the 50% retracement level of the 2020-2022 rally crossing at $1.9894.
January natural gas was lower overnight as it extends this week's trading range. Overnight trading sets the stage for a lower opening when the day session begins trading. Stochastics and the RSI are neutral to bullish signaling that sideways to higher prices are possible near-term. If January extends the rally off November's low, the August-November downtrend line crossing near 7.695 is the next upside target. Closes below the 10-day moving average crossing at 6.247 would temper the near-term friendly outlook. First resistance is Tuesday's high crossing at 7.105. Second resistance is the August-November downtrend line crossing near 7.695. First support is the 10-day moving average crossing at 6.247. Second support is the 62% retracement level of the 2020-2022 rally crossing at 5.500.
CURRENCIEShttp://quotes.ino.com/ex changes/?c=currencies"
CURRENCIES:The March Dollar was slightly lower overnight. Overnight trading sets the stage for a steady to lower opening when the day session begins trading. Stochastics and the RSI are oversold but are poised to turn neutral to bullish with additional strength that would signal sideways to higher prices are possible near-term. If March extends the decline off September's high, the 75% retracement level of the March-September rally crossing at $101.331 is the next downside target. Closes above the 20-day moving average crossing at $105.072 would signal that a short-term low has been posted. First resistance is the 20-day moving average crossing at $105.072. Second resistance is the November 30th high crossing at $106.775. First support is Thursday's low crossing at $102.875. Second support is the 75% retracement level of the March-September rally crossing at $101.331.
The March Euro was steady to slightly higher overnight and sets the stage for a steady to slightly higher opening when the day session begins trading. Stochastics and the RSI are overbought but remains neutral to bullish signaling that sideways to higher prices are possible near-term. If March extends the rally off September's low, the March 31st high crossing at $1.09680 is the next upside target. Closes below the 20-day moving average crossing at $1.05535 would signal that a short-term top has been posted. First resistance is the 25% retracement level of the 2021-2022 crossing at $1.08062. Second resistance is the March 31st high crossing at $1.09680. First support is the 20-day moving average crossing at $1.05535. Second support is the November 30th low crossing at $1.03715.
The March British Pound was steady to slightly higher overnight and sets the stage for a slightly higher opening when the day session begins trading. Stochastics and the RSI have turned neutral to bearish signaling that sideways to lower prices are possible near-term. Closes below the 20-day moving average crossing at 1.2171 would signal that a short-term top has been posted. If March extends the rally off September's low, the 62% retracement level of the 2021-2022 decline crossing at 1.2770 is the next upside target. First resistance is Tuesday's high crossing at 1.2477. Second resistance is the 62% retracement level of the 2021-2022 decline crossing at 1.2770. First support is the 20-day moving average crossing at 1.2171. Second support is the November 30th low crossing at 1.1937.
The March Swiss Franc was lower overnight due to profit taking as it consolidates some of this week's gains. Overnight trading sets the stage for a lower opening when the day session begins trading. Stochastics and the RSI are overbought, diverging but remain neutral to bullish signaling that sideways to higher prices are possible near-term. If March extends the rally off the November 21st low, the 62% retracement level of the 2021-2022 decline crossing at 1.10351 is the next upside target. Closes below the 20-day moving average crossing at 1.07558 would temper the near-term friendly outlook. First resistance is Wednesday's high crossing at 1.09665. Second resistance is the 62% retracement level of the 2021-2022 decline crossing at 1.10351. First support is the 20-day moving average crossing at 1.07558. Second support is the November 30th low crossing at 1.06060.
The March Canadian Dollar was steady to slightly higher overnight as it extends the trading range of the past eight-days. Overnight trading sets the stage for a steady to slightly higher opening when the day session begins trading. Stochastics and the RSI are neutral to bearish signaling that sideways to lower prices are possible near-term. If March renews the decline off November's high, November's low crossing at $72.44 is the next downside target. Closes above the 20-day moving average crossing at $74.04 would signal that a short-term low has been posted. First resistance is the 20-day moving average crossing at $74.04. Second resistance is the December 5th high crossing at $74.82. First support is last-Wednesday's low crossing at $73.12. Second support is November low crossing at $72.58.
The March Japanese Yen was higher overnight and is working on a possible inside day. Overnight strength sets the stage for a higher opening when the day session begins trading. Stochastics and the RSI are neutral to bearish signaling that sideways to lower prices are possible near-term. If March extends Thursday's decline, the November 30th low crossing at 0.072510 is the next downside target. If March renews the rally off October's, the 87% retracement level of the August-October decline crossing at 0.076735 is the next upside target. First resistance is the December 2nd high crossing at 0.075820. Second resistance is the 87% retracement level of the August-October decline crossing at 0.076735. First support is the November 30th low crossing at 0.072510. Second support is the November 21's low crossing at 0.071410.
PRECIOUS METALS http://quotes.ino.com/ex changes/?c=metals"
PRECIOUS METALS: Februarygold was higher overnight and is working on a possible inside day as it consolidates some of the decline off Tuesday's high. Overnight trading sets the stage for a higher opening when the day session begins trading. Stochastics and the RSI have turned neutral to bearish signaling that sideways to lower prices are possible near-term. Closes below the 20-day moving average crossing at $1785.10 would confirm that a short-term top has been posted. If February extends the rally off November's low, the 50% retracement level of the March-October decline crossing at $1861.40 is the next upside target. First resistance is Tuesday's high crossing at $1836.90. Second resistance is the 50% retracement level of the March-October decline crossing at $1861.40. First support is the 20-day moving average crossing at $1785.10. Second support is the November 23rd low crossing at $1733.50.
March silver was lower overnight as it extends the decline off Tuesday's high. Overnight trading sets the stage for a lower opening when the day session begins trading later this morning. Stochastics and the RSI are turning neutral to bearish signaling that sideways to lower prices are possible near-term. Closes below the 20-day moving average crossing at $22.479 would confirm that a short-term top has been posted. If March resumes the rally off October's low, the 75% retracement level of the March-August decline crossing at $24.779 is the next upside target. First resistance is the 75% retracement level of the March-August decline crossing at $24.779. Second resistance is the 87% retracement level of the March-August decline crossing at $25.938. First support the 20-day moving average crossing at $22.479. Second support is the 50-day moving average crossing at $21.040.
March copper was lower overnight as it extends this month's trading range. The mid-range overnight trade sets the stage for a steady to lower opening when the day session begins trading. Stochastics and the RSI are turning neutral to bearish signaling that sideways to lower prices are possible near-term. Closes below the 20-day moving average crossing at 3.7512 would signal that a short-term top has been posted. If March resumes the rally off the November 28th low, the 50% retracement level of the March-July decline crossing at 4.0343 is the next upside target. First resistance is November's high crossing at 3.9470. Second resistance is the 50% retracement level of the March-July decline crossing at 4.0343. First support is the 20-day moving average crossing at 3.7512. Second support is the 50-day moving average crossing at 3.6148.
GRAINS http://quotes.ino.com/ex changes/?c=grains
March corn was lower overnight as it consolidates below the 20-day moving average crossing at $6.55 1/2. Overnight trading sets the stage for a lower opening when the day sessions begins trading. Stochastics and the RSI are neutral signaling that sideways trading is possible near-term. Closes above the 20-day moving average crossing at $6.55 1/2 would signal that a short-term low has been posted while opening the door for additional short-covering gains. If March renews the decline off the October 31st high, the 62% retracement level of the July-October rally crossing at $6.23 is the next downside target. First resistance is the 20-day moving average crossing at $6.55 1/4. Second resistance is the 50-day moving average crossing at $6.73 1/2. First support is last-Wednesday's low crossing at $6.35. Second support is the 62% retracement level of the July-October rally crossing at $6.23.
March wheat was higher overnight as it consolidates above the 75% retracement level of the 2020-2022 rally crossing at $7.24 1/4. Overnight trading sets the stage for a higher opening when the day session begins trading. Stochastics and the RSI are neutral to bullish signaling that sideways to higher prices are possible near-term. Closes above the 20-day moving average crossing at $7.71 1/2 would signal that a short-term low has been posted. If March renews the decline off October's high, the 87% retracement level of the 2020-2022 rally crossing at $6.36 1/4 is the next downside target. First resistance is the 20-day moving average crossing at $7.71 1/2. Second resistance is the 50-day moving average crossing at $8.29. First support is the 75% retracement level of the 2020-2022 rally crossing at $7.24 1/4. Second support is the 87% retracement level of the 2020-2022 rally crossing at $6.36 1/4.
March Kansas City wheat was steady to fractionally higher overnight. Overnight trading sets the stage for a steady to slightly higher opening when the day session begins trading later this morning. Stochastics and the RSI are neutral to bullish signaling that sideways to higher prices are possible near-term. Closes above the 20-day moving average crossing at $8.76 1/2 would signal that a short-term low has been posted. If March resumes the decline off October's high, August's low crossing at $8.11 3/4 is the next downside target. First resistance is the 20-day moving average crossing at $8.76 1/4. Second resistance is the 50-day moving average crossing at $9.21. First support is last-Tuesday's low crossing at $8.21 3/4. Second support is August's low crossing at $8.11 3/4.
March Minneapolis wheat was lower overnight and sets the stage for a lower opening when the day session begins trading. Stochastics and the RSI are neutral to bullish signaling that sideways to higher prices are possible near-term. Closes above the 20-day moving average crossing at $9.27 would signal that a short-term low has been posted. If March renews the decline off November's high, August's low crossing at $8.75 3/4 is the next downside target. First resistance is the 20-day moving average crossing at $9.27. Second resistance is the 50-day moving average crossing at $9.52 1/4. First support is last-Tuesday's low crossing at $8.90. Second support is August's low crossing at $8.75 3/4.
SOYBEAN COMPLEX? http://quotes.ino.com/ex?changes/?c=grains "
January soybeans were lower overnight and sets the stage for a lower opening as it extends the trading range of the past seven-days. Stochastics and the RSI are turning neutral to bearish signaling that sideways to lower prices are possible near-term. Closes below the 20-day moving average crossing at $14.56 would signal that a short-term top has been posted. If January renews the rally off October's low, September's high crossing at $15.12 1/4 is the next upside target. First resistance is the September 21st high crossing at $14.93 1/2. Second resistance is September's high crossing at $15.12 1/4. First support is the 20-day moving average crossing at $14.56. Second support is the 50-day moving average crossing at $14.31 1/2.
January soybean meal was steady to slightly higher overnight. Overnight trading sets the stage for a slightly higher opening when the day session begins trading. Stochastics and the RSI are turning neutral signaling that sideways trading is possible near-term. If January renews the rally off November's low, monthly resistance on the continuation chart crossing at $478.60 is the next upside target is the next upside target. Closes below Monday's low crossing at $448.60 would signal that a short-term top has been posted. First resistance is last-Friday's high crossing at $474.40. Second resistance is monthly resistance on the continuation chart crossing at $478.60. First support is Monday's low crossing at $448.60. Second support is the 20-day moving average crossing at $433.40.
January soybean oil was lower overnight as it consolidated some of the rally off Monday's low. Overnight trading sets the stage for a lower opening when the day session begins trading. Stochastics and the RSI are turning neutral to bearish signaling that sideways to lower prices are possible near-term. If January renews the decline off November's high, the 87% retracement level of the July-November rally crossing at 57.11 is the next downside target. Closes above the 20-day moving average crossing at 66.53 would signal that a short-term low has been posted. First resistance is the 20-day moving average crossing at 66.53. Second resistance is the 50-day moving average crossing at 68.43. First support is Monday's low crossing at 58.94. Second support is the 87% retracement level of the July-November rally crossing at 57.11.
Thanks much tallpine!
Extreme volatility in NG with extreme cold on the way all dialed in and the huge warm up following that now the focus of the trade.
Spike down -$7,000/contract at one point and closing the upside breakaway gap from Sunday Night. WOW!
Normally, this formation signals the gap to be a buying exhaustion gap, when panic buyers(that caused the gap higher) run out of steam and the market collapses lower from overwhelming selling that causes the price to go below the bottom of the gap higher/fill the gap.......however, the insane price movements in NG don't abide by technical signatures on price charts and if the moderation expected doesn't happen, then we can go back higher again.
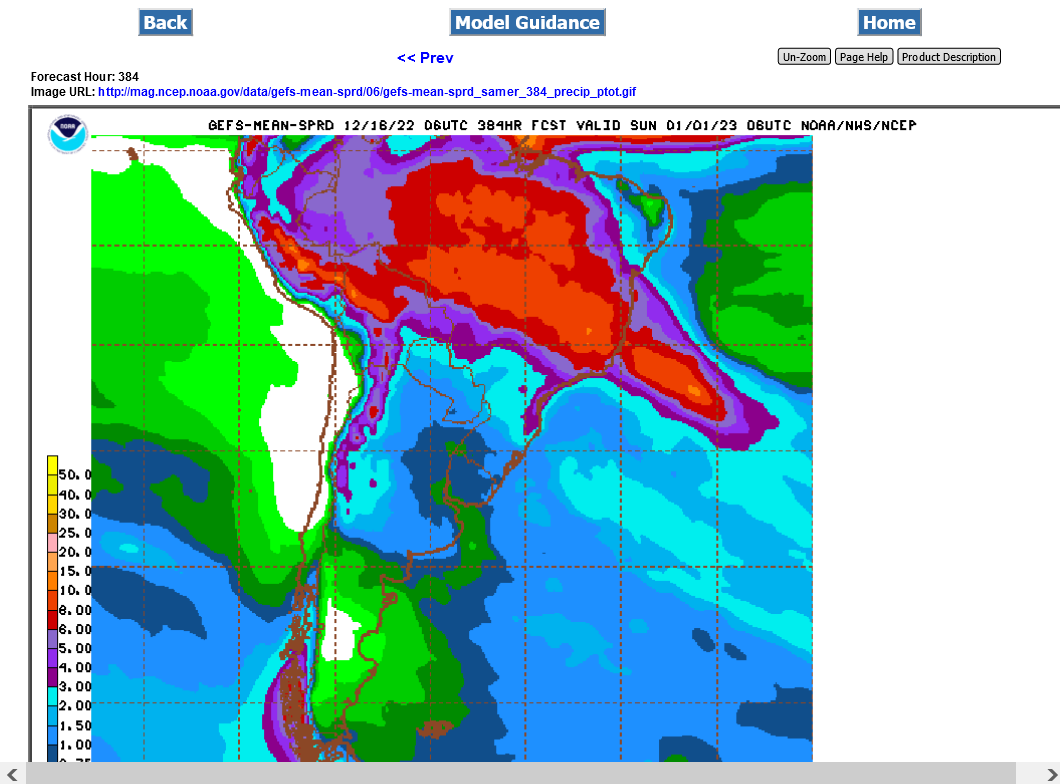
Weather in Argentina still bullish/too dry with their drought:
2 week rains from the 6z GEFS below. Less than an inch in much of the key Argentina bean areas.
https://mag.ncep.noaa.gov/Image.php
https://www.cpc.ncep.noaa.gov/products/Precip_Monitoring/Figures/global/n.90day.figb.gif
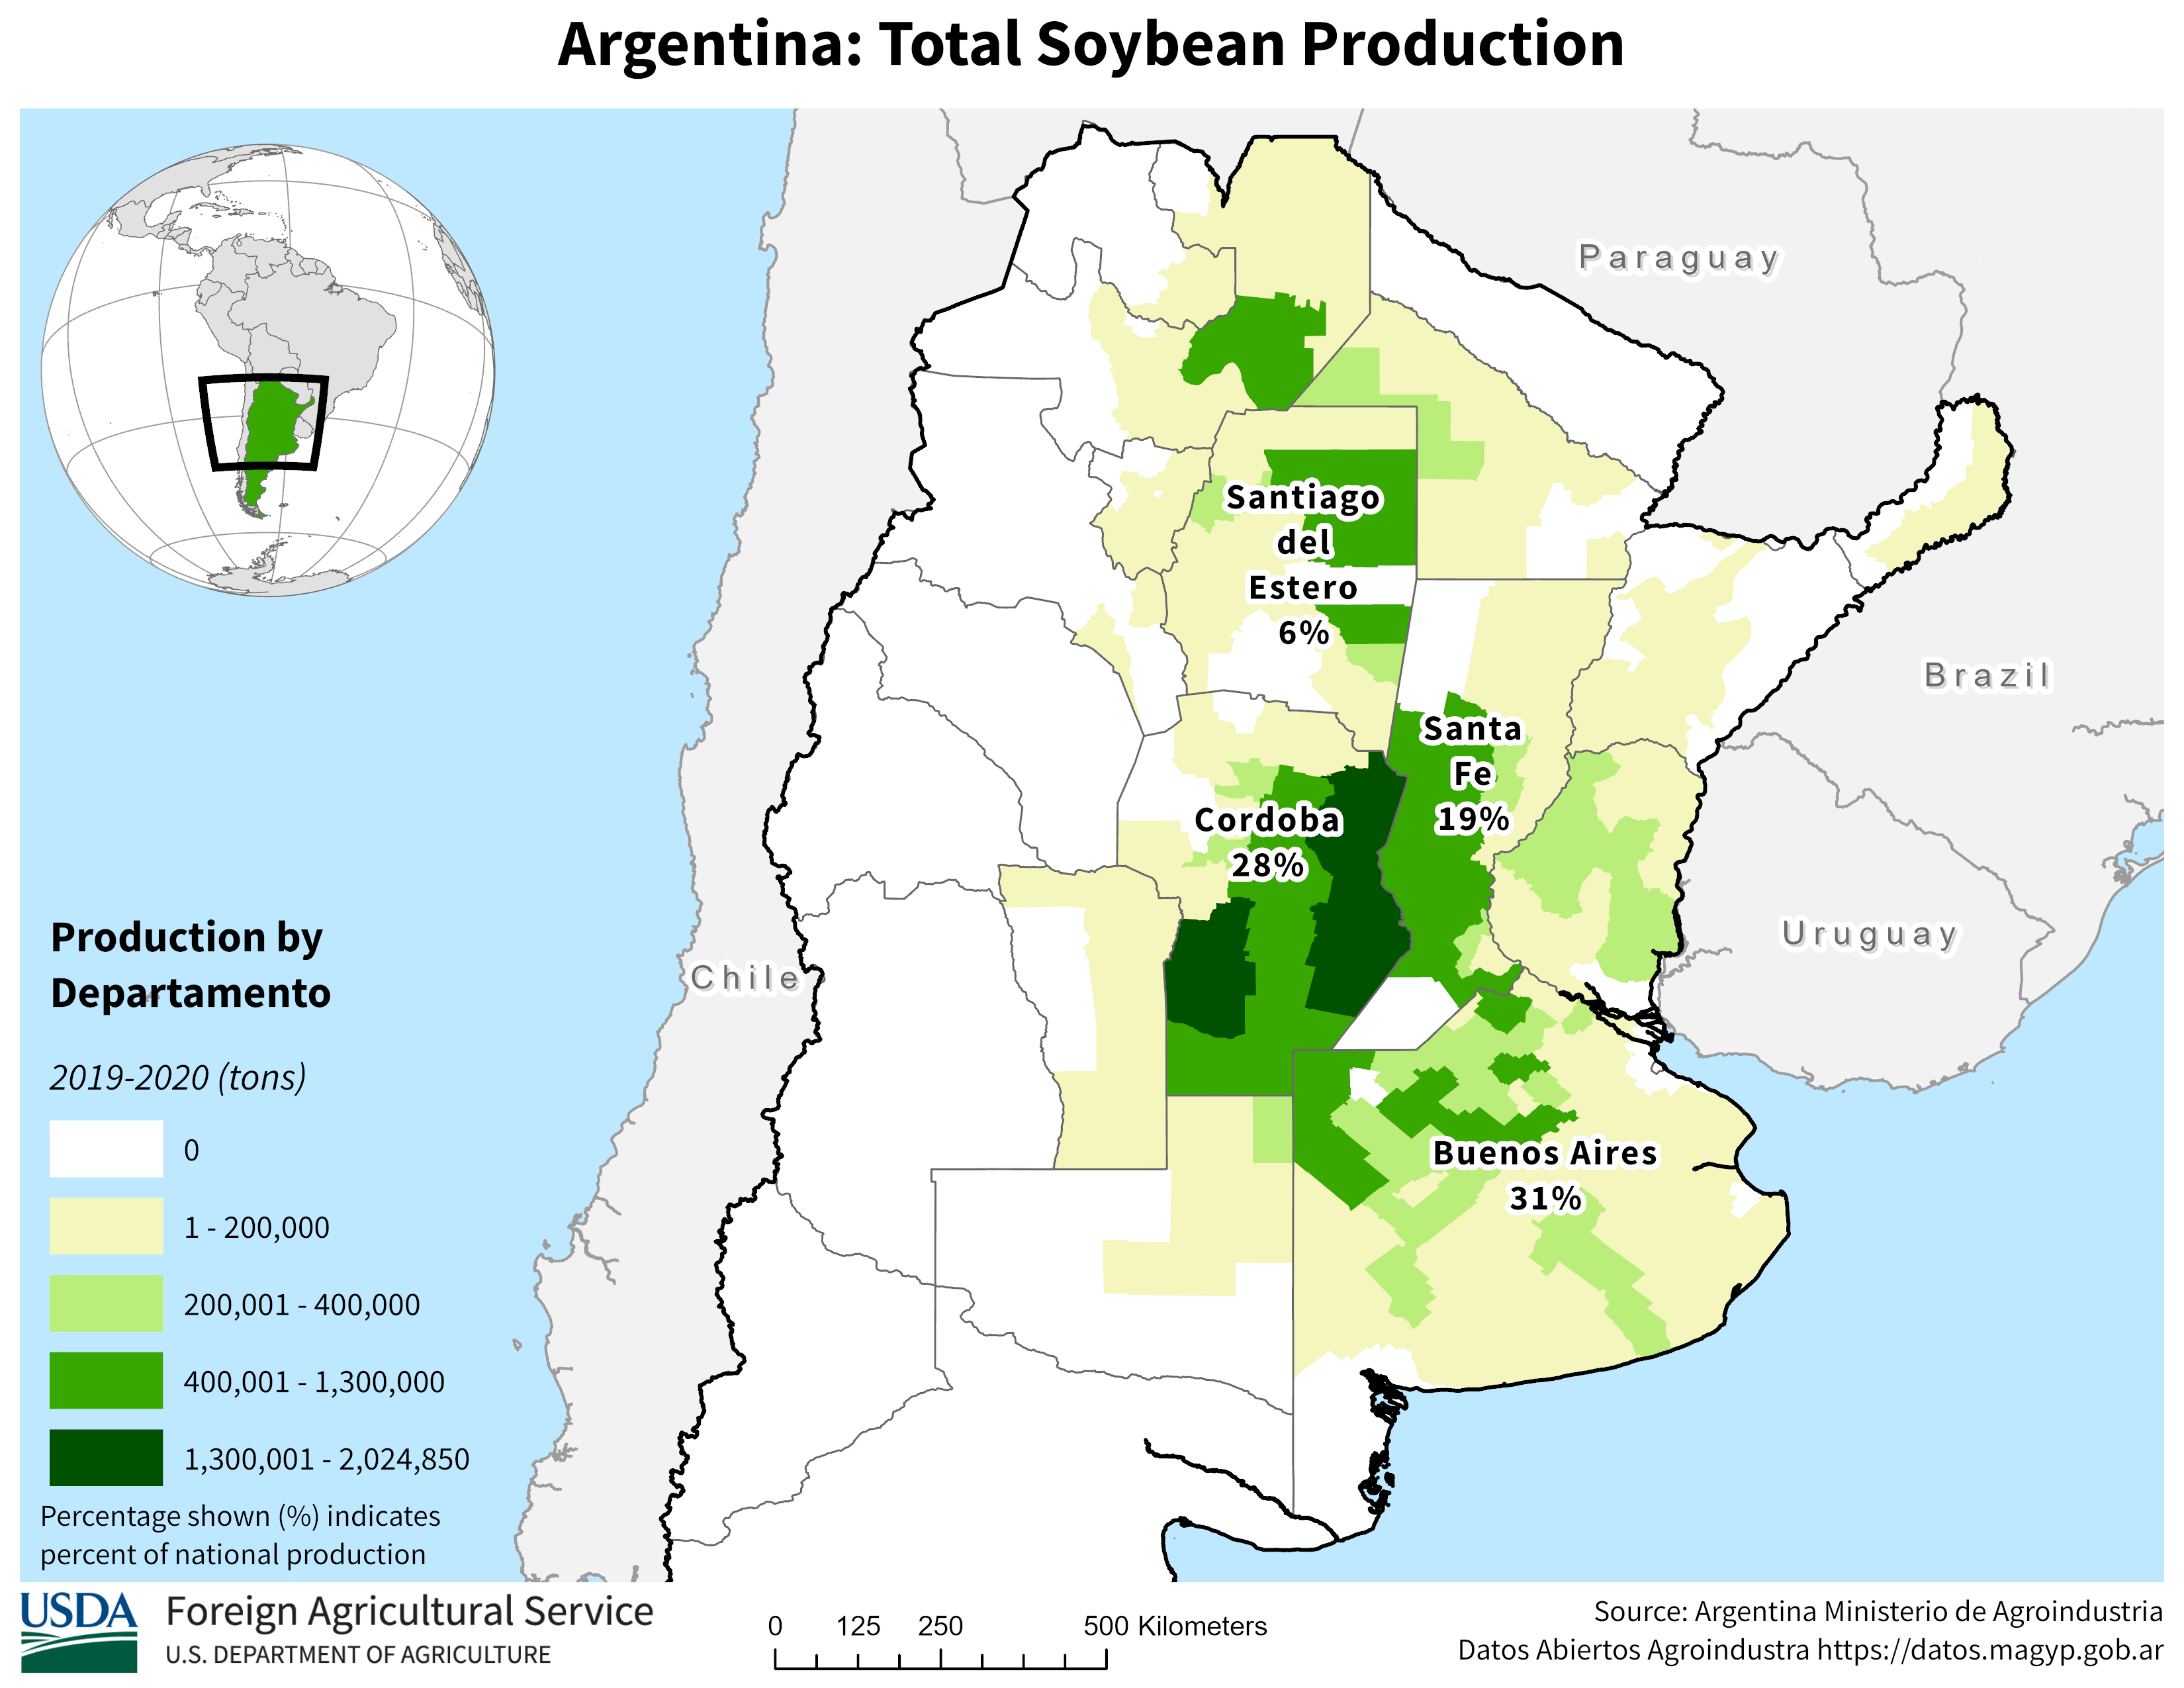
South America soybean production below
https://ipad.fas.usda.gov/rssiws/al/ssa_cropprod.aspx

https://ipad.fas.usda.gov/rssiws/al/crop_production_maps/Brazil/Municipality/Brazil_Soybean.png
