KEY EVENTS TO WATCH FOR:
Monday, December 19, 2022
10:00 AM ET. December NAHB Housing Market Index
Housing Mkt Idx (previous 33)
Tuesday, December 20, 2022
8:30 AM ET. November New Residential Construction - Housing Starts and Building Permits
Total Starts (previous 1.425M)
Housing Starts, M/M% (previous -4.2%)
Building Permits (previous 1.526M)
Building Permits, M/M% (previous -2.4%)
8:55 AM ET. Johnson Redbook Retail Sales Index
Ret Sales Mo-to-Date, M/M%
Ret Sales Mo-to-Date, Y/Y% (previous +5.8%)
Latest Wk, Y/Y% (previous +5.9%)
4:30 PM ET. API Weekly Statistical Bulletin
Crude Stocks, Net Chg (Bbls) (previous +7.8M)
Gasoline Stocks, Net Chg (Bbls) (previous +0.9M)
Distillate Stocks, Net Chg (Bbls) (previous +3.9M)
Wednesday, December 21, 2022
7:00 PM ET. MBA Weekly Mortgage Applications Survey
Composite Idx (previous 210.7)
Composite Idx, W/W% (previous +3.2%)
Purchase Idx-SA (previous 182.6)
Purchase Idx-SA, W/W% (previous +4.0%)
Refinance Idx (previous 350.5)
Refinance Idx, W/W% (previous +2.8%)
8:30 AM ET. 3rd Quarter International Transactions
Current Account (USD) (previous -251.09B)
10:00 AM ET. November Existing Home Sales
Existing Sales (previous 4.43M)
Existing Sales, M/M% (previous -5.9%)
Unsold Homes Month's Supply (previous 3.3)
Median Price (USD) (previous 379100)
Median Home Price, Y/Y% (previous +6.6%)
10:00 AM ET. December Consumer Confidence Index
Cons Conf Idx (previous 100.2)
Expectation Idx
Present Situation Idx (previous 137.4)
10:30 AM ET. EIA Weekly Petroleum Status Report
Crude Oil Stocks (Bbl) (previous 424.129M)
Crude Oil Stocks, Net Chg (Bbl) (previous +10.231M)
Gasoline Stocks (Bbl) (previous 223.583M)
Gasoline Stocks, Net Chg (Bbl) (previous +4.496M)
Distillate Stocks (Bbl) (previous 120.171M)
Distillate Stocks, Net Chg (Bbl) (previous +1.364M)
Refinery Usage (previous 92.2%)
Total Prod Supplied (Bbl/day) (previous 19.956M)
Total Prod Supplied, Net Chg (Bbl/day) (previous +0.33M)
Thursday, December 22, 2022
8:30 AM ET. U.S. Weekly Export Sales
8:30 AM ET. Unemployment Insurance Weekly Claims Report - Initial Claims
Jobless Claims (previous 211K)
Jobless Claims, Net Chg (previous -20K)
Continuing Claims (previous 1671000)
Continuing Claims, Net Chg (previous +1K)
8:30 AM ET. November CFNAI Chicago Fed National Activity Index
NAI (previous -0.05)
NAI, 3-mo Moving Avg (previous 0.09)
8:30 AM ET. 3rd Quarter Revised Corporate Profits
8:30 AM ET. 3rd Quarter 3rd estimate GDP
Annual Rate, Q/Q% (previous +2.9%)
Chain-Weighted Price Idx, Q/Q% (previous +4.3%)
Corporate Profits, Q/Q%
PCE Price Idx, Q/Q% (previous +4.3%)
Purchase Price Idx, Q/Q% (previous +4.7%)
Real Final Sales, Q/Q% (previous +4%)
Core PCE Price Idx, Ex-Food/Energy, Q/Q% (previous +4.6%)
Personal Consumption, Q/Q% (previous +1.7%)
10:00 AM ET. November Leading Indicators
Leading Index, M/M% (previous -0.8%)
Leading Index
Coincident Index, M/M% (previous +0.2%)
Lagging Index, M/M% (previous +0.1%)
10:30 AM ET. EIA Weekly Natural Gas Storage Report
Working Gas In Storage (Cbf) (previous 3412B)
Working Gas In Storage, Net Chg (Cbf) (previous -50B)
11:00 AM ET. Dec. Federal Reserve Bank of Kansas City Survey of Tenth District Manufacturing
Mfg Activity Idx (previous -10)
6-Mo Exp Prod Idx (previous 6)
Mfg Composite Idx (previous -6)
6-Mo Exp Composite Idx (previous 0)
4:30 PM ET. Foreign Central Bank Holdings
4:30 PM ET. Federal Discount Window Borrowings
Friday, December 23, 2022
8:30 AM ET. November Personal Income & Outlays
Personal Income, M/M% (previous +0.7%)
Consumer Spending, M/M% (previous +0.8%)
PCE Price Idx, M/M% (previous +0.3%)
PCE Price Idx, Y/Y% (previous +6%)
PCE Core Price Idx, M/M% (previous +0.2%)
PCE Core Price Idx, Y/Y% (previous +5%)
8:30 AM ET. November Advance Report on Durable Goods
Durable Goods-SA, M/M% (previous +1.0%)
Dur Goods, Ex-Defense, M/M% (previous +0.8%)
Dur Goods, Ex-Transport, M/M% (previous +0.5%)
Orders: Cap Gds, Non-Def, Ex-Air, M/M%(previous +0.7%)
Shipmnts: Cap Gds, Non-Def, Ex-Air, M/M% (previous +1.3%)
10:00 AM ET. November New Residential Sales
New Home Sales (previous 632K)
New Home Sales, M/M% (previous +7.5%)
New Home Sales Months Supply (previous 8.9)
10:00 AM ET. 3rd Quarter GDP by State
10:00 AM ET. 3rd Quarter State Quarterly Personal Income
10:00 AM ET. December University of Michigan Survey of Consumers - final
End-Mo Sentiment Idx (previous 56.8)
End-Mo Expectations Idx (previous 55.6)
12-Month Inflation Forecast (previous 4.9%)
5-Year Inflation Forecast (previous 3.0%)
End-Mo Current Idx (previous 58.8)
The STOCK INDEXES? http://quotes.ino.com/ex?changes/?c=indexes
The STOCK INDEXES: The March NASDAQ 100 was higher overnight as it consolidated some of the decline off last-Tuesday's high. Overnight trading sets the stage for a higher opening when the day session begins trading.Stochastics and the RSI are oversold but remain neutral to bearish signaling that sideways to lower prices are possible near-term. If March extends the decline off last-Tuesday's high, the November 9th low crossing at 10,932.75 is the next downside target. Closes above the 20-day moving average crossing at 11,790.83 would signal that a short-term low has been posted. First resistance is the 20-day moving average crossing at 11,790.83. Second resistance is the 50% retracement level of the August-October crossing at 12,229.32. First support is the November 9th low crossing at 10,932.75. Second support is November's low crossing at 10,746.75.
The March S&P 500 was higher overnight as it consolidates some of the decline off last-Tuesday's high. Overnight trading sets the stage for a higher opening when the day session begins trading. Stochastics and the RSI are oversold but remain neutral to bearish signaling that sideways to lower prices are possible near-term. If March extends the aforementioned decline, the November 9th low crossing at 3735.00 is the next downside target. Closes above the 20-day moving average crossing at 4013.04 would signal that a short-term low has been posted. First resistance is the 20-day moving average crossing at 4013.04. Second resistance is the 75% retracement level of the August-October decline crossing at 4153.96. First support is the November 9th low crossing at 3735.00. Second support is November's low crossing at 3735.00.
INTEREST RATES http://quotes.ino.com/ex changes/?c=interest"
INTEREST RATES: March T-bonds was lower overnight as it consolidates some of its recent gains. Overnight trading sets the stage for a lower opening when the day session begins trading. Stochastics and the RSI are overbought, diverging and are turning neutral to bearish signaling that sideways to lower prices are possible near-term. Closes below the 20-day moving average crossing at 129-07 would signal that a short-term top has been posted. If March extends the rally off October's low, the 62% retracement level of the August-October decline crossing at 133-30 is the next upside target. First resistance is last-Thursday's high crossing at 132-15. Second resistance is the 62% retracement level of the August-October decline crossing at 133-30. First support is the 20-day moving average crossing at 129-07. Second support is the 50-day moving average crossing at 124-30.
March T-notes were lower overnight and sets the stage for a lower opening when the day session begins trading. Stochastics and the RSI are overbought, diverging and are turned neutral to bearish signaling that sideways to lower prices are possible near-term. Closes below the 20-day moving average crossing at 114.010 would signal that a short-term top has been posted. If March extends the rally off October's low, the 62% retracement level of the August-October decline crossing at 116.232 is the next upside target. First resistance is the 50% retracement level of the August-October decline crossing at 115.090. Second resistance is the 62% retracement level of the August-October decline crossing at 116.232. First support is the 20-day moving average crossing at 114.010. Second support is the 50-day moving average crossing at 112.125.
ENERGY MARKETS? http://quotes.ino.com/ex?changes/?c=energy ""
ENERGIES:Januarycrude oil was steady to slightly higher overnight. Overnight trading sets the stage for a steady to slightly higher opening when the day session begins trading. Stochastics and the RSI are turning neutral to bearish signaling that sideways to lower prices are possible near-term. If January renews the decline November's high, the 62% retracement level of the 2020-2022 rally crossing at $63.80 is the next downside target. Closes above last-Thursday's high crossing at $77.77 would signal that a short-term low has been posted while opening the door for additional gains near-term. First resistance is last-Thursday's high crossing at $77.77. Second resistance is the 50-day moving average crossing at $81.98. First support is the December 9th low crossing at $70.08. Second support is the 62% retracement level of the 2020-2022 rally crossing at $63.80.
January heating oil was higher overnight as it consolidates some of last-Friday's decline. Overnight trading sets the stage for a steady to higher opening when the day session begins trading. Stochastics and the RSI are neutral to bearish signaling that sideways to lower prices are possible near-term. Closes below the 10-day moving average crossing at $3.0271 would signal that a short-term top has been posted. If January renews last-week's rally, the 50-day moving average crossing at $3.3570 is the next upside target. First resistance is the 50-day moving average crossing at $3.3570. Second resistance is December's high crossing at $3.4103. First support is the 10-day moving average crossing at $3.0271. Second support is December's low crossing at $2.7647.
January unleaded gas was higher overnight as it consolidates some of the decline off last-Wednesday's high. Overnight trading sets the stage for a steady to higher opening when the day session begins trading. Stochastics and the RSI are turning neutral to bearish signaling that sideways to lower prices are possible near-term. If January renews the decline off November's high, the 50% retracement level of the 2020-2022 rally crossing at $1.9894 is the next downside target. Closes above the 20-day moving average crossing at $2.2353 would signal that a short-term low has been posted. First resistance is the 20-day moving average crossing at $2.2353. Second resistance is the 50-day moving average crossing at $2.3747. First support is last-Monday's low crossing at $2.0204. Second support is the 50% retracement level of the 2020-2022 rally crossing at $1.9894.
January natural gas was lower overnight as it extends the decline off last-Tuesday's high. Overnight trading sets the stage for a lower opening when the day session begins trading. Stochastics and the RSI are turning neutral to bearish signaling that sideways to lower prices are possible near-term. Closes below the 10-day moving average crossing at 6.313 would temper the near-term friendly outlook. If January renews the rally off November's low, the August-November downtrend line crossing near 7.665 is the next upside target. First resistance is last-Tuesday's high crossing at 7.105. Second resistance is the August-November downtrend line crossing near 7.665. First support is the 10-day moving average crossing at 6.313. Second support is the 62% retracement level of the 2020-2022 rally crossing at 5.500.
CURRENCIEShttp://quotes.ino.com/ex changes/?c=currencies"
CURRENCIES:The March Dollar was lower overnight. Overnight trading sets the stage for a steady to lower opening when the day session begins trading. Stochastics and the RSI are turning neutral to bullish signaling that sideways to higher prices are possible near-term. Closes above the 20-day moving average crossing at $104.925 would signal that a short-term low has been posted. If March extends the decline off September's high, the 75% retracement level of the March-September rally crossing at $101.331 is the next downside target. First resistance is the 20-day moving average crossing at $104.925. Second resistance is the November 30th high crossing at $106.775. First support is last-Thursday's low crossing at $102.875. Second support is the 75% retracement level of the March-September rally crossing at $101.331.
The March Euro was steady to slightly higher overnight and sets the stage for a steady to slightly higher opening when the day session begins trading. Stochastics and the RSI are turning neutral to bearish signaling that sideways to lower prices are possible near-term. Closes below the 20-day moving average crossing at $1.05643 would signal that a short-term top has been posted. If March extends the rally off September's low, the March 31st high crossing at $1.09680 is the next upside target. First resistance is the 25% retracement level of the 2021-2022 crossing at $1.08062. Second resistance is the March 31st high crossing at $1.09680. First support is the 20-day moving average crossing at $1.05643. Second support is the November 30th low crossing at $1.03715.
The March British Pound was steady to slightly higher overnight and sets the stage for a slightly higher opening when the day session begins trading. Stochastics and the RSI have turned neutral to bearish signaling that sideways to lower prices are possible near-term. Closes below the 20-day moving average crossing at 1.2184 would signal that a short-term top has been posted. If March extends the rally off September's low, the 62% retracement level of the 2021-2022 decline crossing at 1.2770 is the next upside target. First resistance is last-Tuesday's high crossing at 1.2477. Second resistance is the 62% retracement level of the 2021-2022 decline crossing at 1.2770. First support is the 20-day moving average crossing at 1.2184. Second support is the November 30th low crossing at 1.1937.
The March Swiss Franc was slightly higher overnight as it consolidates some of the decline off last-Wednesday's high. Overnight trading sets the stage for a steady to higher opening when the day session begins trading. Stochastics and the RSI are turning neutral to bearish signaling that sideways to lower prices are possible near-term. Closes below the 20-day moving average crossing at 1.07637 would temper the near-term friendly outlook. If March extends the rally off the November 21st low, the 62% retracement level of the 2021-2022 decline crossing at 1.10351 is the next upside target. First resistance is last-Wednesday's high crossing at 1.09665. Second resistance is the 62% retracement level of the 2021-2022 decline crossing at 1.10351. First support is the 20-day moving average crossing at 1.07637. Second support is the November 30th low crossing at 1.06060.
The March Canadian Dollar was steady to higher overnight as it consolidates some of last-Friday's decline while extending the trading range of the past two-weeks. Overnight trading sets the stage for a steady to slightly higher opening when the day session begins trading. Stochastics and the RSI are oversold but remain neutral to bearish signaling that sideways to lower prices are possible near-term. If March extends the decline off November's high, November's low crossing at $72.44 is the next downside target. Closes above the 20-day moving average crossing at $73.95 would signal that a short-term low has been posted. First resistance is the 20-day moving average crossing at $73.95. Second resistance is the December 5th high crossing at $74.82. First support is last-Friday's low crossing at $73.04. Second support is November low crossing at $72.58.
The March Japanese Yen was steady to slightly higher overnight and the overnight strength sets the stage for a steady to higher opening when the day session begins trading. Stochastics and the RSI are neutral to bearish signaling that sideways to lower prices are possible near-term. If March extends last-Thursday's decline, the November 30th low crossing at 0.072510 is the next downside target. If March renews the rally off October's, the 87% retracement level of the August-October decline crossing at 0.076735 is the next upside target. First resistance is the December 2nd high crossing at 0.075820. Second resistance is the 87% retracement level of the August-October decline crossing at 0.076735. First support is the November 30th low crossing at 0.072510. Second support is the November 21st low crossing at 0.071410.
PRECIOUS METALS http://quotes.ino.com/ex changes/?c=metals"
PRECIOUS METALS: Februarygold was higher overnight as it consolidates some of the decline off last-Tuesday's high. Overnight trading sets the stage for a steady to higher opening when the day session begins trading. Stochastics and the RSI are neutral to bearish signaling that sideways to lower prices are possible near-term. Closes below the 20-day moving average crossing at $1787.30 would confirm that a short-term top has been posted. If February renews the rally off November's low, the 50% retracement level of the March-October decline crossing at $1861.40 is the next upside target. First resistance is last-Tuesday's high crossing at $1836.90. Second resistance is the 50% retracement level of the March-October decline crossing at $1861.40. First support is the 20-day moving average crossing at $1787.30. Second support is the November 23rd low crossing at $1733.50.
March silver was higher overnight as it consolidates some of the decline off last-Tuesday's high. Overnight trading sets the stage for a steady to higher opening when the day session begins trading later this morning. Stochastics and the RSI have turned neutral to bearish signaling that sideways to lower prices are possible near-term. Closes below the 20-day moving average crossing at $22.605 would confirm that a short-term top has been posted. If March resumes the rally off October's low, the 75% retracement level of the March-August decline crossing at $24.779 is the next upside target. First resistance is the 75% retracement level of the March-August decline crossing at $24.779. Second resistance is the 87% retracement level of the March-August decline crossing at $25.938. First support the 20-day moving average crossing at $22.605. Second support is the 50-day moving average crossing at $21.106.
March copper was higher overnight as it extends this month's trading range. The mid-range overnight trade sets the stage for a higher opening when the day session begins trading. Stochastics and the RSI are neutral to bearish signaling that sideways to lower prices are possible near-term. Closes below the 20-day moving average crossing at 3.7588 would signal that a short-term top has been posted. If March resumes the rally off the November 28th low, the 50% retracement level of the March-July decline crossing at 4.0343 is the next upside target. First resistance is November's high crossing at 3.9470. Second resistance is the 50% retracement level of the March-July decline crossing at 4.0343. First support is the 20-day moving average crossing at 3.7588. Second support is the 50-day moving average crossing at 3.6233.
GRAINS http://quotes.ino.com/ex changes/?c=grains
March corn was lower overnight as it consolidates below the 20-day moving average crossing at $6.54 1/2. Overnight trading sets the stage for a lower opening when the day sessions begins trading. Stochastics and the RSI are neutral to bearish signaling that sideways to lower prices are possible near-term. If March renews the decline off the October 31st high, the 62% retracement level of the July-October rally crossing at $6.23 is the next downside target. Closes above the 20-day moving average crossing at $6.54 1/2 would signal that a short-term low has been posted while opening the door for additional short-covering gains. First resistance is the 20-day moving average crossing at $6.54 1/4. Second resistance is the 50-day moving average crossing at $6.72 1/2. First support is the December 7th low crossing at $6.35. Second support is the 62% retracement level of the July-October rally crossing at $6.23.
March wheat was higher overnight as it consolidates above the 75% retracement level of the 2020-2022 rally crossing at $7.24 1/4. Overnight trading sets the stage for a steady to higher opening when the day session begins trading. Stochastics and the RSI are neutral to bullish signaling that sideways to higher prices are possible near-term. Closes above the 20-day moving average crossing at $7.68 would signal that a short-term low has been posted. If March renews the decline off October's high, the 87% retracement level of the 2020-2022 rally crossing at $6.36 1/4 is the next downside target. First resistance is the 20-day moving average crossing at $7.68. Second resistance is the 50-day moving average crossing at $8.26 1/4. First support is the 75% retracement level of the 2020-2022 rally crossing at $7.24 1/4. Second support is the 87% retracement level of the 2020-2022 rally crossing at $6.36 1/4.
March Kansas City wheat was lower overnight and sets the stage for a steady to lower opening when the day session begins trading later this morning. Stochastics and the RSI are turning neutral to bearish signaling that sideways to lower prices are possible near-term. If March resumes the decline off October's high, August's low crossing at $8.11 3/4 is the next downside target. Closes above the 20-day moving average crossing at $8.71 1/2 would signal that a short-term low has been posted. First resistance is the 20-day moving average crossing at $8.71 1/2. Second resistance is the 50-day moving average crossing at $9.18. First support is the December 6th low crossing at $8.21 3/4. Second support is August's low crossing at $8.11 3/4.
March Minneapolis wheat was higher overnight and sets the stage for a steady to slightly higher opening when the day session begins trading. Stochastics and the RSI are neutral to bullish signaling that sideways to higher prices are possible near-term. Closes above the 20-day moving average crossing at $9.24 1/4 would signal that a short-term low has been posted. If March renews the decline off November's high, August's low crossing at $8.75 3/4 is the next downside target. First resistance is the 20-day moving average crossing at $9.24 1/4. Second resistance is the 50-day moving average crossing at $9.51. First support is the December 6th low crossing at $8.90. Second support is August's low crossing at $8.75 3/4.
SOYBEAN COMPLEX? http://quotes.ino.com/ex?changes/?c=grains "
January soybeans were lower overnight and sets the stage for a lower opening as it extends the trading range of the past eight-days. Stochastics and the RSI are turning neutral to bearish signaling that sideways to lower prices are possible near-term. Closes below the 20-day moving average crossing at $14.58 3/4 would signal that a short-term top has been posted. If January renews the rally off October's low, September's high crossing at $15.12 1/4 is the next upside target. First resistance is the September 21st high crossing at $14.93 1/2. Second resistance is September's high crossing at $15.12 1/4. First support is the 20-day moving average crossing at $14.58 3/4. Second support is the 50-day moving average crossing at $14.33 3/4.
March soybean meal was lower overnight. Overnight trading sets the stage for a sharply lower opening when the day session begins trading. Stochastics and the RSI are diverging and are turning neutral to bearish signaling that sideways to lower prices are possible near-term. Closes below last-Monday's low crossing at $446.40 would signal that a short-term top has been posted. If March renews the rally off November's low, monthly resistance on the continuation chart crossing at $478.60 is the next upside target is the next upside target. First resistance is the December 9th high crossing at $469.30. Second resistance is monthly resistance on the continuation chart crossing at $478.60. First support is last- Monday's low crossing at $446.40. Second support is the 20-day moving average crossing at $433.50.
March soybean oil was higher overnight. Overnight trading sets the stage for a higher opening when the day session begins trading. Stochastics and the RSI are turning neutral to bullish signaling that sideways to higher prices are possible near-term. Closes above the 20-day moving average crossing at 65.10 would signal that a short-term low has been posted. If March renews the decline off November's high, the 87% retracement level of the July-November rally crossing at 56.49 is the next downside target. First resistance is the 20-day moving average crossing at 65.10. Second resistance is the 50-day moving average crossing at 66.75. First support is last-Monday's low crossing at 58.50. Second support is the 87% retracement level of the July-November rally crossing at 56.49.
Thanks tallpine!
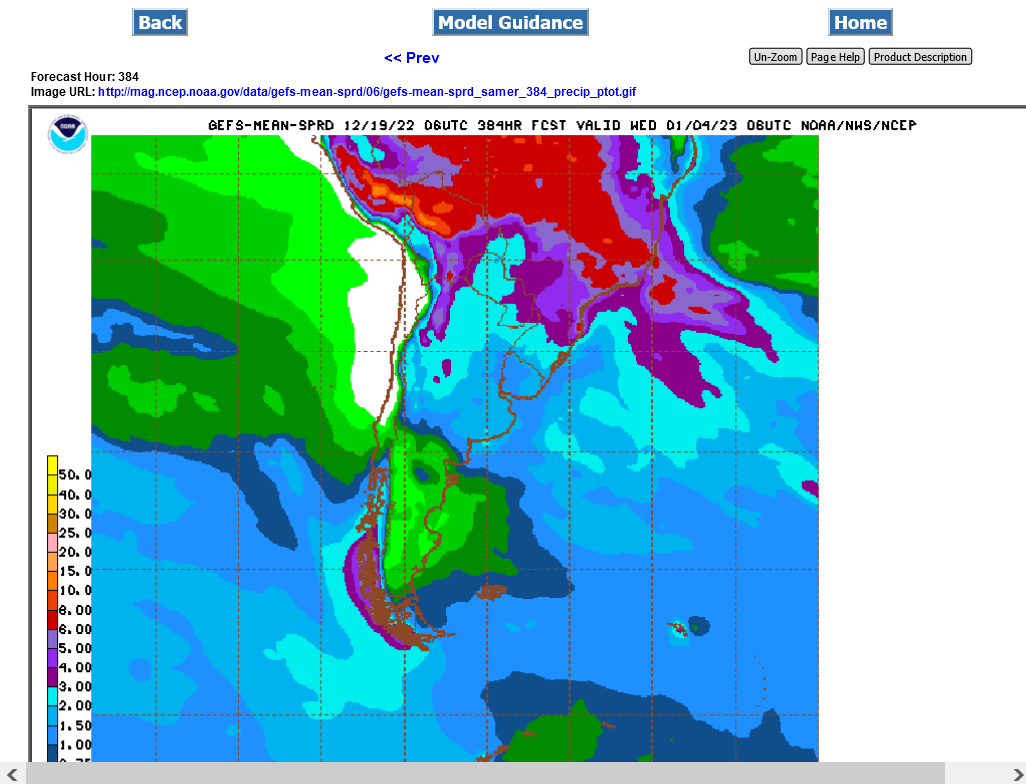
A tad less rain in the Argentina forecast compared to yesterday evening but still more than last week:
NG reacting to the huge moderation in temps after this intense cold blast.
