Previous thread:
12-12-22 ALERT: Bitter cold coming!!
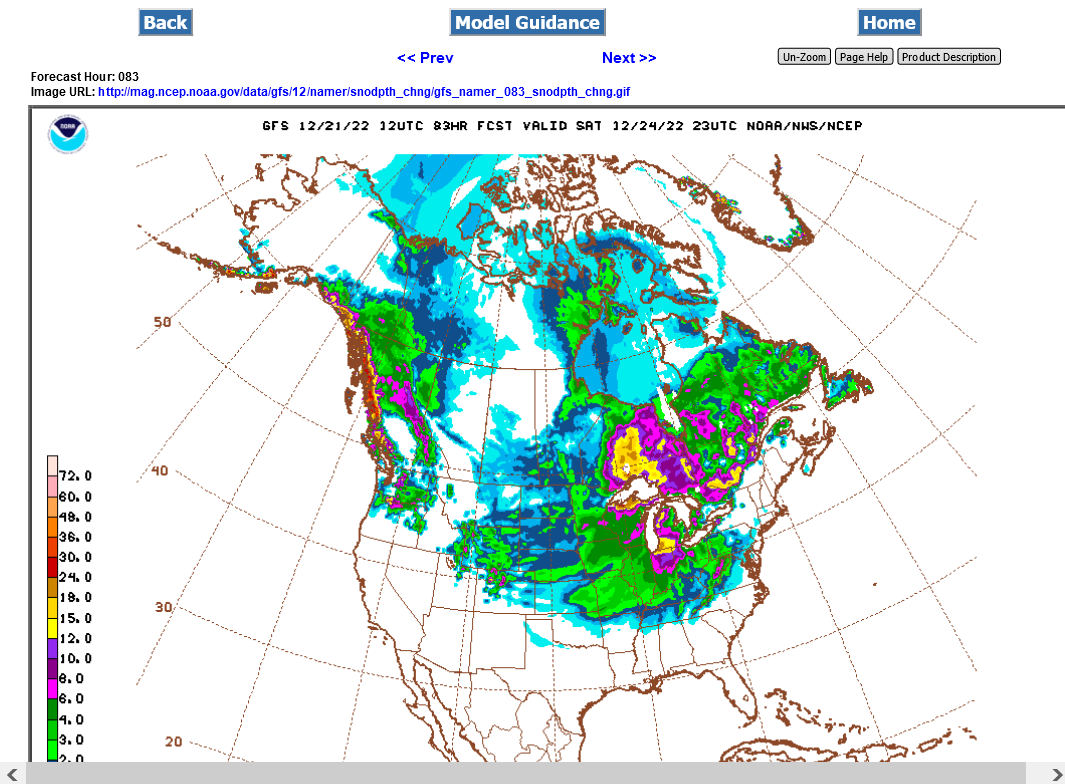
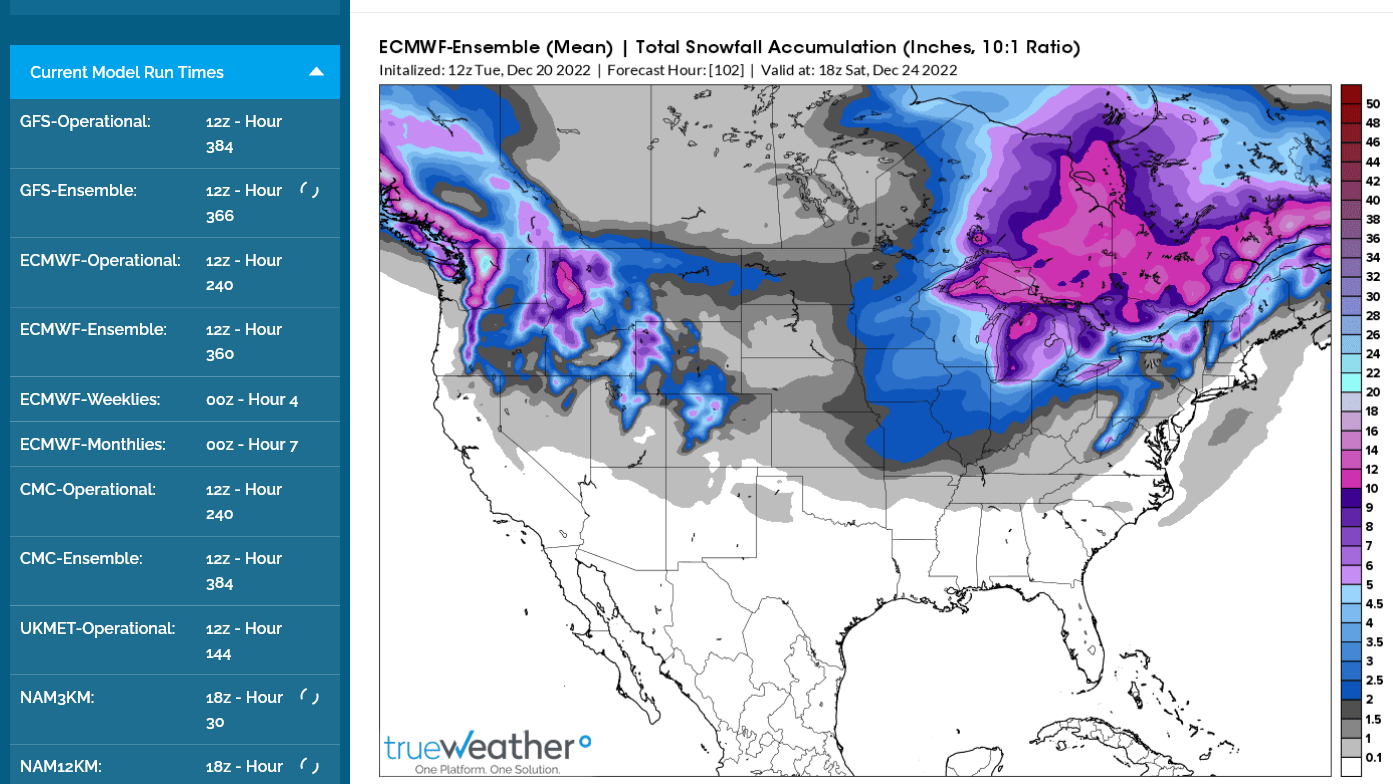
The forecast guidance that shifted strongly to the northwest (left) with the track of the storm/snow on Sunday continues to be confirmed.
This is the snow predicted by the just out 12z GEFS ensemble mean.
https://mag.ncep.noaa.gov/Image.php
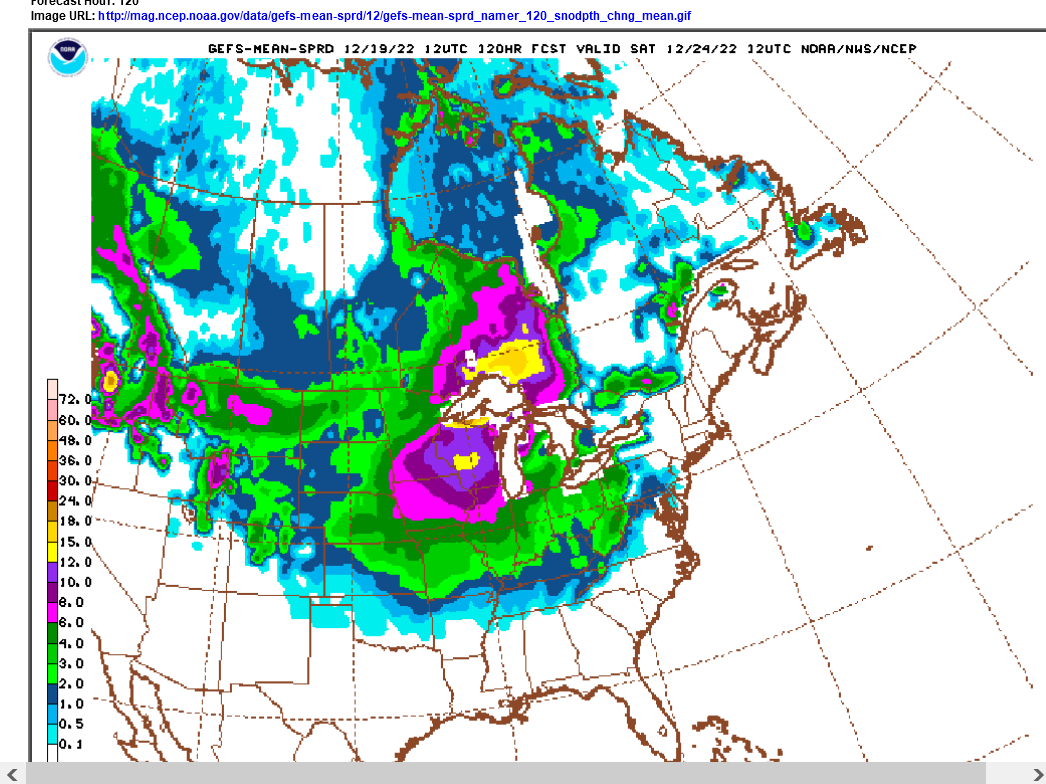
This map above is very misleading for snow amounts. It averages dozens of individual solutions that include extremes and makes the edge of the snow gradient look way more gradual than what will actually happen.
The drop off from very heavy snow to lighter amounts will be MUCH steeper.
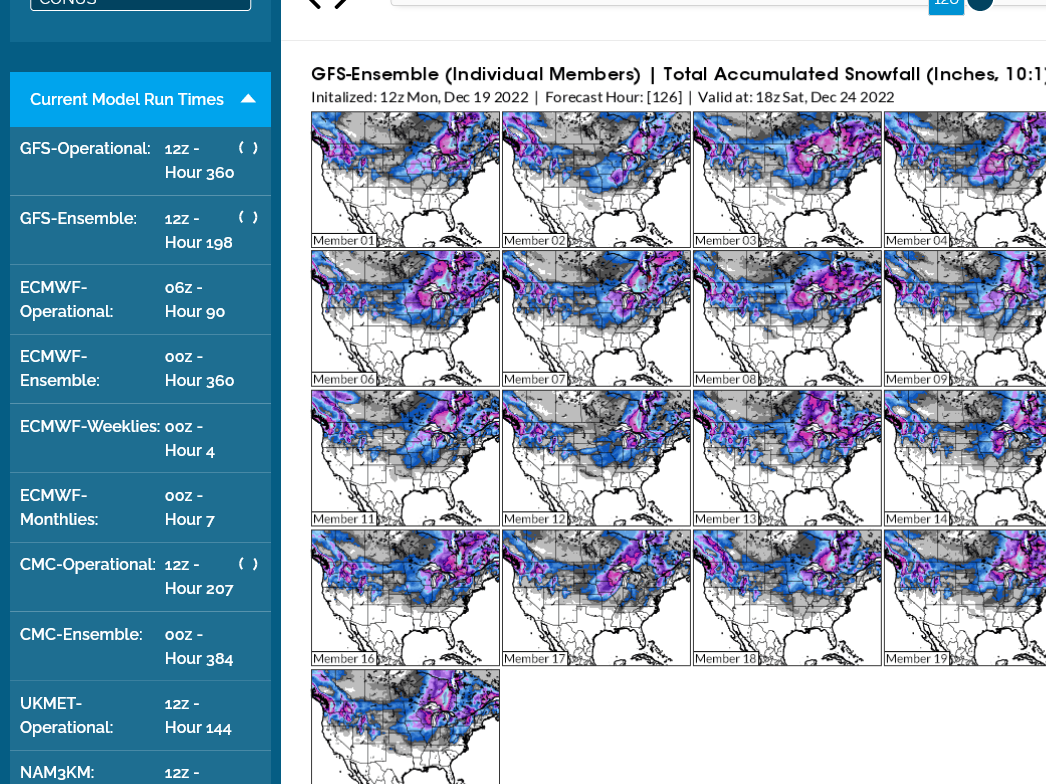
Here's are some of the individual ensemble solutions:
I've been thinking 3 inches or less since LATE Sunday as a prediction and will stay there with potential adjustments when we get closer.
You can get high/low temperature forecasts that are updated a couple times/day automatically here:
Later in the week, We'll just include the link:
https://www.marketforum.com/forum/topic/83844/#83851
Highs for days 3-7:
https://www.wpc.ncep.noaa.gov/medr/medr_max.shtml


+++++++++++++++++++++++++++++++++++++++++++++++
Lows days 3-7 below:
https://www.wpc.ncep.noaa.gov/medr/medr_min.shtml
Here's more weather pages that get automatically updated 2 times/day for you weather lovers:
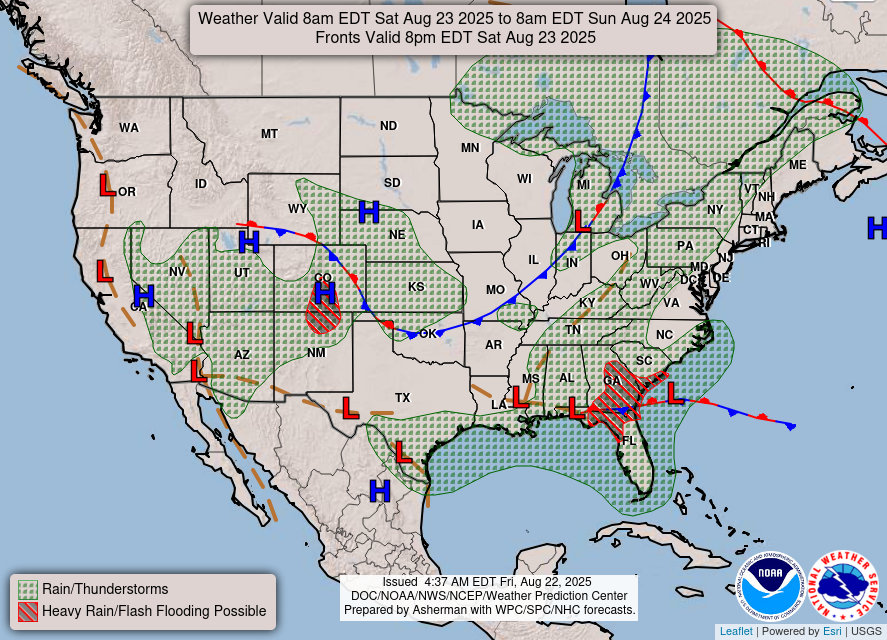
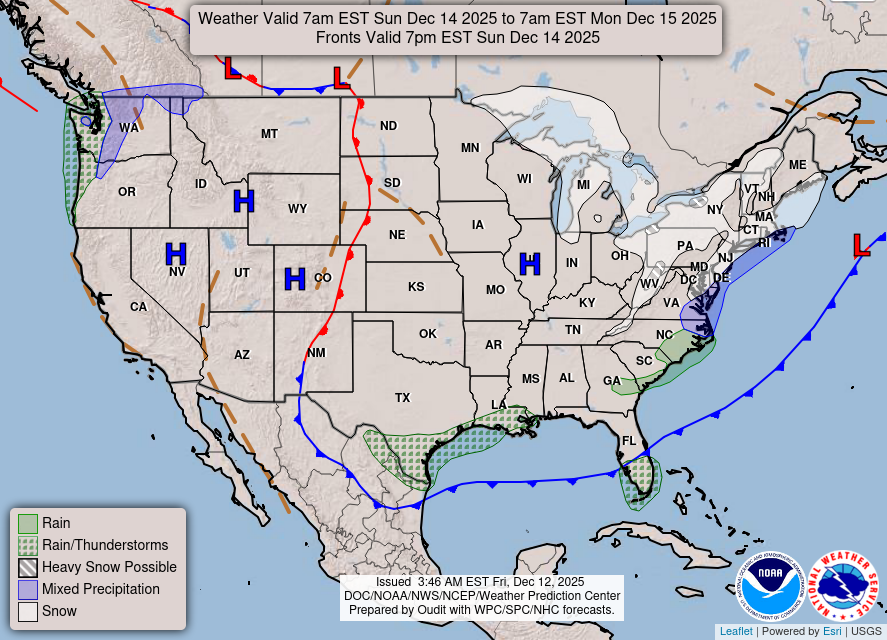
Weather map now.
In 24 hours and
In 48 hours.
https://www.wpc.ncep.noaa.gov/#

+++++++++++++++++++++++++++++++++++++++++++++++++
Surface Weather maps for days 3-7 below:
https://www.wpc.ncep.noaa.gov/medr/medr.shtml

This one is a keeper for Winter Weather interests. Press your mouse on the image to enlarge/get more.
Winter Weather Forecasts
https://www.wpc.ncep.noaa.gov/wwd/winter_wx.shtml
Snowfall Probability Forecasts
The following charts depict the probability of snowfall reaching or exceeding the specified amount.
Preliminary Forecasts
Current issuance cycle: 12Z (updated 1411Z, December 19, 2022)
All viewing options are available through the links below.
|
| Specific accumulation thresholds for Days 1-3: | All accumulation thresholds for: | |
| ≥ 1 inch | ≥ 8 inches | Day 1 |
| ≥ 2 inches | ≥ 12 inches | Day 2 |
| ≥ 4 inches | ≥ 18 inches | Day 3 |
| ≥ 6 inches | ||
Current issuance cycle: 12Z (updated 0828Z, December 19, 2022)
| Day 1 | Day 2 | Day 3 |
≥ 4 inches | ≥ 4 inches | ≥ 4 inches |
≥ 8 inches | ≥ 8 inches | ≥ 8 inches |
≥ 12 inches | ≥ 12 inches | ≥ 12 inches |
24-, 48-, and 72-Hour Snowfall Percentile Accumulation Forecasts for Days 1-3
Day 4-7 Outlook
Current issuance cycle: 12Z (updated 0445Z, December 19, 2022)
|
Near record setting high barometric (surface) pressure event coming up Thursday morning. Just out Canadian model ensembles.
Looks like timing isn't perfect with the High center across the border in Canada(along the British Columbia/Saskatchewan border) on 12-22-22 at the coldest time of day.
What do you think, Larry? What's the latest from all the models and how they compare to the previous forecast (https://www.marketforum.com/forum/topic/91423/#91523)
https://weather.gc.ca/ensemble/charts_e.html?Hour=72&Day=0&RunTime=12&Type=pnm


Evansville, IN latest forecast:
Thursday and Friday snapshot with an image that doesn't update on this post.
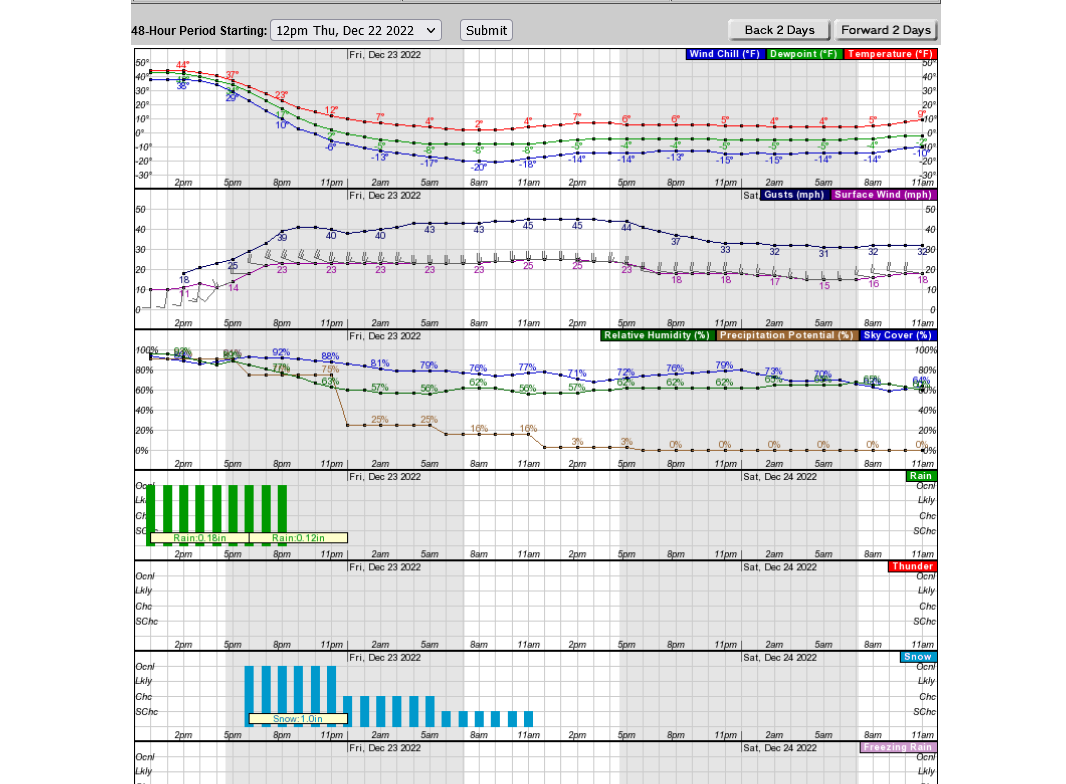
NOTE: The wind chill drops down into the -teens very early Friday and stays down there continuously into early Saturday.
Winds may be gusting to near 50 mph much of the day Friday with the temperature not much above 0!! This will be the most brutal cold and wind combination that Evansville has experienced in many decades!!!
Snow amounts were dropped a great deal since early Sunday but there is a 100% chance of brutal cold and high winds on Friday!!!
Any lingering snow showers/flurries which deposit light snow will be whipped around to such an extreme on Friday that it might be hard to tell if its blowing snow or falling snow!
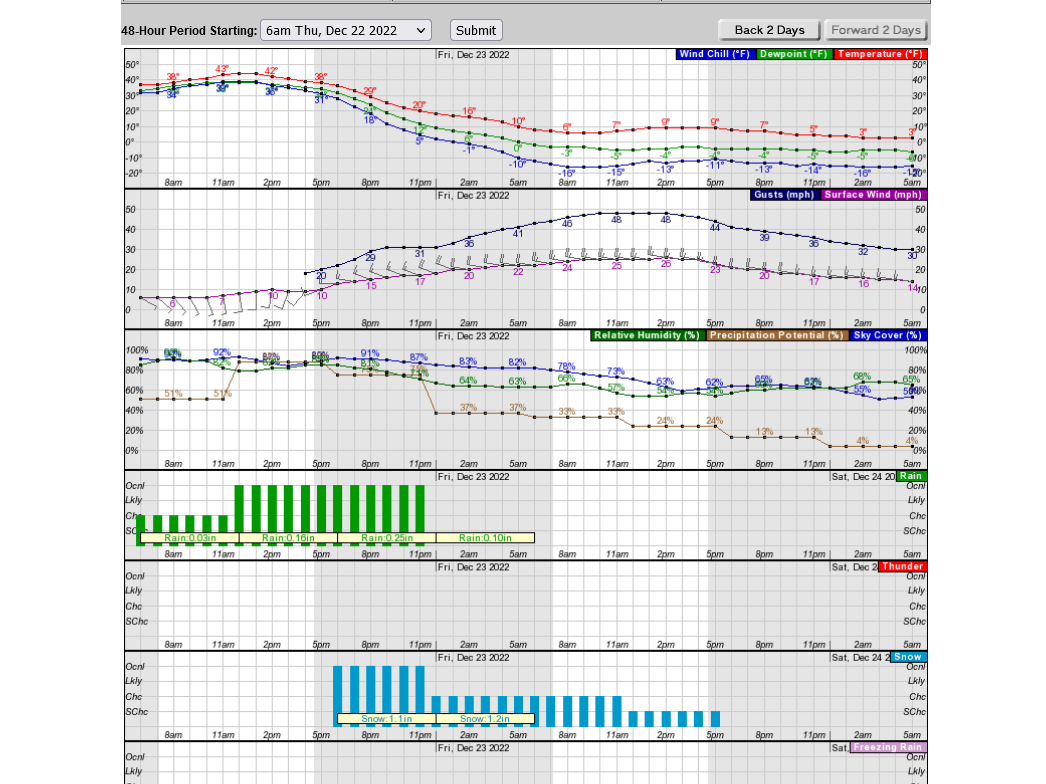
Go here for the latest update of the graph above:
theres another very unique element that we may experience late Thursday. Initially temps will be in the 40s with rain chances and above freezing road temperatures. When the Siberian blast hits temperatures will drop as fast as we’ve ever experienced…..25 degrees in several hours with high winds that can cause flash freezing of moisture on the roads before they dry out or get treated.
snow covered is bad for driving but you can see snow and adjust speeds. flash freezing of liquid water is extraordinarily dangerous with patchy black ice. You suddenly hit an invisible patch of that while on a road that looks ice free and your tires are on an ice rink with a loss of control of the vehicle….at a high speed!
this is the worst nightmare for road crews too that would treat ahead of winter storms That are all snow and ice.
if it rains before the changeover, some of the chemicals get washed off the roads.
Also, salt isn’t very effective below 15 deg. F and other chemicals become less effective.
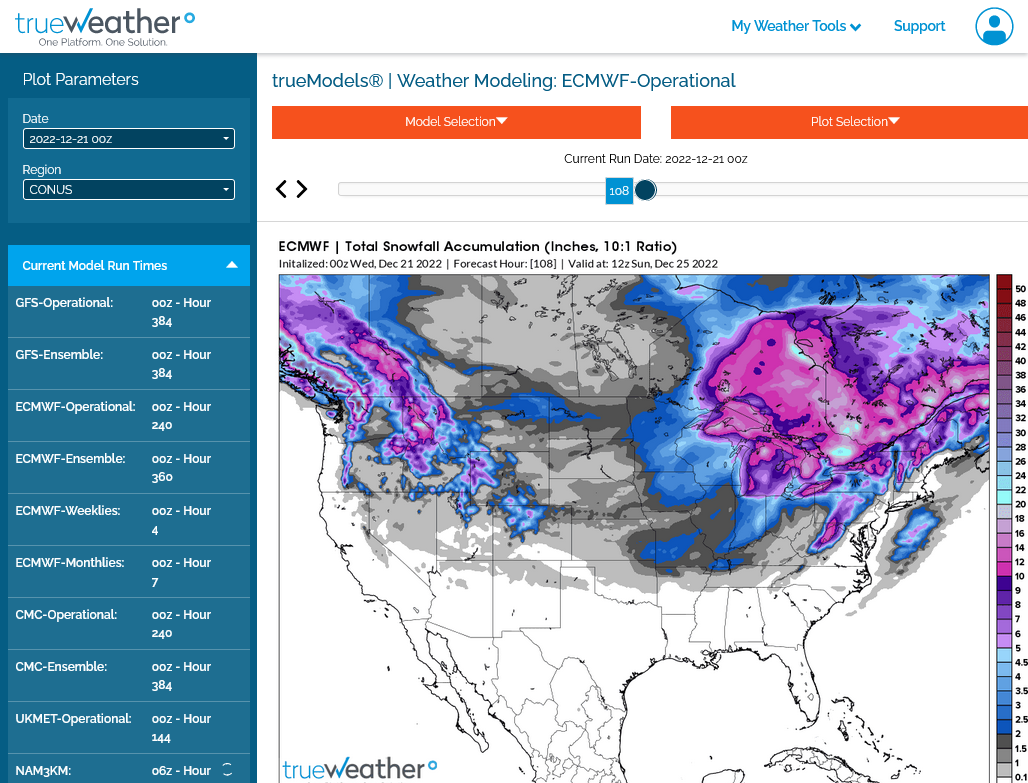
Latest 12z OPERATIONAL European model just out(1 solution, so it will depict the steep snow gradient better than an average of varying models).
Still more than 3 days out so some additional adjustments are likely. 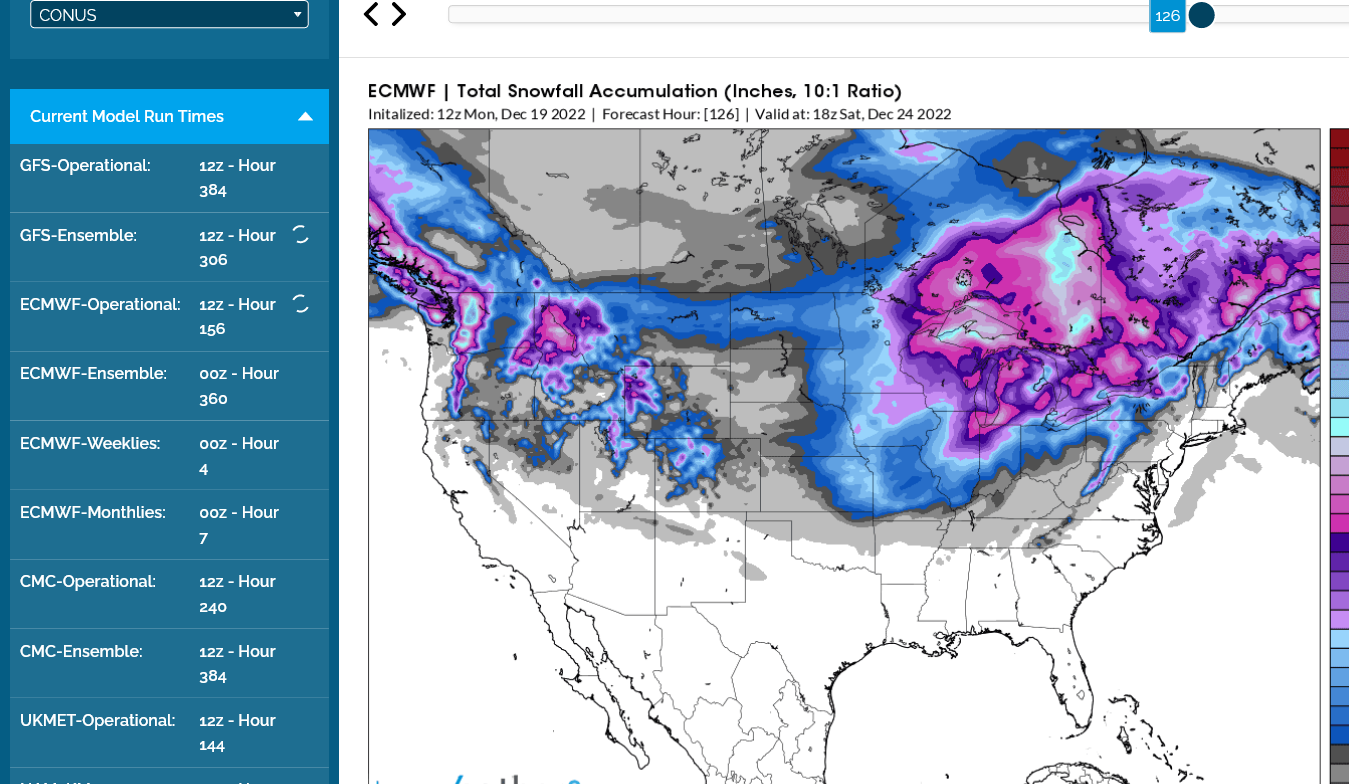
Erick Snodgrass
Thanks cutworm! Eric is the best!
FOR THOSE THAT WANNA PAY ATTENTION AS THE STORM MOVES... THIS WILL SHOW THE OUTAGES
Update for 12Z runs today for the highest barometric pressure in mb in the lower 48 states on 12/22 vs runs from 24 hours ago:
ICON 1068 (+3)
GFS 1067 (-1)
JMA 1063 (-1)
Euro 1061 (-1)
CMC 1061 (+2)
UKMET 1051 (-1)
AVG ~1062 (no change)
Record 1064 for lower 48 dating back to late 1800s
UKMET as it has been on the other days that I've checked is a strong outlier on the low side. If I were to throw out the lowest and highest (UKMET and ICON), I'd get an average of 1063, which compares to 1062.5 from 24 hours ago.
NOW, THEY'VE GOT US NORTHERN BUCKEYES GUESSED AT 4"
LOL
Models have all shifted back to the east/southeast but not as far as a couple days ago.
3 inches still looks like a good guess on Evansville snow but we're right on the edge again for heavier snow to the north. Earlier today, the models shifted the heavier snow to Chicago and points north and west with no solutions having more than that here.
A few ensembles now have more than this and another shift southeast again on Tuesday and Evansville will be looking at a major snow event.
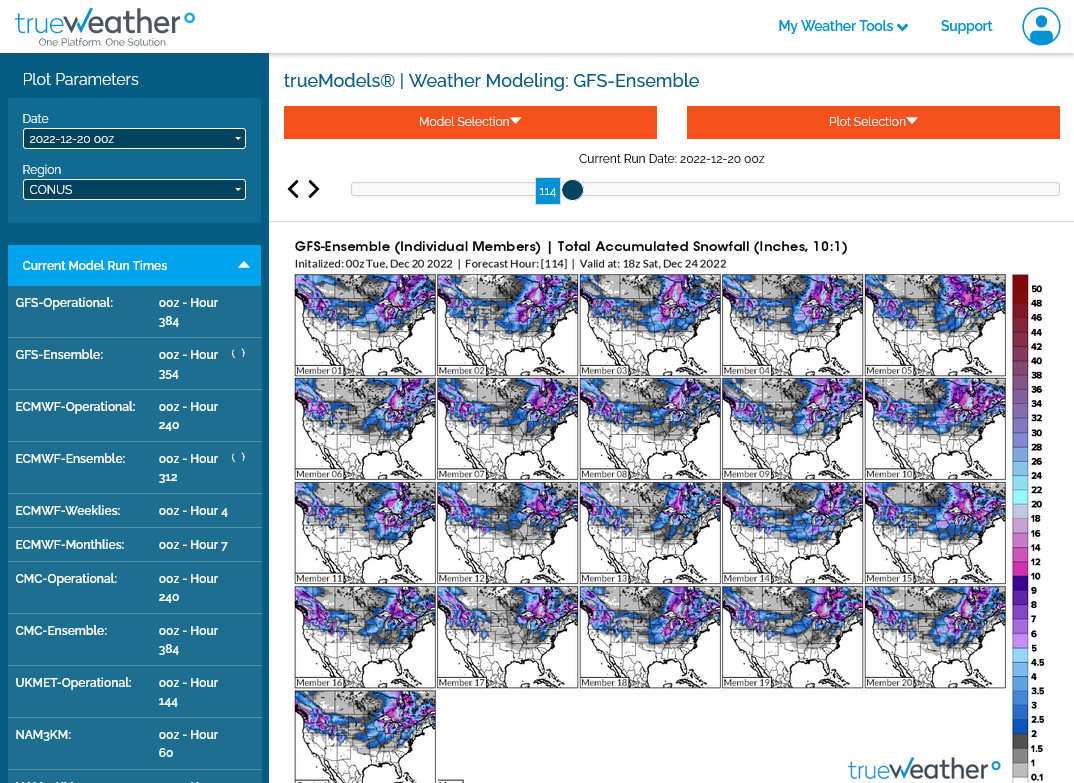
0z GEFS ensembles:
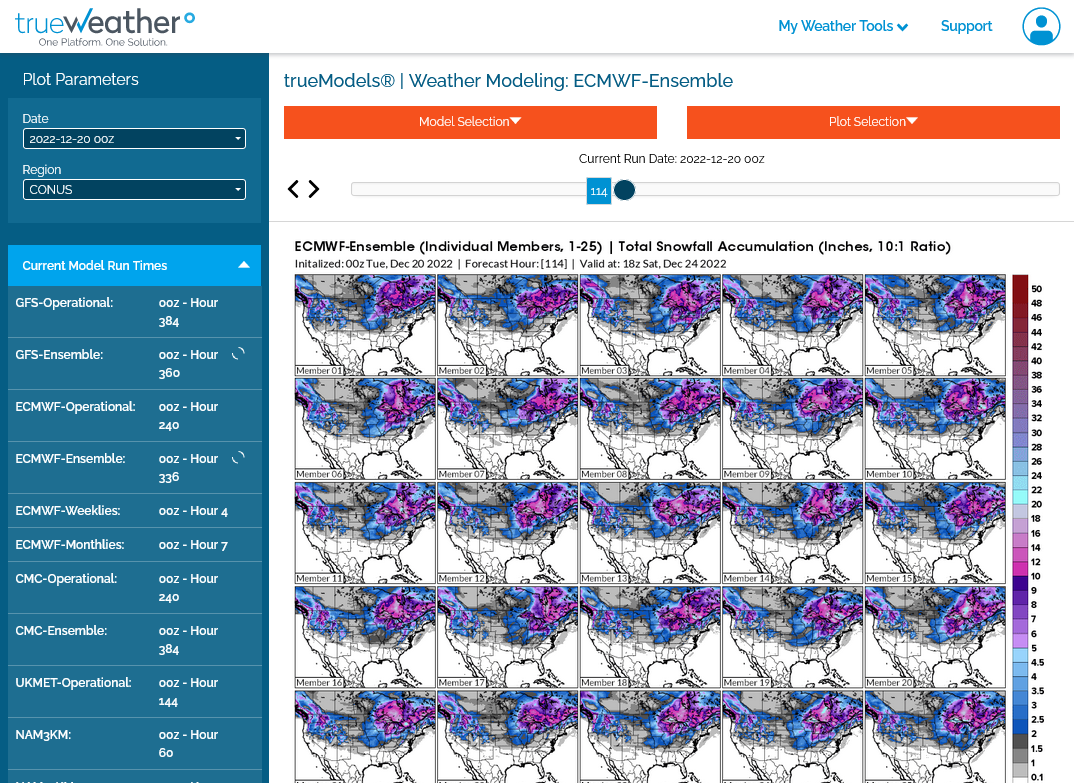
0z European ensembles
Surface pressure from the 0z Canadian ensembles for potential record event on Thursday morning.
Looks pretty similar to the previous 12z run.
https://weather.gc.ca/ensemble/charts_e.html?Hour=60&Day=0&RunTime=00&Type=gz
The last 6z GFS products early this morning have Evansville right on the southern edge of a very steep snowfall gradient, with an average amount around 3 inches bit the average of all the solutions, which usually serves as good guidance for forecasting most weather situations is not as good this time.
the reason is that the average consists of a bunch of opposite extremes at our location for just this parameter….snow…..that when added up and divided by the sample size, results in a product that’s in the middle of the extremes. but the extremes are a majority. And the average is a minority of the individual solutions!
what that means is that any shift south, even a small one will add a lot of snow here and we have a tremendous amount of upper level vorticity advection coming from southwest to northeast across Southwest IN very late Thursday to just after midnight Fri which is extremely favorable for strong lift and very efficient at squeezing out a lot of precip fast.
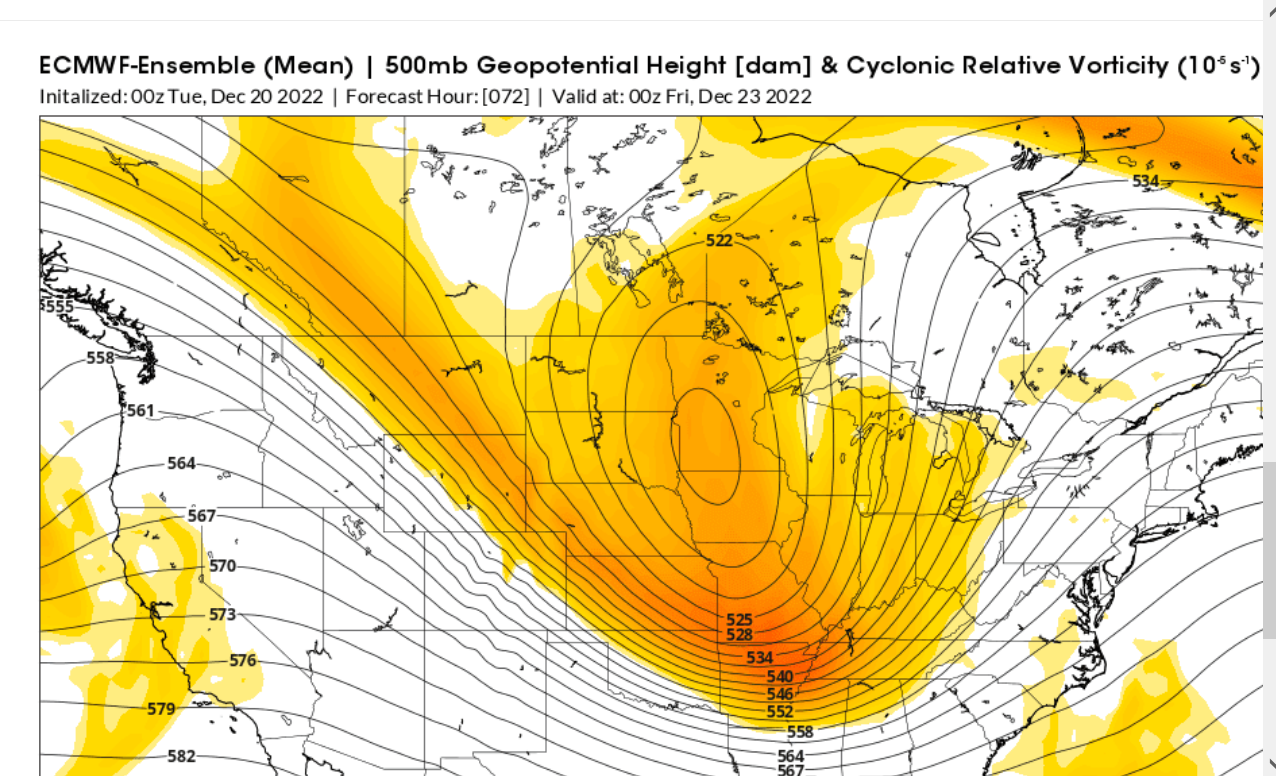
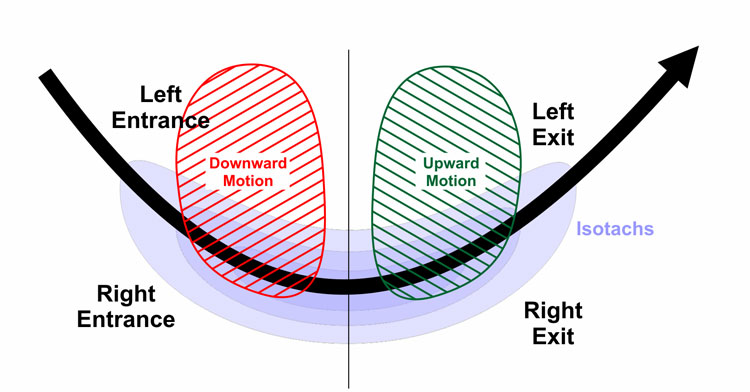
The upper level vorticity advection on the map below for late Thursday will follow the contour lines with areas that go from lighter to darker having an INCREASE in cyclonic spin and lift. Vorticity in the base of the trough below, will be moving northeast and aimed at Indiana very late Thursday and after midnight Friday.
There's much more to it, like the amount of moisture available and vertical temperature profile(which isn't good in this case) that determines how much moisture can be squeezed out by the lift from the vorticity but we have some robust positive vorticity advection going on at this time period.
If you're somebody that wants to learn more:
https://www.weather.gov/source/zhu/ZHU_Training_Page/Miscellaneous/vorticity/vorticity.html
You can see from the diagram below, that we are in the "Left Exit" region of the upper level trough depicted above that receives the greatest positive vorticity advection and upward motion. It's always good to use the models forecast of snow amounts but also a key to recognize the pattern and meteorological dynamics like this.
Evansville will have enough PVA(Positive Vorticity Advection) very late Thursday to get several inches of snow real fast.
https://learningweather.psu.edu/node/100
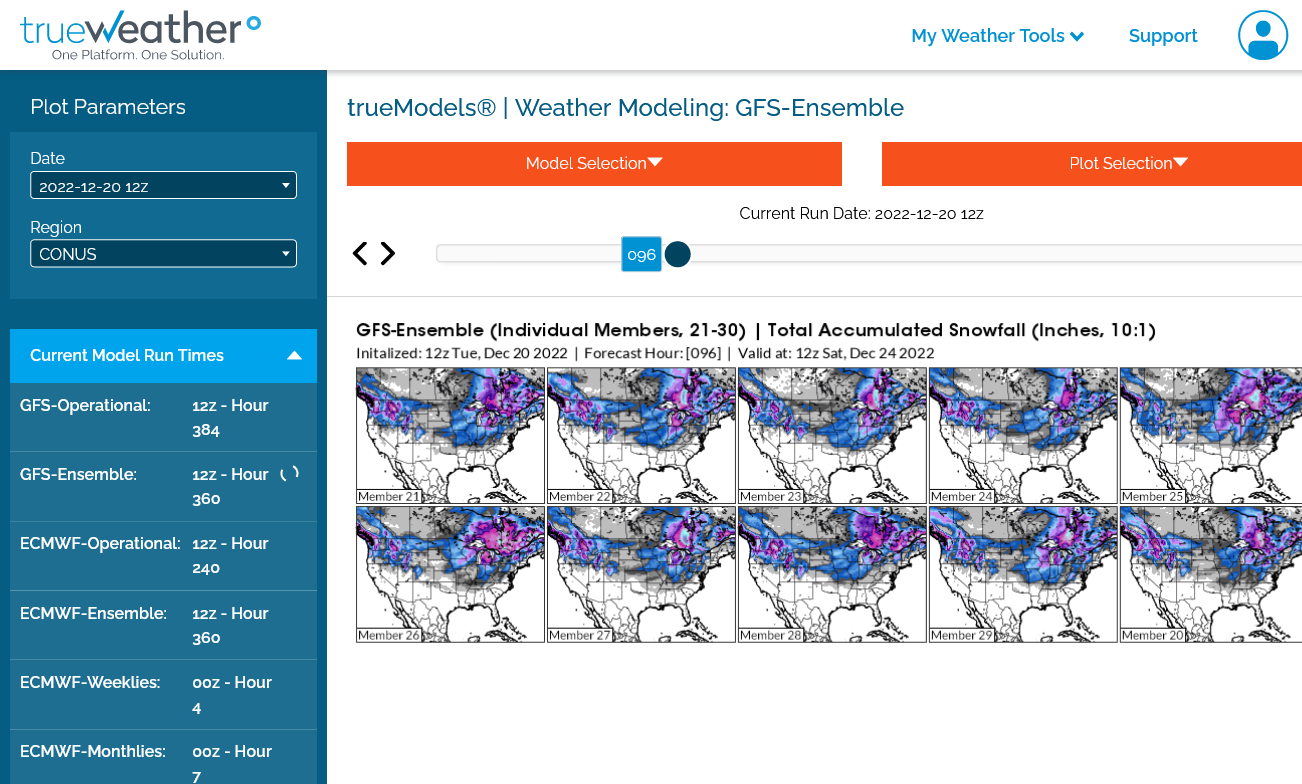
12z GEFS products are out. The amount for Evansville has not changed much but the huge disparity in extremes has not been resolved yet. Several solutions have very light amounts for the entire state of IN, a couple outliers have 10 inches(mainly northern IN). Still too way too much disparity/disagreement to have great confidence for Indiana.
EDIT: I accidently provided the 24 hour snow totals previously not entire storm totals!
See for yourself:
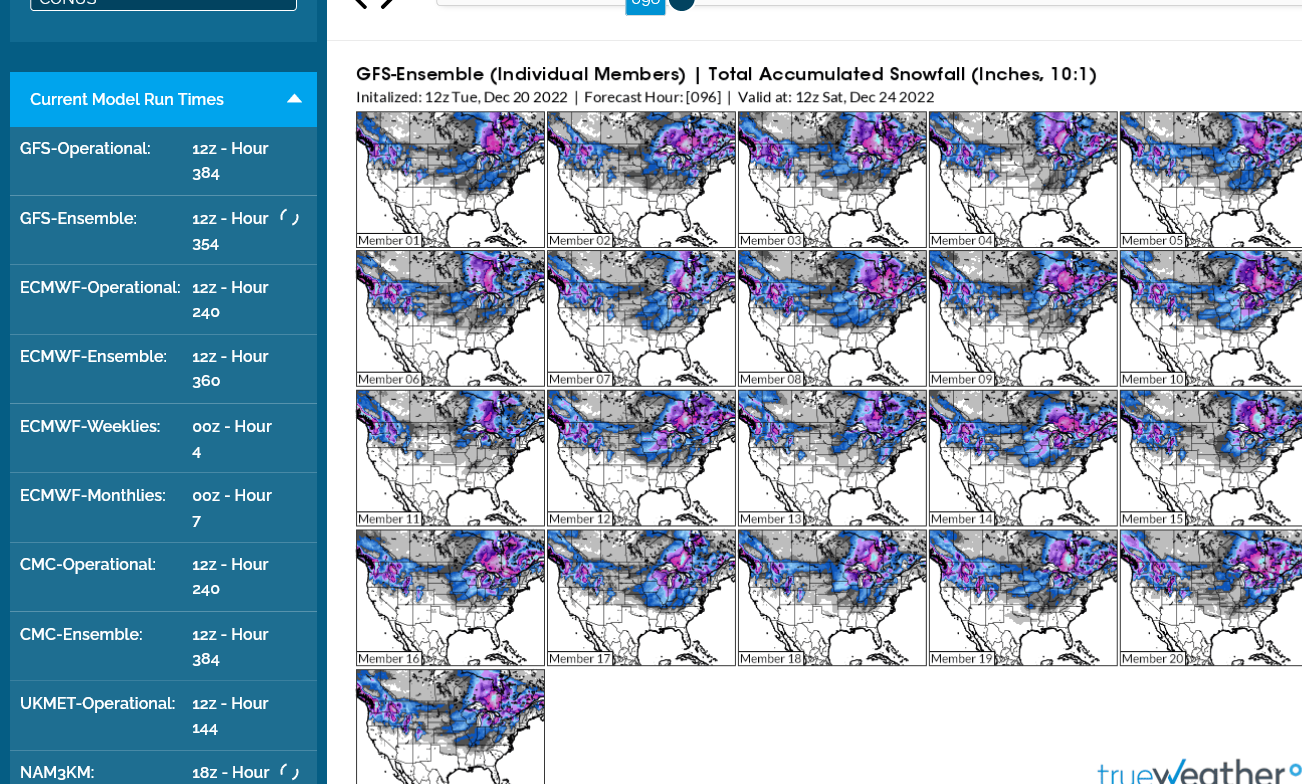
The far bottom 2nd from the left is the mean/average of all the solutions.
More Information:
Weather graph for Evansville, IN from Noon Thu-Noon Sat.
Friday will be the coldest, windiest day in decades with wind chills down to -20 Deg. F at times.
The European ensembles keeps the huge snows in the Great Lakes/Northeast.
We're getting enough agreement now with this model with it's 50 members to gain more confidence, so I'll use just the mean(average of all of them).
That average is between 1.5"-2" of snow. Much heavier snows to the north but pretty far north to see a foot of snow.
There is good news though!
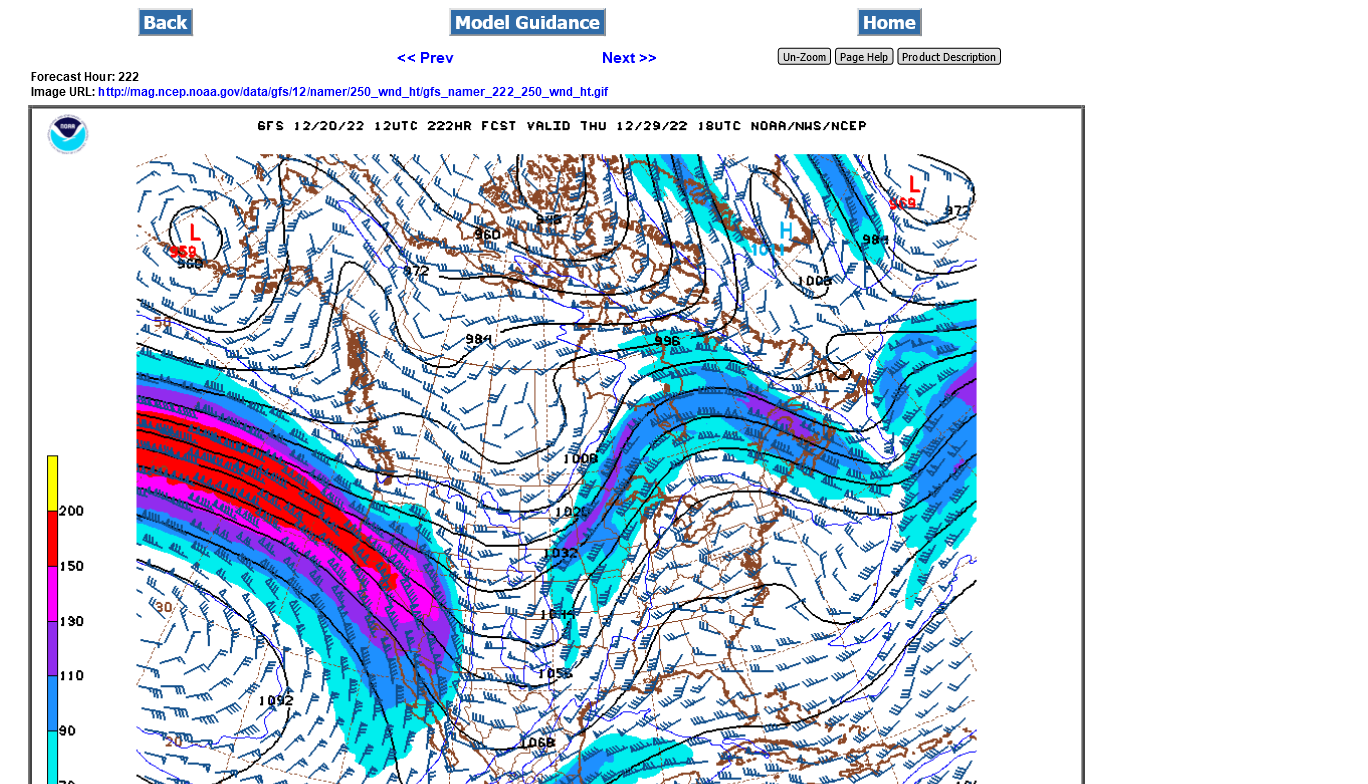
This frigid intrusion will be very brief. Next week will start very cold but temperatures by the end of the week will be ABOVE average as mild Pacific air spreads across the entire country.
By midweek, the jet stream will look like this(all the cold is cut off):
https://mag.ncep.noaa.gov/Image.php

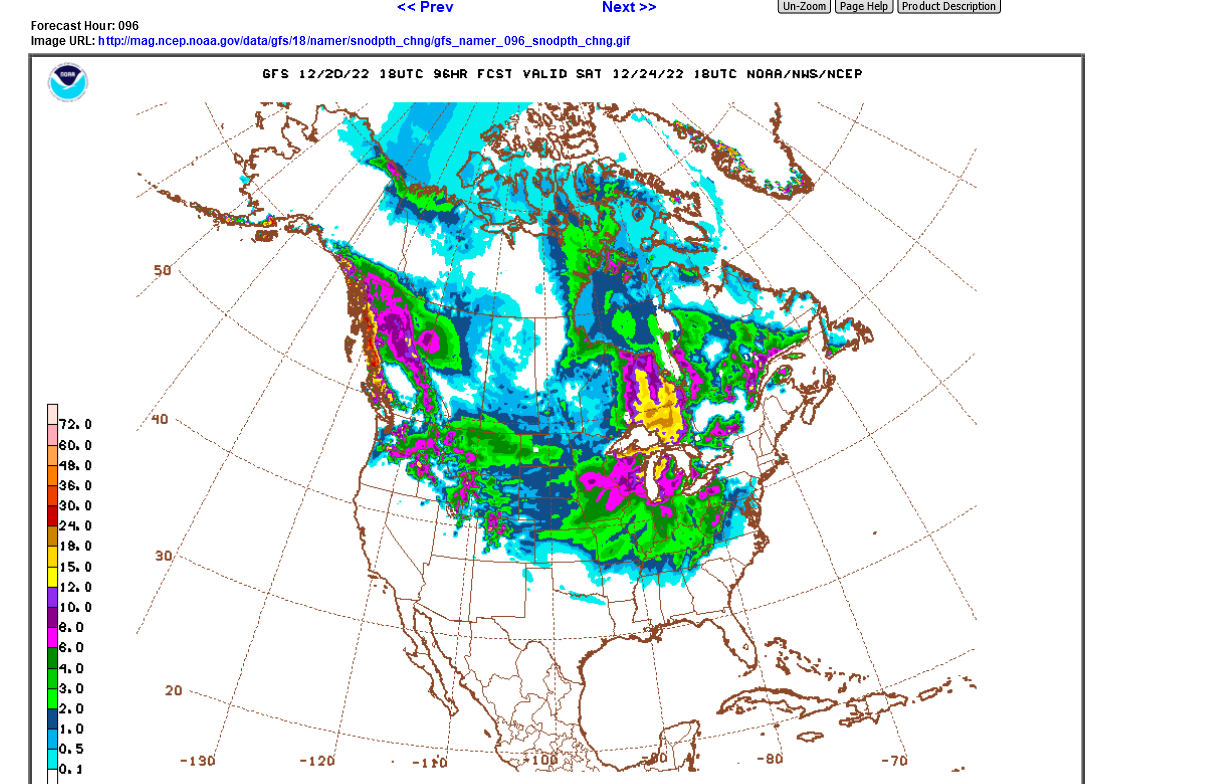
Just updated 18z GFS operational model. Here's the link to a free government site with this model too.
The operational models are more bullish with the snow in Indiana today. Evansville has 3-4" with N and even C Indiana getting 6".
https://mag.ncep.noaa.gov/Image.php
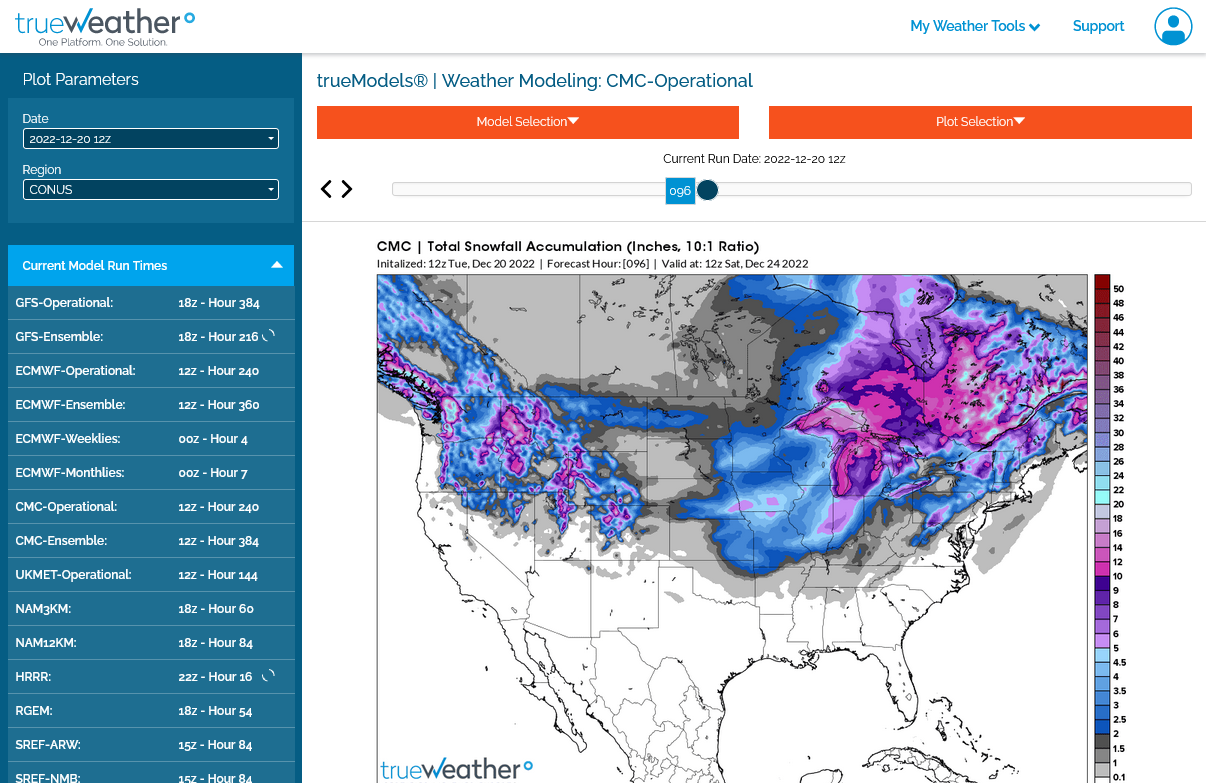
Below is the CMC model from earlier.....the one with the most snow. Considering the powerful upper level dynamics, I'm starting to favor this solution. The pink is 5"+, which is still just north of EVV but you can see the tail of heavier snows extending across much of IN. This is still in play down to the Ohio River! Keep in mind that many of the ensembles of the GFS and European model don't have much snow that far south with the event now around 48 hours away.
This looks reasonable to me, the 0z European operational model with around 3" in Evansville. We still have numerous ensemble solutions with only an inch or so which seems too low considering the powerful lift behind the front from upper level vorticity advection.
A few are more than that, especially in N.Indiana.
Latest 0z Canadian surface pressure forecast for Thursday morning with potential record breaking high barometric pressure reading in MT. Looks similar to the previous one to me but Larry is tracking this element much closer and following ALL the models and their changes for this metric.
https://weather.gc.ca/ensemble/charts_e.html?Hour=36&Day=0&RunTime=00&Type=pnm
The temperature Thursday PM will drop 35 degrees in 8 hours and the wind chill will drop 50-55 degrees in 8 hours, down to -20 around midnight.
The wind chill is based on the sustained wind, which will be NW around 23 mph.
During wind gusts above 40 mph, the wind chill will feel like - 30 deg. F!!!
this area has wind chills that low, maybe once every couple of decades but the drop this fast may be a record.w
https://www.weather.gov/safety/cold-wind-chill-chart
NWS Forecast Office Paducah, KY
Click a location below for detailed forecast.
https://www.weather.gov/pah/winter
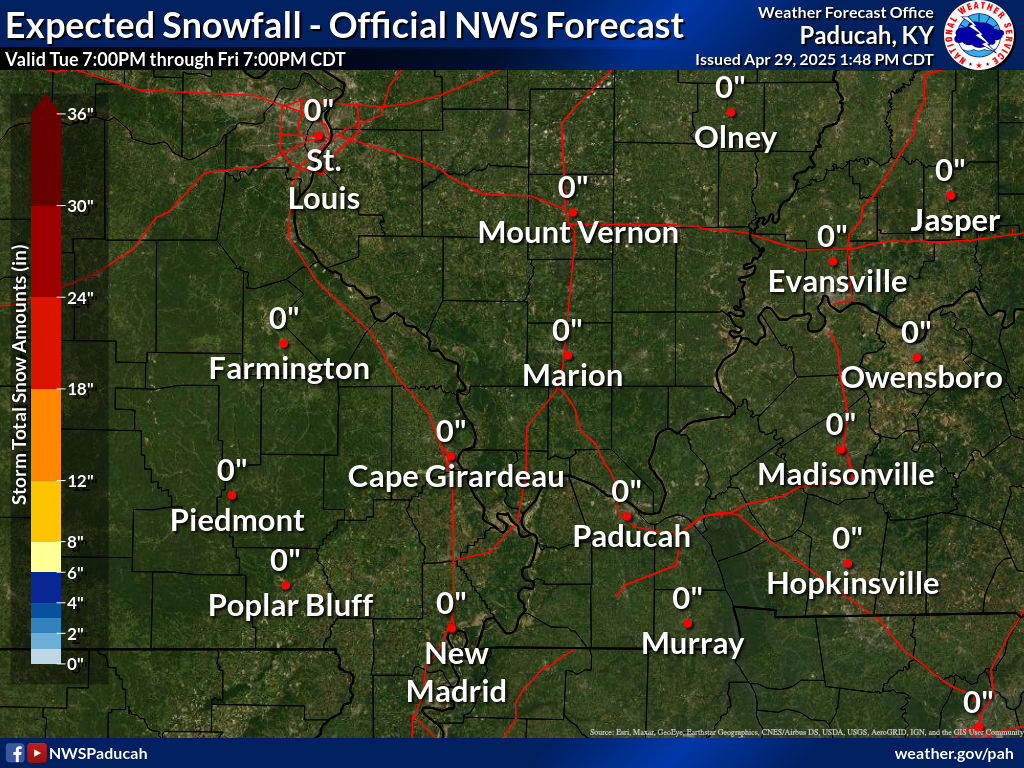
Though this is reasonable above from our awesome NWS, my current forecast is going with a bit more snow than this. 3" in Evansville.
i see the NWS has increased their snow amounts by an inch above. They must be reading MarketForum (-:
12-21-22-Showtime! Tracking the Storm/Cold
12z guidance is starting to come out and I'm sticking with 3" of snow for Southwest, IN/Evansville(more than the NWS which is 1-2") after seeing some of it and will make it 3"+ from leaning slightly heavier.
GFS Operational model run below.