KEY EVENTS TO WATCH FOR:
Friday, December 23, 2022
8:30 AM ET. November Personal Income & Outlays
Personal Income, M/M% (previous +0.7%)
Consumer Spending, M/M% (previous +0.8%)
PCE Price Idx, M/M% (previous +0.3%)
PCE Price Idx, Y/Y% (previous +6%)
PCE Core Price Idx, M/M% (previous +0.2%)
PCE Core Price Idx, Y/Y% (previous +5%)
8:30 AM ET. November Advance Report on Durable Goods
Durable Goods-SA, M/M% (previous +1.0%)
Dur Goods, Ex-Defense, M/M% (previous +0.8%)
Dur Goods, Ex-Transport, M/M% (previous +0.5%)
Orders: Cap Gds, Non-Def, Ex-Air, M/M%(previous +0.7%)
Shipmnts: Cap Gds, Non-Def, Ex-Air, M/M% (previous +1.3%)
10:00 AM ET. November New Residential Sales
New Home Sales (previous 632K)
New Home Sales, M/M% (previous +7.5%)
New Home Sales Months Supply (previous 8.9)
10:00 AM ET. 3rd Quarter GDP by State
10:00 AM ET. 3rd Quarter State Quarterly Personal Income
10:00 AM ET. December University of Michigan Survey of Consumers - final
End-Mo Sentiment Idx (previous 56.8)
End-Mo Expectations Idx (previous 55.6)
12-Month Inflation Forecast (previous 4.9%)
5-Year Inflation Forecast (previous 3.0%)
End-Mo Current Idx (previous 58.8)
The STOCK INDEXES? http://quotes.ino.com/ex?changes/?c=indexes
The STOCK INDEXES: The March NASDAQ 100 was steady to higher overnight as it consolidates some of this month's decline. Overnight tradingsets the stage for a higher opening when the day session begins trading.Stochastics and the RSI are oversold but remain neutral to bearish signaling that sideways to lower prices are possible near-term. If March extends the decline off last-Tuesday's high, November's low crossing at 10,746.75 is the next downside target. Closes above the 20-day moving average crossing at 11,639.52 would signal that a short-term low has been posted. First resistance is the 50-day moving average crossing at 11,558.10. Second resistance is the 20-day moving average crossing at 11,639.52. First support is Thursday's low crossing at 10,870.50. Second support is November's low crossing at 10,746.75.
The March S&P 500 was steady to slightly higher overnight as it consolidates some of Thursday's decline. Overnight trading sets the stage for a steady to higher opening when the day session begins trading. Stochastics and the RSI are oversold but remain neutral to bearish signaling that sideways to lower prices are possible near-term. If March extends the decline off December's high, November's low crossing at 3735.00 is the next downside target. Closes above the 20-day moving average crossing at 3975.43 would signal that a short-term low has been posted. First resistance is the 50-day moving average crossing at 3923.45. Second resistance is the 20-day moving average crossing at 3975.43. First support is the November 9th low crossing at 3782.75. Second support is November's low crossing at 3735.00.
INTEREST RATES http://quotes.ino.com/ex changes/?c=interest"
INTEREST RATES: March T-bonds was lower overnight and remains poised to extend the decline off December's high. Overnight trading sets the stage for a lower opening when the day session begins trading. Stochastics and the RSI are oversold but remain neutral to bearish signaling that sideways to lower prices are possible near-term. If March extends the aforementioned decline, the 50-day moving average crossing at 125-06 is the next downside target. Closes above the 10-day moving average crossing at 129-23 would temper the near-term bearish outlook. First resistance is the 10-day moving average crossing at 129-23. Second resistance is December's high crossing at 132-15. First support is the November 30th low crossing at 126-00. Second support is the 50-day moving average crossing at 125-06.
March T-notes were lower overnight as it extends this month's decline. Overnight trading sets the stage for a lower opening when the day session begins trading. Stochastics and the RSI are oversold but remain neutral to bearish signaling that sideways to lower prices are possible near-term. If March extends the decline off December's high, the 50-day moving average crossing at 112.174 is the next downside target. If March renews the rally off October's low, the 62% retracement level of the August-October decline crossing at 116.232 is the next upside target. First resistance is the 50% retracement level of the August-October decline crossing at 115.090. Second resistance is the 62% retracement level of the August-October decline crossing at 116.232. First support is the 50-day moving average crossing at 112.174. Second support is the November 14th low crossing at 112.055.
ENERGY MARKETS? http://quotes.ino.com/ex?changes/?c=energy ""
ENERGIES:Februarycrude oil was higher overnight and sets the stage for a higher opening when the day session begins trading. Stochastics and the RSI are neutral to bullish signaling that sideways to higher prices are possible near-term. If February extends the rally off December's low, the 50-day moving average crossing at $80.76 is the next upside target. Closes below last-Friday's low crossing at $73.40 would signal that a short-term top has been posted. First resistance is the 50-day moving average crossing at $80.76. Second resistance is the December 1st high crossing at $83.27. First support is last-Friday's low crossing at $73.40. Second support is the December 9th low crossing at $70.31.
February heating oil was higher overnight as it extends the rally off Tuesday's low. Overnight trading sets the stage for a higher opening when the day session begins trading. Stochastics and the RSI are neutral to bullish signaling that sideways to higher prices are possible near-term. If February extends the aforementioned rally, the 50-day moving average crossing at $3.2451 is the next upside target. Closes below Tuesday's low crossing at $2.9682 would signal that a short-term top has been posted. First resistance is the 50-day moving average crossing at $3.2451. Second resistance is December's high crossing at $3.3439. First support is Tuesday's low crossing at $2.9682. Second support is December's low crossing at $2.7517.
February unleaded gas was higher overnight as it extends the rally off December's low. Overnight trading sets the stage for a higher opening when the day session begins trading. Stochastics and the RSI are neutral to bullish signaling that sideways to higher prices are possible near-term. If February extends the rally off December's low, the 50-day moving average crossing at $2.3525 is the next upside target. Closes below the 10-day moving average crossing at $2.2095 would signal that a short-term top has been posted. If February renews the decline off November's high, the 50% retracement level of the 2020-2022 rally crossing at $1.9539 is the next downside target. First resistance is the 50-day moving average crossing at $2.3525. Second resistance is the December 1st high crossing at $2.4151. First support is last-Friday's low crossing at $2.1157. Second support is the December 12th low crossing at $2.0321.
February natural gas was steady to slightly lower overnight as it extends the decline off November's high. Overnight trading sets the stage for a lower opening when the day session begins trading. Stochastics and the RSI are oversold but remain neutral to bearish signaling that sideways to lower prices are possible near-term. If February extends the decline off November's high, the 75% retracement level of the 2020-2022 rally crossing at 4.332 is the next downside target, Closes above the 50-day moving average crossing at 6.213 would signal that a short-term low has been posted. First resistance is the 10-day moving average crossing at 6.825. Second resistance is the 50-day moving average crossing at 6.213. First support is the overnight low crossing at 4.878. Second support is the 75% retracement level of the 2020-2022 rally crossing at 4.332.
CURRENCIEShttp://quotes.ino.com/ex changes/?c=currencies"
CURRENCIES:The March Dollar was steady to slightly lower overnight and sets the stage for a slightly lower opening when the day session begins trading. Stochastics and the RSI are neutral to bullish signaling that sideways to higher prices are possible near-term. Closes above the 20-day moving average crossing at $104.534 would signal that a short-term low has been posted. If March renews the decline off September's high, the 75% retracement level of the March-September rally crossing at $101.331 is the next downside target. First resistance is the 20-day moving average crossing at $104.534. Second resistance is the November 30th high crossing at $106.775. First support is last-Thursday's low crossing at $102.875. Second support is the 75% retracement level of the March-September rally crossing at $101.331.
The March Euro was steady to slightly higher overnight as it extends the trading range of the past eight-days. Overnight trading sets the stage for a steady to slightly higher opening when the day session begins trading. Stochastics and the RSI are neutral to bearish signaling that sideways to lower prices are possible near-term. Closes below the 20-day moving average crossing at $1.06143 would signal that a short-term top has been posted. If March renews the rally off September's low, the March 31st high crossing at $1.09680 is the next upside target. First resistance is the 25% retracement level of the 2021-2022 crossing at $1.08062. Second resistance is the March 31st high crossing at $1.09680. First support is the 20-day moving average crossing at $1.06143. Second support is the November 30th low crossing at $1.03715.
The March British Pound was steady to slightly higher overnight and sets the stage for a higher opening when the day session begins trading.Stochastics and the RSI are oversold but remain bearish signaling that sideways to lower prices are possible near-term. If March extends the decline off December's high, the 50-day moving average crossing at 1.1850 is the next downside target. If March renews the rally off September's low, the 62% retracement level of the 2021-2022 decline crossing at 1.2770 is the next upside target. First resistance is December's high crossing at 1.2477. Second resistance is the 62% retracement level of the 2021-2022 decline crossing at 1.2770. First support is the November 30th low crossing at 1.1937. Second support is the 50-day moving average crossing at 1.1850.
The March Swiss Franc was steady to slightly higher overnight. Overnight trading sets the stage for a slightly higher opening when the day session begins trading. Stochastics and the RSI are neutral to bearish signaling that sideways to lower prices are possible near-term. Closes below the 20-day moving average crossing at 1.08042 would temper the near-term friendly outlook. If March extends the rally off the November 21st low, the 62% retracement level of the 2021-2022 decline crossing at 1.10351 is the next upside target. First resistance is last-Wednesday's high crossing at 1.09665. Second resistance is the 62% retracement level of the 2021-2022 decline crossing at 1.10351. First support is the 20-day moving average crossing at 1.08042. Second support is the November 30th low crossing at 1.06060.
The March Canadian Dollar was slightly higher overnight as it extends the trading range of the past three-weeks. Overnight trading sets the stage for a slightly higher opening when the day session begins trading. Stochastics and the RSI are turning neutral to bullish signaling that sideways to higher prices are possible near-term. Closes above the 50-day moving average crossing at $73.90 would signal that a short-term low has been posted. If March resumes the decline off November's high, November's low crossing at $72.58 is the next downside target. First resistance is the 50-day moving average crossing at $73.90. Second resistance is the December 5th high crossing at $74.82. First support is last-Friday's low crossing at $73.04. Second support is November low crossing at $72.58.
The March Japanese Yen was steady to slightly lower overnight as it consolidates some of Tuesday's rally. Overnight trading sets the stage for a slightly lower opening when the day session begins trading. Stochastics and the RSI are neutral to bullish signaling that sideways to higher prices are possible near-term. If March extends the rally off October's, the August high crossing at 0.078135 is the next upside target. Closes below last-Thursday's low crossing at 0.073210 would confirm that a short-term top has been posted. First resistance is the the 87% retracement level of the August-October decline crossing at 0.076735. Second resistance is the August high crossing at 0.078135. First support is last-Thursday's low crossing at 0.073210. Second support is the November 30th low crossing at 0.072510.
PRECIOUS METALS http://quotes.ino.com/ex changes/?c=metals"
PRECIOUS METALS: Februarygold was higher overnight as it consolidates some of decline off Wednesday's high. Overnight trading sets the stage for a higher opening when the day session begins trading. Stochastics and the RSI are neutral to bearish signaling that sideways to lower prices are possible near-term. Closes below last-Thursday's low crossing at $1782.00 would signal that a short-term top has been posted. If February renews the rally off November's low, the 50% retracement level of the March-October decline crossing at $1861.40 is the next upside target. First resistance is last-Tuesday's high crossing at $1836.90. Second resistance is the 50% retracement level of the March-October decline crossing at $1861.40. First support is the 20-day moving average crossing at $1797.60. Second support is last-Thursday's low crossing at $1782.00.
March silver is working on an inside day as it was higher overnight consolidating some of the decline off Wednesday's high. Overnight trading sets the stage for a higher opening when the day session begins trading later this morning. Stochastics and the RSI are overbought, diverging and are turning neutral to bearish signaling that sideways to lower prices are possible near-term. Closes below the 20-day moving average crossing at $23.123 would signal that a short-term top has been posted. If March extends the rally off October's low, the 75% retracement level of the March-August decline crossing at $24.779 is the next upside target. First resistance is the 75% retracement level of the March-August decline crossing at $24.779. Second resistance is the 87% retracement level of the March-August decline crossing at $25.938. First support the 20-day moving average crossing at $23.123. Second support is the December 6th low crossing at $22.190.
March copper is working on an inside day as it was slightly higher overnight while extending this month's trading range. The high-range overnight trade sets the stage for a slightly higher opening when the day session begins trading. Stochastics and the RSI remain neutral to bearish signaling that sideways to lower prices are possible near-term. Closes below Tuesday's low crossing at 3.7230 would mark a likely downside breakout of the aforementioned trading range. If March resumes the rally off the November 28th low, the 50% retracement level of the March-July decline crossing at 4.0343 is the next upside target. First resistance is November's high crossing at 3.9470. Second resistance is the 50% retracement level of the March-July decline crossing at 4.0343. First support is Tuesday's low crossing at 3.7230. Second support is the 50-day moving average crossing at 3.6525.
GRAINS http://quotes.ino.com/ex changes/?c=grains
March corn was higher overnight as it extends the rally off December's low. Overnight trading sets the stage for a higher opening when the day sessions begins trading. Stochastics and the RSI are overbought but remain neutral to bullish signaling that sideways to higher prices are possible near-term. If March extends this month's rally, the 50-day moving average crossing at $6.69 is the next upside target. Closes below the 20-day moving average crossing at $6.53 1/2 would temper the near-term friendly outlook. First resistance is the 50-day moving average crossing at $6.69. Second resistance is the November 15th high crossing at $6.77. First support is Monday's low crossing at $6.44. Second support is the December 7th low crossing at $6.35.
March wheat was higher overnight and sets the stage for a higher opening when the day session begins trading. Stochastics and the RSI are neutral to bullish signaling that sideways to higher prices are possible near-term. If March extends the rally off December's low, the 50-day moving average crossing at $8.13 1/2 is the next upside target. If March renews the decline off October's high, the 87% retracement level of the 2020-2022 rally crossing at $6.36 1/4 is the next downside target. First resistance is the November 30th high crossing at $7.99 1/4. Second resistance is the 50-day moving average crossing at $8.13 1/2. First support is the 75% retracement level of the 2020-2022 rally crossing at $7.24 1/4. Second support is the 87% retracement level of the 2020-2022 rally crossing at $6.36 1/4.
March Kansas City wheat was higher overnight and sets the stage for a higher opening when the day session begins trading later this morning. Stochastics and the RSI are neutral to bullish signaling that sideways to higher prices are possible near-term. Closes above last-Tuesday's high crossing at $8.79 1/4 would signal that a short-term low has been posted while opening the door for additional short-term gains. If March resumes the decline off October's high, August's low crossing at $8.11 3/4 is the next downside target. First resistance is last-Tuesday's high crossing at $8.79 1/4. Second resistance is the 50-day moving average crossing at $9.08. First support is the December 6th low crossing at $8.21 3/4. Second support is August's low crossing at $8.11 3/4.
March Minneapolis wheat was higher overnight and sets the stage for a higher opening when the day session begins trading. Stochastics and the RSI are neutral to bullish signaling that sideways to higher prices are possible near-term. Closes above last-Tuesday's high crossing at $9.32 would signal that a short-term low has been posted while opening the door for additional short-term gains. If March renews the decline off November's high, August's low crossing at $8.75 3/4 is the next downside target. First resistance is Thursday's high crossing at $9.34 3/4. Second resistance is the 50-day moving average crossing at $9.45 1/4. First support is the December 6th low crossing at $8.90. Second support is August's low crossing at $8.75 3/4.
SOYBEAN COMPLEX? http://quotes.ino.com/ex?changes/?c=grains "
March soybeans were higher overnight as it extends this month's trading range. Overnight strength sets the stage for a steady to higher opening as it extends the trading range of the past two-weeks. Stochastics and the RSI are neutral signaling that sideways trading is possible near-term. If March renews the rally off October's low, September's high crossing at $15.08 is the next upside target. Closes below Tuesday's low crossing at $14.62 1/4 would signal that a short-term top has been posted. First resistance is the December 9th high crossing at $14.97 1/4. Second resistance is September's high crossing at $15.08. First support is Tuesday's low crossing at $14.62 1/4. Second support is the 50-day moving average crossing at $14.45 3/4.
March soybean meal was a slightly higher overnight and sets the stage for a higher opening when the day session begins trading. However, stochastics and the RSI remain neutral to bearish signaling that sideways to lower prices are possible near-term. Closes below the 20-day moving average crossing at $442.60 would signal that the short-term trend has turned sideways to lower. If March renews the rally off November's low, monthly resistance on the continuation chart crossing at $478.60 is the next upside target is the next upside target. First resistance is the December 9th high crossing at $469.30. Second resistance is monthly resistance on the continuation chart crossing at $478.60. First support is Monday's low crossing at $443.40. Second support is the 20-day moving average crossing at $442.60.
March soybean oil was slightly higher overnight and sets the stage for a higher opening when the day session begins trading. Stochastics and the RSI are neutral to bullish signaling that sideways to higher prices are possible near-term. Closes above the 50-day moving average crossing at 66.88 would signal that a short-term low has been posted while opening the door for additional short-term gains. Closes below the 10-day moving average crossing at 63.43 would signal that a short-term top has been posted. First resistance is Wednesday's high crossing at 65.63. Second resistance is the 50-day moving average crossing at 66.88. First support is last-Friday's low crossing at 61.47. Second support is last-Monday's low crossing at 58.50.
Thank you tallpine!
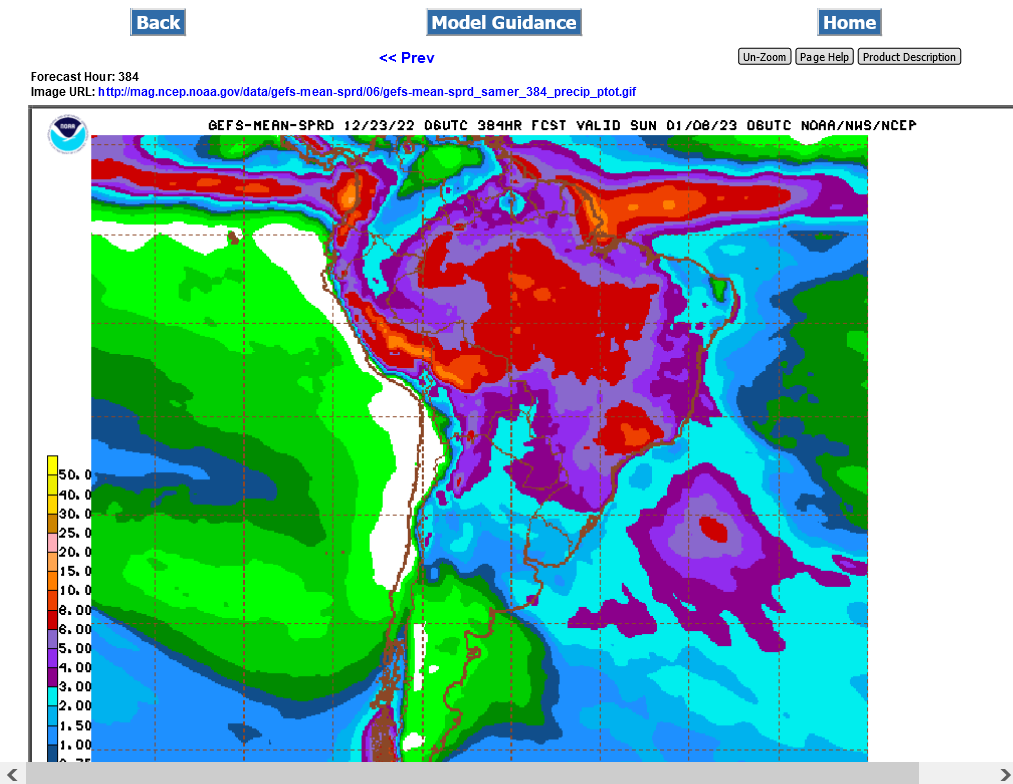
2 week Rains are less in the SOUTHERN growing areas of Argentina that's currently having severe drought from the La Nina (cold water anomalies in the tropical Pacific)
Soybean thread: