KEY EVENTS TO WATCH FOR:
Thursday, January 5, 2023
N/A 1st Quarter Manpower U.S. Employment Outlook Survey
7:30 AM ET. December Challenger Job-Cut Report
Job Cuts, M/M% (previous +127%)
8:15 AM ET. December ADP National Employment Report
Private Sector Jobs, Net Chg (expected +158000; previous +127000)
8:30 AM ET. November U.S. International Trade in Goods & Services
Trade Balance (USD) (expected -68.2B; previous -78.16B)
Exports (USD) (previous 256.63B)
Exports, M/M% (previous -0.7%)
Imports (USD) (previous 334.79B)
Imports, M/M% (previous +0.6%)
8:30 AM ET. Unemployment Insurance Weekly Claims Report - Initial Claims
Jobless Claims (expected 225K; previous 225K)
Jobless Claims, Net Chg (previous +9K)
Continuing Claims (previous 1710000)
Continuing Claims, Net Chg (previous +41K)
9:45 AM ET. December US Services PMI
PMI, Services (previous 46.2)
10:30 AM ET. EIA Weekly Natural Gas Storage Report
Working Gas In Storage (Cbf) (previous 3112B)
Working Gas In Storage, Net Chg (previous -213B)
11:00 AM ET. EIA Weekly Petroleum Status Report
Crude Oil Stocks (Bbl) (previous 418.952M)
Crude Oil Stocks, Net Chg (Bbl) (previous +0.718M)
Gasoline Stocks (Bbl) (previous 223.008M)
Gasoline Stocks, Net Chg (Bbl) (previous -3.105M)
Distillate Stocks (Bbl) (previous 120.212M)
Distillate Stocks, Net Chg (Bbl) (previous +0.283M)
Refinery Usage (previous 92.0%)
Total Prod Supplied (Bbl/day) (previous 22.822M)
Total Prod Supplied, Net Chg (Bbl/day) (previous +1.898M)
11:00 AM ET. December Global Services PMI
PMI, Services (previous 48.1)
12:00 PM ET. December Monthly U.S. Retail Chain Store Sales Index
2:00 PM ET. SEC Closed Meeting
4:30 PM ET. Federal Discount Window Borrowings
4:30 PM ET. Foreign Central Bank Holdings
Friday, January 6, 2023
8:30 AM ET. December U.S. Employment Report
Non-Farm Payrolls (expected +180K; previous +263K)
Unemployment Rate (expected 3.7%; previous 3.7%)
Avg Hourly Earnings (USD) (previous 32.82)
Avg Hourly Earnings-Net Chg (USD) (previous +0.18)
Avg Hourly Earnings, M/M% (expected +0.4%; previous +0.55%)
Avg Hourly Earnings, Y/Y% (previous +5.09%)
Overall Workweek (previous 34.4)
Overall Workweek Net Chg (previous -0.1)
Government Payrolls (previous +42K)
Private Payroll (previous +221K)
Participation Rate (previous 62.1%)
Non-Farm Payrolls Bench Net Chg
8:30 AM ET. U.S. Weekly Export Sales
10:00 AM ET. December ISM Report On Business Services PMI
Services PMI (expected 55.1; previous 56.5)
Business Activity Idx (previous 64.7)
Prices Idx (previous 70.0)
Employment Idx (previous 51.5)
New Orders Idx (previous 56.0)
10:00 AM ET. November Manufacturers' Shipments, Inventories & Orders (M3)
Total Orders, M/M% (expected -1.0%; previous +1.0%)
Orders, Ex-Defense, M/M% (previous +0.9%)
Orders, Ex-Transport, M/M% (previous +0.8%)
Durable Goods, M/M%
Monday, January 9, 2023
10:00 AM ET. December Employment Trends Index
ETI (previous 117.65)
ETI, Y/Y%
3:00 PM ET. November Consumer Credit
Consumer Credit Net Chg (USD) (previous +27.0B)
Tuesday, January 10, 2023
6:00 AM ET. December NFIB Index of Small Business Optimism
Small Business Idx (previous 91.9)
8:55 PM ET. Johnson Redbook Retail Sales Index
Ret Sales Mo-to-Date, Y/Y%
Latest Wk, Y/Y%
10:00 AM ET. January IBD/TIPP Economic Optimism Index
Economic Optimism Idx (previous 42.9)
6-Mo Economic Outlook (previous 37.7)
10:00 AM ET. November Monthly Wholesale Trade
Inventories, M/M% (previous +0.5%)
4:30 PM ET. API Weekly Statistical Bulletin
Crude Stocks, Net Chg (Bbls)
Gasoline Stocks, Net Chg (Bbls)
Distillate Stocks, Net Chg (Bbls)
N/A World Bank's Global Economic Prospects report
Wednesday, January 11, 2023
7:00 AM ET. MBA Weekly Mortgage Applications Survey
Composite Idx
Composite Idx, W/W%
Purchase Idx-SA
Purchase Idx-SA, W/W%
Refinance Idx
Refinance Idx, W/W%
10:00 AM ET. December Online Help Wanted Index
N/A EIA Weekly Petroleum Status Report
Crude Oil Stocks (Bbl)
Crude Oil Stocks, Net Chg (Bbl) Gasoline Stocks (Bbl)
Gasoline Stocks, Net Chg (Bbl)
Distillate Stocks (Bbl)
Distillate Stocks, Net Chg (Bbl)
Refinery Usage
Total Prod Supplied (Bbl/day)
Total Prod Supplied, (Bbl/day) Net Chg
The STOCK INDEXES? http://quotes.ino.com/ex?changes/?c=indexes
The STOCK INDEXES: The March NASDAQ 100 was steady to higher overnight as it extends the trading range of the past seven-days and sets the stage for a higher opening when the day session begins trading.Stochastics and the RSI are turning neutral to bullish signaling that sideways to higher prices are possible near-term. Closes above the 20-day moving average crossing at 11,303.21 would signal that a short-term low has been posted. If March resumes the decline off December's high, October's low crossing at 10,595.25 is the next downside target. First resistance is the 20-day moving average crossing at 11,303.21. Second resistance is the 50-day moving average crossing at 11,513.53. First support is November's low crossing at 10,746.75. Second support is October's low crossing at 10,595.25.
The March S&P 500 was slightly higher overnight as it extends the trading range of the past three-weeks. Overnight trading sets the stage for a steady to slightly higher opening when the day session begins trading. Stochastics and the RSI are turning neutral to bullish signaling that sideways to higher prices are possible near-term. Closes above the 50-day moving average crossing at 3939.82 would signal that a short-term low has been posted. If March renews the decline off December's high, November's low crossing at 3735.00 is the next downside target. First resistance is the 50-day moving average crossing at 3939.82. Second resistance is the 75% retracement level of the August-October decline crossing at 4155.39. First support is the November 9th low crossing at 3782.75. Second support is November's low crossing at 3735.00.
INTEREST RATES http://quotes.ino.com/ex changes/?c=interest"
INTEREST RATES: March T-bonds was steady to slightly higher overnight as it extends the rally off last-Friday's low. Overnight trading sets the stage for a steady to higher opening when the day session begins trading. Stochastics and the RSI have turned neutral to bullish signaling that sideways to higher prices are possible near-term. Closes above the 20-day moving average crossing at 128-19 would signal that a short-term low has been posted. If March renews the decline off December's high, the 62% retracement level of the October-December rally crossing at 123-06 is the next downside target. First resistance is the 20-day moving average crossing at 128-19. Second resistance is December's high crossing at 132-15. First support is the 50% retracement level of the October-December rally crossing at 124-31. Second support is the 62% retracement level of the October-December rally crossing at 123-06.
March T-notes were steady to slightly higher overnight as it extends the rally off last-Friday's low. Overnight trading sets the stage for a steady to slightly higher opening when the day session begins trading. Stochastics and the RSI are neutral to bullish signaling that sideways to higher prices are possible near-term. Closes above the 20-day moving average crossing at 113.207 would signal that a low has been posted. If March renews the decline off December's high, the 62% retracement level of the October-December rally crossing at 111.174 is the next downside target. First resistance is the 20-day moving average crossing at 113.207. Second resistance is December's high crossing at 115.115. First support is the 50% retracement level of the October-December rally crossing at 112.087. Second support is the 62% retracement level of the October-December rally crossing at 111.174.
ENERGY MARKETS? http://quotes.ino.com/ex?changes/?c=energy ""
ENERGIES:Februarycrude oil was higher overnight as it consolidates some of this week's decline. Overnight trading sets the stage for a higher opening when the day session begins trading. Stochastics and the RSI are becoming oversold but remain neutral to bearish signaling that sideways to lower prices are possible near-term. If February extends this week's decline, December's low crossing at $70.31 is the next downside target. Closes above Tuesday's high crossing at $81.50 would renew the rally off December's low. First resistance is Tuesday's high crossing at $81.50. Second resistance is December's high crossing at $83.27. First support is Wednesday's low crossing at $72.73. Second support is December's low crossing at $70.31.
February heating oil was higher overnight as it consolidates some of the decline off the December 27th high. Overnight trading sets the stage for a higher opening when the day session begins trading. Stochastics and the RSI are neutral to bearish signaling that sideways to lower prices are possible near-term. Closes above the 50-day moving average crossing at $3.2213 would signal that a short-term low has been posted. If February extends this week's decline, December's low crossing at $2.7517 is the next downside target. First resistance is the 10-day moving average crossing at $3.1706. Second resistance is the 50-day moving average crossing at $3.2213. Second resistance is the November 15th high crossing at $3.4722. First support is Wednesday's low crossing at $2.9215. Second support is December's low crossing at $2.7517.
February unleaded gas was higher overnight following as it consolidates some of this week's decline. Overnight trading sets the stage for a higher opening when the day session begins trading. Stochastics and the RSI are neutral to bearish signaling that sideways to lower prices are possible near-term. Closes below the 20-day moving average crossing at $2.2461 would signal that a short-term top has been posted. If February resumes the rally off December's low, the November 14th high crossing at $2.5783 is the next upside target. First resistance is last-Friday's high crossing at $2.5233. Second resistance is the November 14th high crossing at $2.5783. First support is the 20-day moving average crossing at $2.2461. Second support is the December 16th low crossing at $2.1157.
February natural gas was slightly lower overnight. Overnight trading sets the stage for a steady to slightly lower opening when the day session begins trading. Stochastics and the RSI are oversold but remain neutral to bearish signaling that sideways to lower prices are possible near-term. If February extends the decline off November's high, the 87% retracement level of the 2020-2022 rally crossing at 3.491 is the next downside target, Closes above the 20-day moving average crossing at 5.344 would signal that a short-term low has been posted. First resistance is the 10-day moving average crossing at 4.617. Second resistance is the 20-day moving average crossing at 5.344. First support is Tuesday's low crossing at 3.894. Second support is the 87% retracement level of the 2020-2022 rally crossing at 3.491.
CURRENCIEShttp://quotes.ino.com/ex changes/?c=currencies"
CURRENCIES:The March Dollar was steady to slightly higher overnight and is working on a possible inside day as it extends the trading range of the past three-weeks. Overnight trading sets the stage for a steady to higher opening when the day session begins trading. Stochastics and the RSI are neutral to bullish signaling that sideways to higher prices are possible near-term. Closes above the reaction high crossing at $105.445 would mark an upside breakout of the aforementioned trading range. If March renews the decline off September's high, the 75% retracement level of the March-September rally crossing at $101.331 is the next downside target. First resistance is the reaction high crossing at $105.445. Second resistance is the 50-day moving average crossing at $106.127. First support is the December 15th low crossing at $102.875. Second support is the 75% retracement level of the March-September rally crossing at $101.331.
The March Euro was steady to slightly higher overnight as it consolidates some of Tuesday's decline. Overnight trading sets the stage for a steady to slightly higher opening when the day session begins trading. Stochastics and the RSI are neutral to bearish signaling that sideways to lower prices are possible near-term. If March extends Tuesday's decline, the December 7th low crossing at $1.05210 is the next downside target. If March renews the rally off September's low, the March 31st high crossing at $1.09680 is the next upside target. First resistance is the 25% retracement level of the 2021-2022 crossing at $1.08062. Second resistance is the March 31st high crossing at $1.09680. First support is the December 7th low crossing at $1.05210. Second support is the 50-day moving average crossing at $1.04494.
The March British Pound was lower overnight as it extends the trading range of the past eight-days. Overnight trading sets the stage for a steady to lower opening when the day session begins trading.Stochastics and the RSI are turning neutral to bullish signaling that a low might be in or is near. Closes above the 20-day moving average crossing at 1.2169 would signal the a short-term low has been posted. Closes below the 50-day moving average crossing at 1.1956 would open the door for a possible test of the November 17th low crossing at 1.1804. First resistance is the 20-day moving average crossing at 1.2169. Second resistance is December's high crossing at 1.2477. First support is the 50-day moving average crossing at 1.1956. Second support is the November 17th low crossing at 1.1804.
The March Swiss Franc was slightly higher overnight as it is resuming the trading range of the past three-weeks. Overnight trading sets the stage for a higher opening when the day session begins trading. Stochastics and the RSI are turning neutral to bullish signaling that sideways to higher prices are possible near-term. If March resumes the rally off the November 21st low, the 62% retracement level of the 2021-2022 decline crossing at 1.10351 is the next upside target. Closes below the December 6th low crossing at 1.07000 would confirm that a short-term top has been posted while opening the door for additional weakness near-term. First resistance is December's high crossing at 1.09665. Second resistance is the 62% retracement level of the 2021-2022 decline crossing at 1.10351. First support is the December 6th low crossing at 1.07000. Second support is the 50-day moving average crossing at 1.06422.
The March Canadian Dollar was lower overnight while extending December's trading range. Overnight trading sets the stage for a lower opening when the day session begins trading. Stochastics and the RSI are turning neutral to bullish signaling that sideways to higher prices are possible near-term. If March resumes the decline off November's high, November's low crossing at $72.58 is the next downside target. Closes above Wednesday's high crossing at $74.25 would mark a potential upside breakout of December's trading range. First resistance is Wednesday's high crossing at $74.25. Second resistance is the December 5th high crossing at $74.82. First support is the December 20th low crossing at $73.04. Second support is November low crossing at $72.58.
The March Japanese Yen was steady to slightly higher in late-overnight trading. Overnight trading sets the stage for a slightly higher opening when the day session begins trading. Stochastics and the RSI are turning neutral to bearish signaling that sideways to lower prices are possible near-term. If March renews the rally off October's, the August high crossing at 0.078135 is the next upside target. Closes below the 20-day moving average crossing at 0.075305 would signal that a short-term top has been posted. First resistance is Tuesday's high crossing at 0.077935. Second resistance is the August high crossing at 0.078135. First support is the 20-day moving average crossing at 0.075305. Second support is the December 15th low crossing at 0.073210.
PRECIOUS METALS http://quotes.ino.com/ex changes/?c=metals"
PRECIOUS METALS: Februarygold was lower overnight as it consolidated some of the rally off November's low. Overnight trading sets the stage for a lower opening when the day session begins trading. Stochastics and the RSI are overbought but remain neutral to bullish signaling that sideways to higher prices are possible near-term. If February extends the rally off November's low, the 62% retracement level of the March-October decline crossing at $1915.10 is the next upside target. Closes below the 20-day moving average crossing at $1816.50 would signal that a short-term top has been posted. First resistance is Wednesday's high crossing at $1871.30. Second resistance is the 62% retracement level of the March-October decline crossing at $1915.10. First support is the 20-day moving average crossing at $1816.50. Second support is the December 15th low crossing at $1782.00.
March silver was lower overnight as it consolidates some of the rally off September's low. Overnight trading sets the stage for a lower opening when the day session begins trading later this morning. Stochastics and the RSI have turned neutral to bearish signaling that sideways to lower prices are possible near-term. Closes below the 20-day moving average crossing at $23.771 would signal that a short-term top has been posted while opening the door for additional weakness near-term. If March extends the rally off October's low, the 87% retracement level of the March-August decline crossing at $25.938 is the next upside target. First resistance is the 75% retracement level of the March-August decline crossing at $24.779. Second resistance is the 87% retracement level of the March-August decline crossing at $25.938. First support the 20-day moving average crossing at $23.771. Second support is the December 16th low crossing at $22.735.
March copper was sharply higher overnight while extending December's trading range. The high-range overnight trade sets the stage for a higher opening when the day session begins trading. Stochastics and the RSI are turning neutral to bullish signaling that sideways to higher prices are possible near-term. If March resumes the rally off the November 28th low, the 50% retracement level of the March-July decline crossing at 4.0343 is the next upside target. Closes below the 50-day moving average crossing at 3.7111 would confirm a downside breakout of December's trading range and would open the door for additional weakness near-term. First resistance is November's high crossing at 3.9470. Second resistance is the 50% retracement level of the March-July decline crossing at 4.0343. First support is the 50-day moving average crossing at 3.7111. Second support is the 38% retracement level of the September-November rally crossing at 3.6750.
GRAINS http://quotes.ino.com/ex changes/?c=grains
March corn was higher overnight as it consolidates some of decline off last-Friday's high. Overnight trading sets the stage for higher opening when the day sessions begins trading. Stochastics and the RSI are neutral to bearish signaling that sideways to lower prices are possible near-term. If March extends this week's decline, the December 19th low crossing at $6.44 is the next downside target. Closes above the 10-day moving average crossing at $6.68 1/2 would signal that a short-term low has been posted. First resistance is October's downtrend line crossing near $6.84. Second resistance is the 75% retracement level of the October-December decline crossing at $6.92 1/2. First support is is the December 19th low crossing at $6.44. Second support is December's low crossing at $6.35.
March wheat was higher overnight as it consolidates some of this week's decline. Overnight trading sets the stage for a higher opening when the day session begins trading. Stochastics and the RSI are neutral to bearish signaling that sideways to lower prices are possible near-term. If March extends this week's decline, the 75% retracement level of the 2020-2022 rally crossing at $7.24 1/4 is the next downside target. Closes above the 50-day moving average crossing at $8.00 would signal that a short-term low has been posted. First resistance is 50-day moving average crossing at $8.00. Second resistance is the November 25th high crossing at $8.20 1/4. First support is the 75% retracement level of the 2020-2022 rally crossing at $7.24 1/4. Second support is the 87% retracement level of the 2020-2022 rally crossing at $6.36 1/4.
March Kansas City wheat was higher overnight as it consolidates some of this week's decline. Overnight trading sets the stage for a higher opening when the day session begins trading later this morning. Stochastics and the RSI are neutral to bearish signaling that sideways to lower prices are possible near-term. If March extends this week's decline, December's low crossing at $8.21 3/4 is the next downside target. Closes above the 50-day moving average crossing at $8.97 1/4 would signal that a short-term low has been posted. First resistance is last-Tuesday's high crossing at $8.94 3/4. Second resistance is the 50-day moving average crossing at $8.97 1/4. First support is the December 19th low crossing at $8.30 3/4. Second support is the December 6th low crossing at $8.21 3/4.
March Minneapolis wheat was higher overnight as it consolidates some of this week's decline. Overnight trading sets the stage for a higher opening when the day session begins trading. Stochastics and the RSI are neutral to bearish signaling that sideways to lower prices are possible near-term. If March extends this week's decline, the December 19th low crossing at $9.00 3/4 is the next downside target. Closes above the 50-day moving average crossing at $9.39 1/2 would open the door for additional short-term gains. First resistance is the 50-day moving average crossing at $9.39 1/2. Second resistance is the November 15th high crossing at $9.91 1/4. First support is the December 19th low crossing at $9.00 3/4. Second support is the December 6th low crossing at $8.90.
SOYBEAN COMPLEX? http://quotes.ino.com/ex?changes/?c=grains "
March soybeans were higher overnight as it consolidates some of this week's sharp decline. Overnight trading sets the stage for a higher opening. Stochastics and the RSI are neutral to bearish signaling that sideways to lower prices are possible near-term. If March extends this week's decline, the 50-day moving average crossing at $14.60 1/4 is the next downside target. If March renews the rally off October's low, last-June's high crossing at $15.72 1/4 is the next upside target. First resistance is the 87% retracement level of the June-July decline crossing at $15.37 1/2. Second resistance is last-June's high crossing at $15.72 1/2. First support is Tuesday's low crossing at $14.80 3/4. Second support is the 50-day moving average crossing at $14.60 1/4.
March soybean meal was a lower overnight as it extends this week's decline and appears to be resuming December's trading range. Overnight trading sets the stage for a lower opening when the day session begins trading. Stochastics and the RSI are turning neutral to bearish signaling that sideways to lower prices are possible near-term. Closes below the December 19th low crossing at $443.40 would confirm that a short-term top has been posted. If March renews the rally off November's low, monthly resistance on the continuation chart crossing at $478.60 is the next upside target is the next upside target. First resistance is last-Friday's high crossing at $476.10. Second resistance is monthly resistance on the continuation chart crossing at $478.60. First support is the 20-day moving average crossing at $456.50. Second support is the December 19th low crossing at $443.40.
March soybean oil was higher overnight as it consolidates some of the decline off last-Friday's high. Overnight trading sets the stage for a higher opening when the day session begins trading. Stochastics and the RSI are neutral to bearish signaling that sideways to lower prices are possible near-term. If March extends this week's decline, the December 16th low crossing at 61.47 is the next downside target. Closes above the 50-day moving average crossing at 66.83 confirm that a low has been posted while opening the door for additional short-term gains. First resistance is the 50-day moving average crossing at 66.83. Second resistance is broken support crossing at 67.52. First support is the December 16th low crossing at 61.47. Second support is December's low crossing at 58.50.
Thanks very much tallpine!
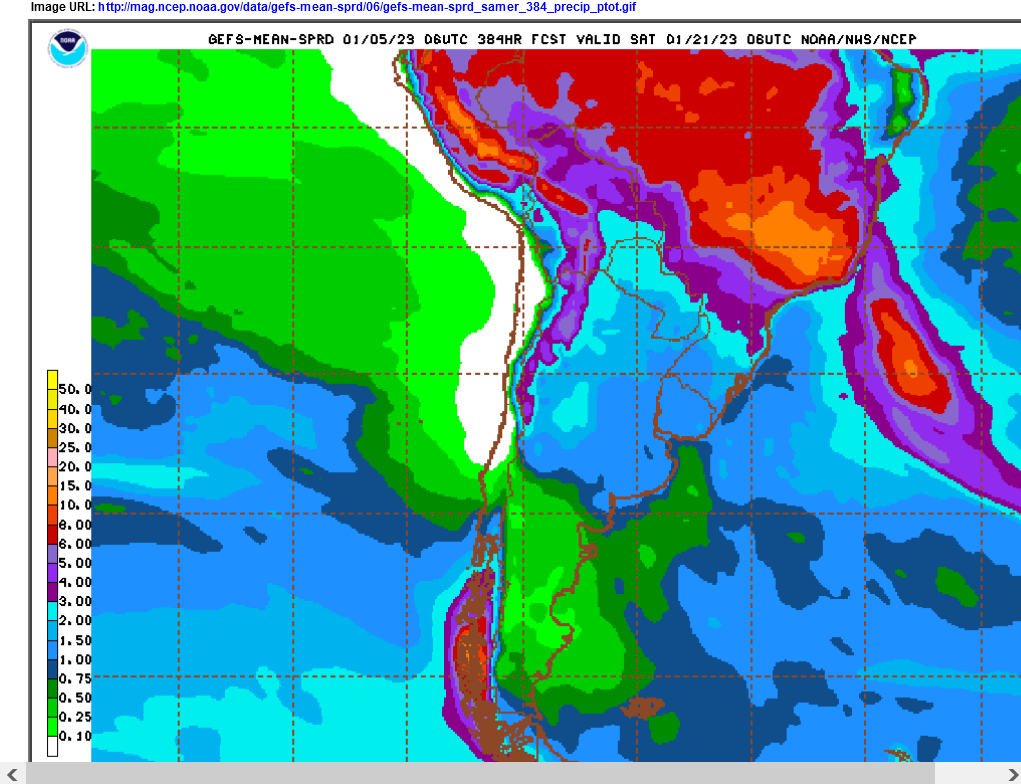
La Nina is dying fast, El Nino pattern taking shape in the Pacific, with a resumption of mostly beneficial global warming and drought relief on the West Coast and in Argentina.
Models picking up on increasing rain in Argentina.
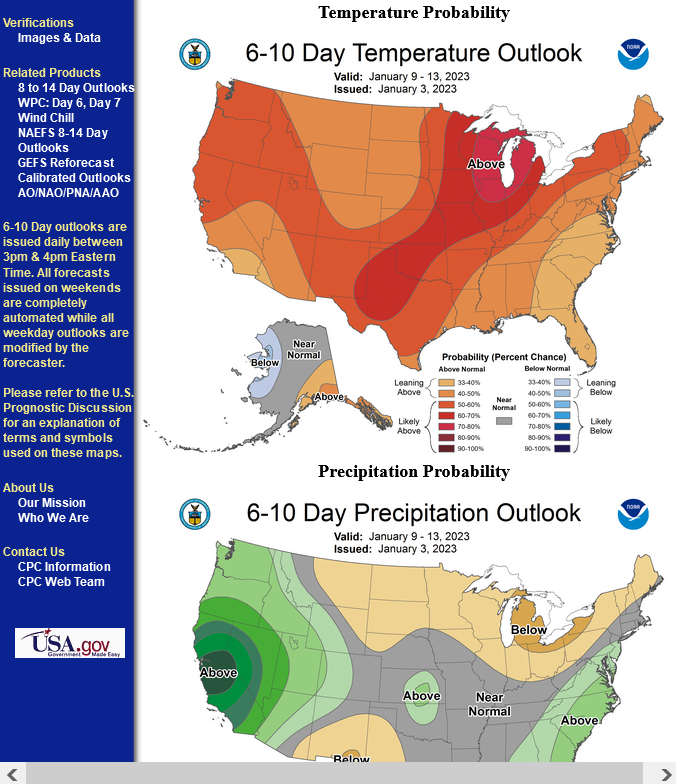
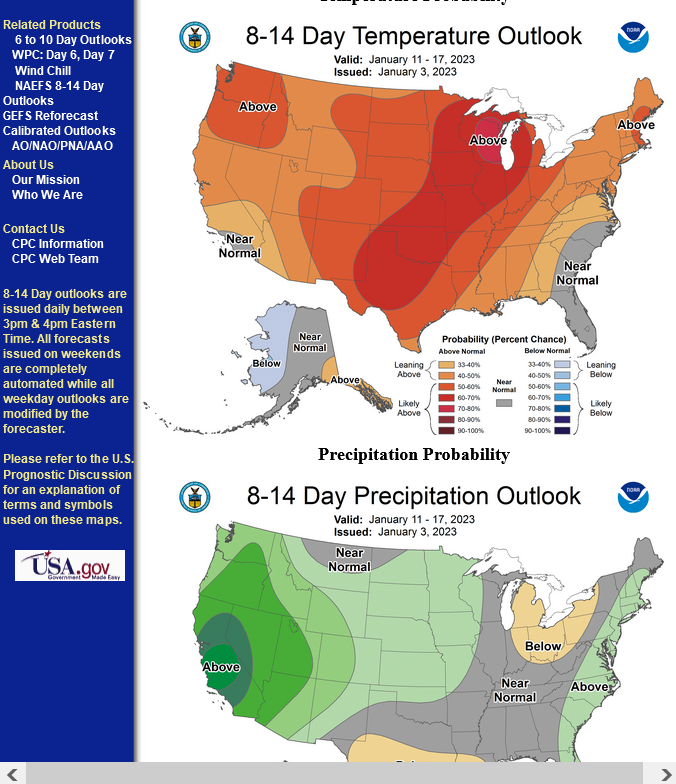
Extremely mild temps in the US. MEGA bearish Natural Gas!
https://www.marketforum.com/forum/topic/91060/#91893
This weather pattern is suggesting to us that the current La Nina is rapidly coming to an end.
The atmosphere is taking on the El Nino signature big time!
Regardless of what the models or Pacific ocean temp profiles indicate, the atmosphere is acting just like it does when we have El Nino in the Pacific.
I've not seen this configuration for several Winters.
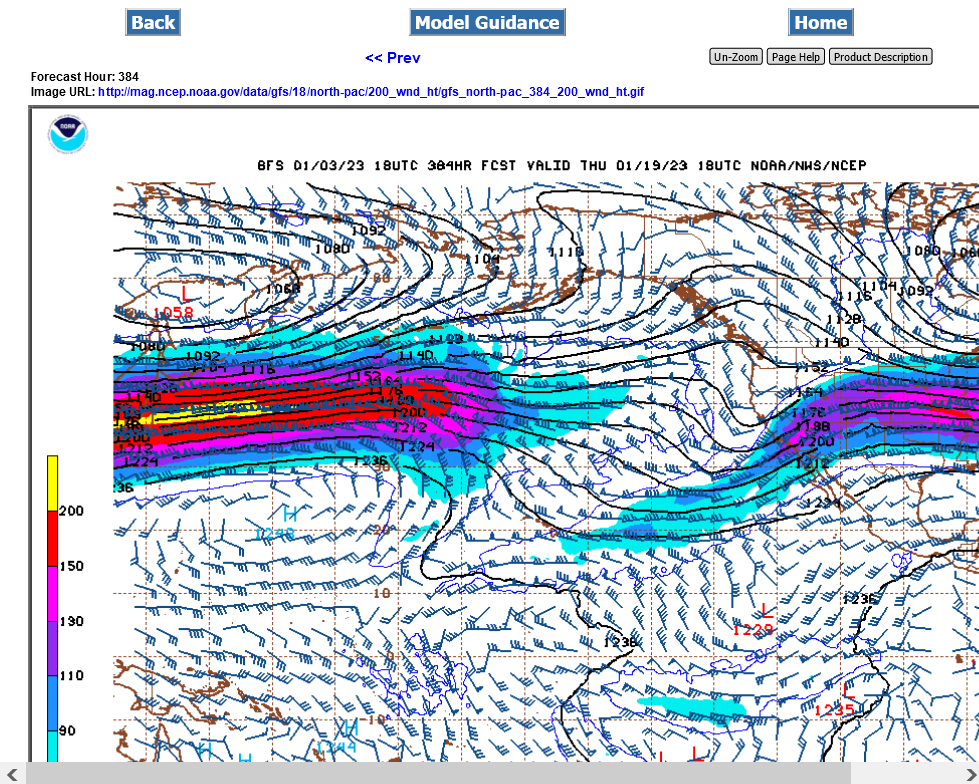
Look at that jet stream roaring across the Pacific. The yellow is a 200+ knot jet streak which is 240+ MPH!
You rarely see that and it's usually during El Nino's in the Pacific. It's aimed at the US, which will flood the entire US with mild, oceanic air and bombard the entire West Coast with heavy precip all the way to S.California which is typical of El Nino NOT La Nina.
To me, this signals the demise of the long lived La Nina!!
This should also bring a chance for drought relief in Argentina!
Ding, Dong the La Nina is (almost)dead, which La Nina, the 3 year old La Nina!
This will likely also mark the end of the multi year pause in the mostly beneficial global warming.
2022 was the 7th warmest year.
https://www.marketforum.com/forum/topic/91894/
I predict that 2023 will be warmer with high confidence and there will likely be less drought in the US because of it.