KEY EVENTS TO WATCH FOR:
Friday, January 6, 2023
8:30 AM ET. December U.S. Employment Report
Non-Farm Payrolls (expected +180K; previous +263K)
Unemployment Rate (expected 3.7%; previous 3.7%)
Avg Hourly Earnings (USD) (previous 32.82)
Avg Hourly Earnings-Net Chg (USD) (previous +0.18)
Avg Hourly Earnings, M/M% (expected +0.4%; previous +0.55%)
Avg Hourly Earnings, Y/Y% (previous +5.09%)
Overall Workweek (previous 34.4)
Overall Workweek Net Chg (previous -0.1)
Government Payrolls (previous +42K)
Private Payroll (previous +221K)
Participation Rate (previous 62.1%)
Non-Farm Payrolls Bench Net Chg
8:30 AM ET. U.S. Weekly Export Sales
10:00 AM ET. December ISM Report On Business Services PMI
Services PMI (expected 55.1; previous 56.5)
Business Activity Idx (previous 64.7)
Prices Idx (previous 70.0)
Employment Idx (previous 51.5)
New Orders Idx (previous 56.0)
10:00 AM ET. November Manufacturers' Shipments, Inventories & Orders (M3)
Total Orders, M/M% (expected -1.0%; previous +1.0%)
Orders, Ex-Defense, M/M% (previous +0.9%)
Orders, Ex-Transport, M/M% (previous +0.8%)
Durable Goods, M/M%
Monday, January 9, 2023
10:00 AM ET. December Employment Trends Index
ETI (previous 117.65)
ETI, Y/Y%
3:00 PM ET. November Consumer Credit
Consumer Credit Net Chg (USD) (previous +27.0B)
Tuesday, January 10, 2023
6:00 AM ET. December NFIB Index of Small Business Optimism
Small Business Idx (previous 91.9)
8:55 PM ET. Johnson Redbook Retail Sales Index
Ret Sales Mo-to-Date, Y/Y%
Latest Wk, Y/Y%
10:00 AM ET. January IBD/TIPP Economic Optimism Index
Economic Optimism Idx (previous 42.9)
6-Mo Economic Outlook (previous 37.7)
10:00 AM ET. November Monthly Wholesale Trade
Inventories, M/M% (previous +0.5%)
4:30 PM ET. API Weekly Statistical Bulletin
Crude Stocks, Net Chg (Bbls)
Gasoline Stocks, Net Chg (Bbls)
Distillate Stocks, Net Chg (Bbls)
N/A World Bank's Global Economic Prospects report
Wednesday, January 11, 2023
7:00 AM ET. MBA Weekly Mortgage Applications Survey
Composite Idx
Composite Idx, W/W%
Purchase Idx-SA
Purchase Idx-SA, W/W%
Refinance Idx
Refinance Idx, W/W%
10:00 AM ET. December Online Help Wanted Index
N/A EIA Weekly Petroleum Status Report
Crude Oil Stocks (Bbl)
Crude Oil Stocks, Net Chg (Bbl) Gasoline Stocks (Bbl)
Gasoline Stocks, Net Chg (Bbl)
Distillate Stocks (Bbl)
Distillate Stocks, Net Chg (Bbl)
Refinery Usage
Total Prod Supplied (Bbl/day)
Total Prod Supplied, Net Chg (Bbl/day)
The STOCK INDEXES? http://quotes.ino.com/ex?changes/?c=indexes
The Dow closed lower on Thursday as it extends the trading range of the past three-weeks. The high-range close sets the stage for a steady to slightly higher opening when Friday's day session begins trading. Stochastics and the RSI are neutral to bullish signaling that sideways to higher prices are possible near-term. Closes above the 50-day moving average crossing at 33,313.74 would signal that a short-term low has been posted. Closes below the December 22nd low 32,573.43 would mark a downside breakout of the aforementioned trading range and the resumption of the decline off December's high while opening the door for a possible test of November's low crossing at 31,727.05. First resistance is the 50-day moving average crossing at 33,313.74. Second resistance is December's high crossing at 34,712.28. First support is the December 22nd low crossing at 32,573.43. Second support is November's low crossing at 31,727.050.
The March NASDAQ 100 closed lower on Thursday as it extends the trading range of the past seven-days. The low-range close sets the stage for a steady to lower opening when Friday's day session begins trading. Stochastics and the RSI are oversold but remain neutral to bearish signaling sideways to lower prices are possible. If March extends the decline off December's high, October's low crossing at 10,595.25 is the next downside target. Closes above the 50-day moving average crossing at 11,510.72 would signal that a short-term low has been posted. First resistance is the 20-day moving average crossing at 11,295.00. Second resistance is the 50-day moving average crossing at 11,510.72. First support is November's low crossing at 10,746.75. Second support is October's low crossing at 10,595.25.
The March S&P 500 closed lower on Thursday as it extends the trading range of the past three-weeks. The low-range close sets the stage for a steady to lower opening when Friday's day session begins trading. Stochastics and the RSI are oversold but are turning neutral to bullish signaling that sideways to higher prices are possible near-term. Closes above the 50-day moving average crossing at 3939.07 would confirm that a short-term low has been posted. If March renews the decline off December's high, November's low crossing at 3735.00 is the next downside target. First resistance is the 50-day moving average crossing at 3939.07. Second resistance is the 62% retracement level of the August-October crossing at 4045.36. First support is the November 9th low crossing at 3782.75. Second support is November's low crossing at 3735.00.
INTEREST RATES? http://quotes.ino.com/ex?changes/?c=interest ""
March T-bonds closed up 1-pt. at 127-17.
March T-bonds closed slightly higher on Thursday as it consolidates some of this week's rally. The high-range close sets the stage for a steady to higher opening when Friday's day session begins trading. Stochastics and the RSI are neutral to bullish signaling that sideways to higher prices are possible near-term. Closes above the 20-day moving average crossing at 128-19 would signal that a short-term low has been posted. If March renews the decline off December's high, the 62% retracement level of the October-December rally crossing at 123-06 is the next downside target. First resistance is the 20-day moving average crossing at 128-19. Second resistance is December's high crossing at 132-15. First support is the 50% retracement level of the October-December rally crossing at 124-31. Second support is the 62% retracement level of the October-December rally crossing at 123-06.
March T-notes closed down 55-pts. at 113.005.
March T-notes closed lower on Thursday as it consolidates some of this week's rally. The low-range close sets the stage for a steady to lower opening when Friday's day session begins trading. Stochastics and the RSI have turned neutral to bullish signaling that sideways to higher prices are possible near-term. Closes above the 20-day moving average crossing at 113.203 would signal that a short-term low has been posted. If March renews the decline off December's high, the 62% retracement level of the October-December rally crossing at 111.174 is the next downside target. First resistance is the 20-day moving average crossing at 113.203. Second resistance is December's high crossing at 115.115. First support is last-Friday's low crossing at 111.280. Second support is the 62% retracement level of the October-December rally crossing at 111.174.
ENERGY MARKETS? http://quotes.ino.com/ex?changes/?c=energy ""
February crude oil closed higher on Thursday as it consolidated some of this week's decline. The mid-range close sets the stage for a steady to higher opening when Friday's day session begins. Stochastics and the RSI are becoming oversold but remain neutral to bearish signaling that sideways to lower prices are possible near-term. If February extends this week's decline, December's low crossing at $70.31 is the next downside target. Closes above the 50-day moving average crossing at $80.09 would signal that a short-term low has been posted. First resistance is the 50-day moving average crossing at $80.09. Second resistance is December's high crossing at $83.27. First support is today's low crossing at $72.46. Second support is December's low crossing at $70.31.
February heating oil closed slightly higher on Thursday as it consolidated some of the decline off December's high. The low-range close sets the stage for a steady to slightly higher opening when Friday's day trading session begins. Stochastics and the RSI are becoming oversold but remain neutral to bearish signaling that sideways to lower prices are possible near-term. If February extends this week's decline, December's low crossing at $2.7517 is the next downside target. Closes above the 50-day moving average crossing at $3.2196 would signal that a short-term low has been posted. First resistance is the 10-day moving average crossing at $3.1622. Second resistance is the 50-day moving average crossing at $3.2196. First support is today's low crossing at $2.9200. Second support is December's low crossing at $2.7517.
February unleaded gas posted an inside day with a slightly higher close on Wednesday as it consolidates some of this week's decline. The low-range close sets the stage for a steady to lower opening when Friday's day session begins trading. Stochastics and the RSI are neutral to bearish signaling that sideways to lower prices are possible near-term. Closes below the 20-day moving average crossing at 2.2443 would signal that a short-term top has been posted while opening the door for additional weakness near-term. If February renews the rally off December's low, the November 14th high crossing at $2.5783 is the next upside target. First resistance is last-Friday's high crossing at $2.4866. Second resistance is the November 14th high crossing at $2.5783. First support is the 20-day moving average crossing at $2.2443. Second support is the December 16th crossing at 2.1157.
February Henry natural gas closed lower on Thursday as it extended the decline off November's high. The low-range close sets the stage for a steady to lower opening when Friday's day session begins trading. Stochastics and the RSI are oversold but remain neutral to bearish signaling that sideways to lower prices are possible near-term. If February extends the aforementioned decline, the 87% retracement level of the 2020-2022 rally crossing at 3.238 is the next downside target. Closes above the 20-day moving average crossing at 4.826 would signal that a short-term low has been posted. First resistance is the 10-day moving average crossing at 4.144. Second resistance is the 20-day moving average crossing at 4.826. First support is today's low crossing at 3.414. Second support is the 87% retracement level of the 2020-2022 rally crossing at 3.238.
CURRENCIES? http://quotes.ino.com/ex?changes/?c=currencies ""
The March Dollar closed higher on Thursday as it extends December's trading range. The high-range close sets the stage for a steady to higher opening when Friday's day session begins trading. Stochastics and the RSI are neutral to bullish signaling that sideways to higher prices are possible near-term. Closes above the December 7th high crossing at $105.445 would signal that a short-term low has been posted. If March renews the decline off September's high, the 75% retracement level of the January-September rally crossing at $101.331 is the next downside target. First resistance is the December 7th high crossing at $105.445. Second resistance is the 50-day moving average crossing at $106.145. First support is the December 15th low crossing at $102.875. Second support is 75% retracement level of the January-September rally crossing at $101.331.
The March Euro closed lower on Thursday as it extended the decline off December's high. The low-range close sets the stage for a steady to lower opening when Friday's day session begins trading. Stochastics and the RSI are neutral to bearish signaling that sideways to lower prices are possible near-term. If March extends this week's decline, the 50-day moving average crossing at 1.04477 is the next downside target. If March resumes the rally off September's low, the March 31st high crossing at $1.09680 is the next upside target. First resistance is the 25% retracement level of the 2018-2022 decline crossing at $1.07982. Second resistance is the March 31st high crossing at $1.09680. First support is today's low crossing at $1.05620. Second support is the December 7th low crossing at $1.05210.
The March British Pound closed lower on Thursday and below the 50-day moving average crossing at 1.1954 as it extended the decline off December's high. The low-range close sets the stage for a steady to lower opening when Friday's day session begins trading. Stochastics and the RSI are oversold but remain neutral to bearish signaling sideways to lower prices are possible near-term. If March extends the aforementioned decline, the 38% retracement level of the September-December rally crossing at 1.1698 is the next downside target. Closes above the 20-day moving average crossing at 1.2163 would signal that a short-term low has been posted. First resistance is the 20-day moving average crossing at 1.2163. Second resistance is December's high crossing at 1.2479. First support is today's low crossing at 1.1892. Second support is the 38% retracement level of the September-December rally crossing at 1.1698.
The March Swiss Franc closed lower on Thursday. The low-range close sets the stage for a steady to lower opening when Friday's day session begins trading. Stochastics and the RSI are neutral to bearish signaling that sideways to lower prices are possible near-term. If March extends this week's decline, the 50-day moving average crossing at 1.06400 is the next downside target. If March renews the rally off September's low, the 62% retracement level of the 2018-2022 decline crossing at 1.10351 is the next upside target. First resistance is December's high crossing at 1.09665. Second resistance is the 62% retracement level of the 2018-2022 decline crossing at 1.10351. First support is Tuesday's low crossing at 1.07175. Second support is the 50-day moving average crossing at 1.06400.
The March Canadian Dollar closed lower on Thursday as it extends December's trading range. The low-range close sets the stage for a steady to lower opening when Friday's day session begins trading. Stochastics and the RSI are neutral signaling that sideways trading is possible near-term. Closes above Wednesday's high crossing at 74.25 would confirm that a short-term low has been posted while opening the door for additional short-term gains. If March renews the decline off November's high, the November 3rd low crossing at 72.58 is the next downside target. First resistance is the December 5th high crossing at 74.82. Second resistance is the November 25thhigh crossing at 75.16. First support is the December 16th low crossing at 73.04. Second support is the November 3rd low crossing at 72.58.
The March Japanese Yen closed lower on Thursday as it consolidated some of the rally off October's low. The low-range close sets the stage for a steady to lower opening when Friday’s day session begins trading. Stochastics and the RSI have turned neutral to bearish signaling that sideways to lower prices are possible near-term. Closes below the 20-day moving average crossing at 0.075282 would confirm that a short-term top has been posted. If March renews the rally off October's low, August's high crossing at 0.078135 is the next upside target. First resistance is Tuesday's high crossing at 0.077935. Second resistance is August's high crossing at 0.078135. First support is the 20-day moving average crossing at 0.075282. Second support is the December 15th crossing at 0.073210.
PRECIOUS METALS? http://quotes.ino.com/ex?changes/?c=metals ""
February gold closed lower on Thursday as it consolidates some of the rally off November's low. The low-range close sets the stage for a steady to lower opening when Friday's day session begins trading. Stochastics and the RSI are becoming overbought, diverging but remain neutral to bullish signaling that sideways to higher prices are possible near-term. If February extends the rally off November's low, the 62% retracement level of the March-October decline crossing at $1861.40 is the next upside target. Closes below the 20-day moving average crossing at $1815.90 would signal that a short-term top has been posted while opening the door for additional weakness near-term. First resistance is Wednesday's high crossing at $1871.30. Second resistance is the 62% retracement level of the March-October decline crossing at $1915.10. First support is the 20-day moving average crossing at $1815.90. Second support is the December 15th low crossing at $1782.00.
March silver closed lower for the second day in a row on Thursday as it extended the trading range of the past three-weeks. The low-range close sets the stage for a steady to lower opening when Friday's day session begins trading. Stochastics and the RSI are neutral to bearish signaling that sideways to lower prices are possible near-term. Today's close below the 20-day moving average crossing at 23.759 signals that a short-term top has been posted while opening the door for additional weakness near-term. If March renews the rally off October's low, the 87% retracement level of the March-August decline crossing at 25.938 is the next upside target. First resistance is the 75% retracement level of the March-September decline crossing at 24.779. Second resistance is the 87% retracement level of the March-August decline crossing at 25.938. First support is the December 16th low crossing at 22.735. Second support is the 50-day moving average crossing at 22.185.
March copper closed higher on Thursday as it extends December's trading range. The high-range close sets the stage for a steady to higher opening when Friday's day session begins trading. Stochastics and the RSI are turning neutral to bullish signaling that sideways to higher prices are possible near-term. Closes below the December 20th low crossing at 3.7230 would confirm a downside breakout of the aforementioned trading range. If March renews the rally off September's low, the 50% retracement level of the March-July decline crossing at 4.0343 is the next upside target. First resistance is November's high crossing at 3.9470. Second resistance is the 50% retracement level of the March-July decline crossing at 4.0343. First support is the December 20th low crossing at 3.7230. Second support is the 50-day moving average crossing at 3.7110.
GRAINS? http://quotes.ino.com/ex?changes/?c=grains "
March Corn closed down $0.01-cents at $6.52 3/4.
March corn closed lower on Thursday as it extended Wednesday's breakout below the 20-day moving average crossing at $6.58 1/2 confirming that an important top has been posted. The mid-range close sets the stage for a steady to lower opening when Friday's night session begins trading. Stochastics and the RSI are neutral to bearish signaling that sideways to lower prices are possible near-term. Closes above the 10-day moving average crossing at $6.68 1/4 would signal that a short-term low has been posted. First resistance is the 20-day moving average crossing near $6.58 1/2. Second resistance is the 10-day moving average crossing at $6.68 1/4. First support is the December 19th low crossing at $6.44. Second support is December's low crossing at $6.35.
March wheat closed up $0.01 1/4-cents at $7.46 3/4.
March wheat closed slightly higher on Thursday. The mid-range close sets the stage for a steady to slightly higher opening when Friday's day session begins trading. Stochastics and the RSI are neutral to bearish signaling that sideways to lower prices are possible near-term. If March extends this week's decline, December's low crossing at $7.23 1/2 is the next downside target. Closes above the 50-day moving average crossing at $8.00 would signal that a short-term low has been posted. First resistance is last-Friday's high crossing at $7.99. Second resistance is the 50-day moving average crossing at $8.00. First support is today's low crossing at $7.36. Second support is December's low crossing at $7.23 1/2.
March Kansas City Wheat closed down $0.01-cent at $8.39 3/4.
March Kansas City wheat closed lower on Thursday as it extended the decline off last-Friday's high. The mid-range close sets the stage for a steady to lower opening when Friday's day session begins trading. Stochastics and the RSI are neutral to bearish signaling that sideways to lower prices are possible near-term. If March extends this week's decline, the December 19th low crossing at $8.30 3/4 is the next downside target. Closes above the 50-day moving average crossing at $8.97 would renew the rally off December's low. First resistance is last-Tuesday's high crossing at $8.94 3/4. Second resistance is the 50-day moving average crossing at $8.97. First support is the December 19th low crossing at $8.30 3/4. Second support is the December 6th low crossing at $8.21 3/4.
March Minneapolis wheat closed up $0.05 1/2-cents at $9.09.
March Minneapolis wheat closed higher on Thursday. The high-range close sets the stage for a steady to higher opening when Friday's day session begins trading. Stochastics and the RSI have turned neutral to bearish signaling that sideways to lower prices are possible near-term. If March renews the decline off November's high, August's low crossing at $8.75 3/4 is the next downside target. Closes above the 50-day moving average crossing at $9.39 1/2 would open the door for additional short-term gains. First resistance is the 50-day moving average crossing at $9.39 1/2. Second resistance is the November 15th high crossing at $9.91 1/4. First support is the December 19th low crossing at $9.00 3/4. Second support is the December 6th low crossing at $8.90.
SOYBEAN COMPLEX? http://quotes.ino.com/ex?changes/?c=grains "
March soybeans closed down $0.12 3/4-cents at $14.70 3/4.
March soybeans closed lower for the third day in a row on Thursday. The mid-range close sets the stage for a steady to lower opening when Friday's day trade begins. Stochastics and the RSI are neutral to bearish signaling that sideways to lower prices are possible near-term. If March extends this week's decline, the 50-day moving average crossing at $14.60 is the next downside target. Closes above the 10-day moving average crossing at $14.93 1/4 would signal that a short-term low has been posted. First resistance is the 87% retracement level of the June-July decline crossing at $15.37 1/2. Second resistance is June's high crossing at $15.72 1/4. First support is the 50-day moving average crossing at $14.60. Second support is December's low crossing at $14.31 3/4.
March soybean meal closed up $2.20 at $464.90.
March soybean meal closed higher on Thursday. The high-range close sets the stage for a steady to higher opening when Friday's day session begins trading. Stochastics and the RSI are neutral to bullish signaling that sideways to higher prices are possible near-term. If March extends the rally off October's low, monthly resistance on the continuation chart crossing at $478.60 is the next upside target. Closes below the 20-day moving average crossing at $456.80 would confirm that a short-term top has been posted. First resistance is last-Friday's high crossing at $476.10. Second resistance is monthly resistance crossing at $478.60. First support is the 20-day moving average crossing at $456.80. Second support is the December 19th low crossing at $443.40.
March soybean oil closed down 40-pts. At 62.45.
March soybean oil closed lower on Thursday as it extends the decline off the December 27th high. The low-range close sets the stage for a steady to lower opening when Friday's day session begins trading. Stochastics and the RSI are neutral to bearish signaling that sideways to lower prices are possible near-term. If March extends the aforementioned decline, the December 16th low crossing at 61.47 is the next downside target. Closes above the 50-day moving average crossing at 66.80 would open the door for additional gains near-term. First resistance is the 50-day moving average crossing at 66.80. Second resistance is the November 29th high crossing at 72.49. First support is the December 16th low crossing at 61.47. Second support is December's low crossing at 58.50.
LIVESTOCKhttp://quotes.ino.com/exchanges/?c=livestock
February hogs closed down $1.40 at $82.68.
February hogs closed lower for the fifth-day in a row on Thursday as it extended the decline off the December 27th high. The mid-range close sets the stage for a steady to lower opening when Friday's day session begins trading. Stochastics and the RSI remain bearish signaling that sideways to lower prices are possible near-term. If February extends this week's decline, December's low crossing at $81.52 is the next downside target. Closes above the 50-day moving average crossing at $87.58 would signal that a short-term low has been posted. First resistance is the 50-day moving average crossing at $87.58. Second resistance is the December 27th high crossing at $91.60 First support is December's low crossing at $81.52. Second support is fib support crossing at 80.27.
February cattle closed up $0.08 at $157.35.
February cattle closed slightly higher on Thursday as it consolidated some of the decline off last-Thursday's high. The high-range close sets the stage for a steady to higher opening on Friday. Stochastics and the RSI are neutral to bearish signaling that sideways to lower prices are possible near-term. Closes below the 20-day moving average crossing at $156.50 would signal that a short-term top has been posted. If February renews the rally off November's low, the 87% retracement level of the monthly continuation chart crossing at $159.54 is the next upside target. First resistance is last-Thursday's high crossing at $159.18. Second resistance is the 87% retracement level of the monthly continuation chart crossing at $159.54. First support is the 20-day moving average crossing at $156.50. Second support is the 50-day moving average crossing at $155.70.
March Feeder cattle closed down $1.68 at $186.55.
March Feeder cattle posted an inside day with a lower close on Thursday as it consolidated some of Wednesday's rally. The low-range close sets the stage for a steady to lower opening when Friday's day session begins trading. Stochastics and the RSI are diverging but remain neutral signaling that sideways to higher prices are possible near-term. If March extends the rally off the 85% retracement level of the August-October decline crossing at $190.38 is the next upside target. Closes below the 50-day moving average crossing at $183.72 is needed to confirm that a short-term top has been posted. First resistance is the 75% retracement level of the August-October decline crossing at $188.29. Second resistance is the 85% retracement level of the August-October decline crossing at $190.38. First support is the 50-day moving average crossing at $183.72. Second support is the December 20th low crossing at $182.87.
FOOD & FIBERhttp://quotes.ino.com/ex changes/?c=food
March coffee closed lower on Thursday as it extended the decline off last-Wednesday's high. The low-range close sets the stage for a steady to lower opening on Friday. Stochastics and the RSI are oversold but remain neutral to bearish signaling sideways to lower prices are possible near-term. If March extends the decline off December's high, December's low crossing at $15.46 is the next downside target. Closes above last-Wednesday's high crossing at $17.50 would open the door for additional gains near-term. First resistance is last-Wednesday's high crossing at $17.50. Second resistance is November's high crossing at $17.82. First support is December's low crossing at $15.46. Second support is November's low crossing at $15.41.
March cocoa closed higher on Thursday. The mid-range close sets the stage for a steady to higher opening on Friday. Stochastics and the RSI are neutral to bullish signaling sideways to higher prices are possible near-term. If March extends the rally off September low, the March-2022 high on the weekly continuation chart crossing at 27.10 is the next upside target. Closes below the 20-day moving average crossing at 25.54 would signal that a short-term top has been posted while opening the door for additional weakness near-term.
March sugar closed lower on Thursday and below the 50-day moving average crossing at 19.51 as it extended the decline off December's high. The low-range close sets the stage for a steady to lower opening on Friday. Stochastics and the RSI are oversold but remain neutral to bearish signaling that sideways to lower prices are possible near-term. If March extends the aforementioned decline, the November 28th low crossing at 19.05 is the next downside target. Closes above the 10-day moving average crossing at 20.20 would signal that a short-term low has been posted.
March cotton closed higher on Thursday. The high-range close sets the stage for a steady to higher opening on Friday. Stochastics and the RSI are neutral to bearish signaling that sideways to lower prices are possible near-term. If March extends Wednesday's decline, December's low crossing at 78.80 is the next downside target. If March resumes the rally off October's low, the 50% retracement level of the August-October decline crossing at 93.31 is the next upside target.
thanks mr. Tallpine!
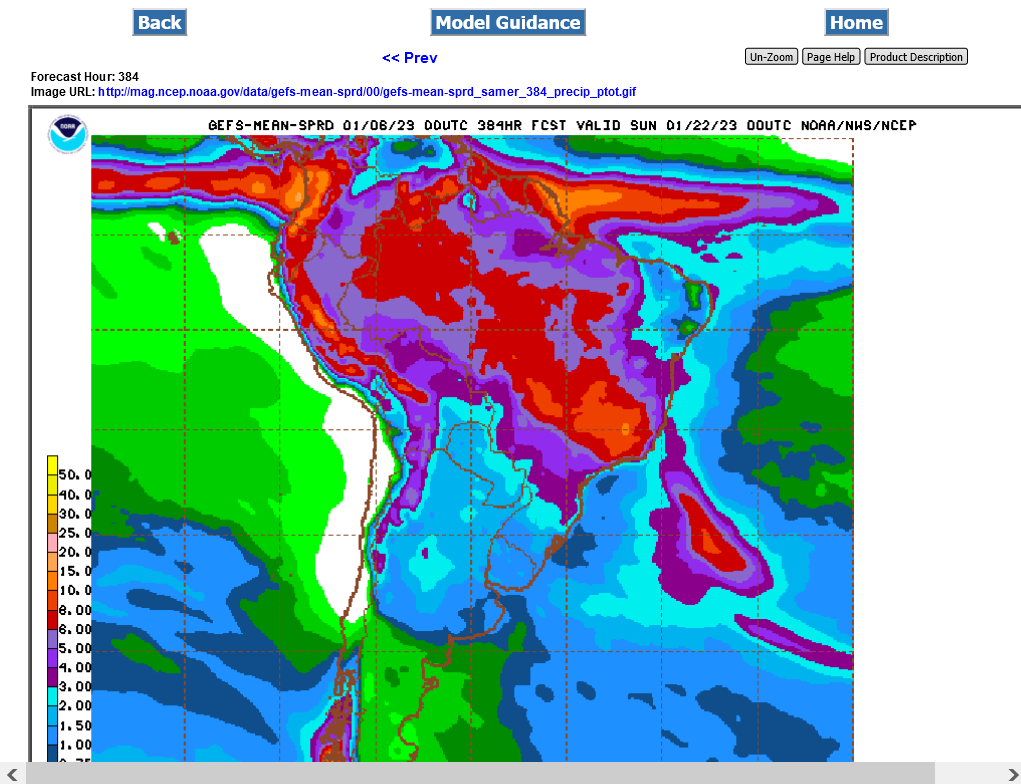
The most rain on a 2 week forecast model for Argentina in a long time!
Still a bit below average but the amounts are increasing.