KEY EVENTS TO WATCH FOR:
Monday, January 9, 2023
10:00 AM ET. December Employment Trends Index
ETI (previous 117.65)
ETI, Y/Y%
3:00 PM ET. November Consumer Credit
Consumer Credit Net Chg (USD) (previous +27.0B)
Tuesday, January 10, 2023
6:00 AM ET. December NFIB Index of Small Business Optimism
Small Business Idx (previous 91.9)
8:55 PM ET. Johnson Redbook Retail Sales Index
Ret Sales Mo-to-Date, Y/Y%
Latest Wk, Y/Y%
10:00 AM ET. January IBD/TIPP Economic Optimism Index
Economic Optimism Idx (previous 42.9)
6-Mo Economic Outlook (previous 37.7)
10:00 AM ET. November Monthly Wholesale Trade
Inventories, M/M% (previous +0.5%)
4:30 PM ET. API Weekly Statistical Bulletin
Crude Stocks, Net Chg (Bbls)
Gasoline Stocks, Net Chg (Bbls)
Distillate Stocks, Net Chg (Bbls)
N/A World Bank's Global Economic Prospects report
Wednesday, January 11, 2023
7:00 AM ET. MBA Weekly Mortgage Applications Survey
Composite Idx
Composite Idx, W/W%
Purchase Idx-SA
Purchase Idx-SA, W/W%
Refinance Idx
Refinance Idx, W/W%
10:00 AM ET. December Online Help Wanted Index
N/A EIA Weekly Petroleum Status Report
Crude Oil Stocks (Bbl)
Crude Oil Stocks, Net Chg (Bbl) Gasoline Stocks (Bbl)
Gasoline Stocks, Net Chg (Bbl)
Distillate Stocks (Bbl)
Distillate Stocks, Net Chg (Bbl)
Refinery Usage
Total Prod Supplied (Bbl/day)
Total Prod Supplied, Net Chg (Bbl/day)
The STOCK INDEXES? http://quotes.ino.com/ex?changes/?c=indexes
The Dow closed sharply higher on Friday as it marked an upside breakout of the trading range of the past three-weeks. The high-range close sets the stage for a higher opening when Monday's day session begins trading. Stochastics and the RSI are turning neutral to bullish signaling that sideways to higher prices are possible near-term. If the Dow extends today's rally, December's high crossing at 34,712.28 is the next upside target. Closes below the December 22nd low 32,573.43 would renew the decline off December's high while opening the door for a possible test of November's low crossing at 31,727.05. First resistance is today's high crossing at 33,660.73. Second resistance is December's high crossing at 34,712.28. First support is the December 22nd low crossing at 32,573.43. Second support is November's low crossing at 31,727.050.
The March NASDAQ 100 posted a key reversal up as it closed sharply higher on Friday while extending the trading range of the past eight-days. The high-range close sets the stage for a steady to higher opening when Monday's day session begins trading. Stochastics and the RSI are oversold but are turning neutral to bullish signaling sideways trading is possible. Closes above the 50-day moving average crossing at 11,495.78 would signal that a short-term low has been posted. If March extends the decline off December's high, October's low crossing at 10,595.25 is the next downside target. First resistance is the 50-day moving average crossing at 11,495.78. Second resistance is the 38% retracement level of the August-October decline crossing at 11,839.97. First support is November's low crossing at 10,746.75. Second support is October's low crossing at 10,595.25.
The March S&P 500 posted a key reversal up and closed sharply higher on Friday as it extends the trading range of the past three-weeks. The high-range close sets the stage for a steady to higher opening when Monday's day session begins trading. Stochastics and the RSI are turning neutral to bullish signaling that sideways to higher prices are possible near-term. Closes above the 50-day moving average crossing at 3939.33 would confirm that a short-term low has been posted. If March renews the decline off December's high, November's low crossing at 3735.00 is the next downside target. First resistance is the 50-day moving average crossing at 3939.33. Second resistance is the 62% retracement level of the August-October crossing at 4045.36. First support is the November 9th low crossing at 3782.75. Second support is November's low crossing at 3735.00.
INTEREST RATES? http://quotes.ino.com/ex?changes/?c=interest ""
March T-bonds closed up 1-25 pts. at 129-10.
March T-bonds closed sharply higher on Friday and above the 20-day moving average crossing at 128-14 signaling that a short-term low has been posted. The high-range close sets the stage for a steady to higher opening when Monday's day session begins trading. Stochastics and the RSI are neutral to bullish signaling that sideways to higher prices are possible near-term. If March extends this week's rally, December's high crossing at 132-15 is the next upside target. If March renews the decline off December's high, the 62% retracement level of the October-December rally crossing at 123-06 is the next downside target. First resistance is today's high crossing at 129-16. Second resistance is December's high crossing at 132-15. First support is the 50% retracement level of the October-December rally crossing at 124-31. Second support is the 62% retracement level of the October-December rally crossing at 123-06.
March T-notes closed up 1095-pts. at 114.100.
March T-notes closed sharply higher on Friday and above the 20-day moving average crossing at 113.189 signaling that a short-term low has been posted. The high-range close sets the stage for a steady to higher opening when Monday's day session begins trading. Stochastics and the RSI are neutral to bullish signaling that sideways to higher prices are possible near-term. If December extends this week's rally, December's high crossing at 115.115 is the next upside target. If March renews the decline off December's high, the 62% retracement level of the October-December rally crossing at 111.174 is the next downside target. First resistance is today's high crossing at 114.095. Second resistance is December's high crossing at 115.115. First support is last-Friday's low crossing at 111.280. Second support is the 62% retracement level of the October-December rally crossing at 111.174.
ENERGY MARKETS? http://quotes.ino.com/ex?changes/?c=energy ""
February crude oil closed slightly higher on Friday as it consolidated some of this week's decline. The low-range close sets the stage for a steady to lower opening when Monday's day session begins. Stochastics and the RSI are oversold but remain neutral to bearish signaling that sideways to lower prices are possible near-term. If February renews this week's decline, December's low crossing at $70.31 is the next downside target. Closes above the 50-day moving average crossing at $79.90 would signal that a short-term low has been posted. First resistance is the 50-day moving average crossing at $79.90. Second resistance is December's high crossing at $83.27. First support is Thursday's low crossing at $72.46. Second support is December's low crossing at $70.31.
February heating oil closed slightly higher on Friday as it consolidated some of the decline off December's high. The mid-range close sets the stage for a steady to slightly higher opening when Monday's day trading session begins. Stochastics and the RSI are oversold but remain neutral to bearish signaling that sideways to lower prices are possible near-term. If February extends this week's decline, December's low crossing at $2.7517 is the next downside target. Closes above the 50-day moving average crossing at $3.2125 would signal that a short-term low has been posted. First resistance is the 20-day moving average crossing at $3.0907. Second resistance is the 10-day moving average crossing at $3.1518. First support is Thursday's low crossing at $2.9200. Second support is December's low crossing at $2.7517.
February unleaded gas closed slightly lower on Friday as it extends this week's decline. The low-range close sets the stage for a steady to lower opening when Monday's day session begins trading. Stochastics and the RSI are neutral to bearish signaling that sideways to lower prices are possible near-term. Closes below the 20-day moving average crossing at 2.2527 would signal that a short-term top has been posted while opening the door for additional weakness near-term. Closes above the 50-day moving average crossing at 2.3476 would signal that a short-term low has been posted. First resistance is the 50-day moving average crossing at 2.3476. Second resistance is last-Friday's high crossing at $2.4866. First support is the 20-day moving average crossing at $2.2527. Second support is the December 16th crossing at 2.1157.
February Henry natural gas closed slightly higher on Friday as it consolidated some of the decline off November's high. The high-range close sets the stage for a steady to higher opening when Monday's day session begins trading. Stochastics and the RSI are oversold but remain neutral to bearish signaling that sideways to lower prices are possible near-term. If February extends the aforementioned decline, the 87% retracement level of the 2020-2022 rally crossing at 3.238 is the next downside target. Closes above the 20-day moving average crossing at 5.234 would signal that a short-term low has been posted.First resistance is the 10-day moving average crossing at 4.436. Second resistance is the 20-day moving average crossing at 5.234. First support is today's low crossing at 3.520. Second support is the 87% retracement level of the 2020-2022 rally crossing at 3.238.
CURRENCIES? http://quotes.ino.com/ex?changes/?c=currencies ""
The March Dollar posted a key reversal down as it closed lower on Friday. The low-range close sets the stage for a steady to lower opening when Monday's day session begins trading. Stochastics and the RSI are turning neutral to bearish signaling that sideways to lower prices are possible near-term. If March renews the decline off September's high, the 75% retracement level of the January-September rally crossing at $101.331 is the next downside target. Closes above the December 7th high crossing at $105.445 would signal that a short-term low has been posted. First resistance is the December 7th high crossing at $105.445. Second resistance is the 50-day moving average crossing at $106.033. First support is the December 15th low crossing at $102.875. Second support is 75% retracement level of the January-September rally crossing at $101.331.
The March Euro posted a key reversal up and closed higher on Friday as it consolidated some of the decline off December's high. The high-range close sets the stage for a steady to higher opening when Monday's day session begins trading. Stochastics and the RSI are turning neutral to bullish signaling that sideways to higher prices are possible near-term. If March resumes the rally off September's low, the March 31st high crossing at $1.09680 is the next upside target. If March extends this week's decline, the 50-day moving average crossing at 1.04602 is the next downside target. First resistance is the 25% retracement level of the 2018-2022 decline crossing at $1.07982. Second resistance is the March 31st high crossing at $1.09680. First support is today's low crossing at $1.05290. Second support is the December 7th low crossing at $1.04602.
The March British Pound posted a key reversal up as it closed higher on Friday. Closes above the 20-day moving average crossing at 1.2157 would signal that a short-term low has been posted. The high-range close sets the stage for a steady to lower opening when Monday's day session begins trading. Stochastics and the RSI are oversold but are turning neutral to bullish signaling sideways to higher prices are possible near-term. If March extends the decline off December's high, the 38% retracement level of the September-December rally crossing at 1.1698 is the next downside target. First resistance is the 20-day moving average crossing at 1.2157. Second resistance is December's high crossing at 1.2479. First support is today's low crossing at 1.1861. Second support is the 38% retracement level of the September-December rally crossing at 1.1698.
The March Swiss Franc closed sharply higher on Friday. The high-range close sets the stage for a steady to higher opening when Monday's day session begins trading. Stochastics and the RSI are turning neutral to bullish signaling that sideways to higher prices are possible near-term. If March renews the rally off September's low, the 62% retracement level of the 2018-2022 decline crossing at 1.10351 is the next upside target. If March extends this week's decline, the 50-day moving average crossing at 1.06530 is the next downside target. First resistance is December's high crossing at 1.09665. Second resistance is the 62% retracement level of the 2018-2022 decline crossing at 1.10351. First support is today's low crossing at 1.06915. Second support is the 50-day moving average crossing at 1.06530.
The March Canadian Dollar posted a key reversal up and closed sharply higher on Friday marking a potential upside breakout of the December-January trading range. The high-range close sets the stage for a steady to higher opening when Monday's day session begins trading. Stochastics and the RSI are neutral to bullish signaling that sideways to higher prices are possible near-term. Today's close above Wednesday's high crossing at 74.25 signals that a short-term low has been posted while opening the door for additional short-term gains. If March renews the decline off November's high, the November 3rd low crossing at 72.58 is the next downside target. First resistance is the December 5th high crossing at 74.82. Second resistance is the November 25thhigh crossing at 75.16. First support is the December 16th low crossing at 73.04. Second support is the November 3rd low crossing at 72.58.
The March Japanese Yen closed higher on Friday as it consolidated some of the decline off Tuesday's high. The high-range close sets the stage for a steady to higher opening when Monday’s day session begins trading. Stochastics and the RSI are neutral to bearish signaling that sideways to lower prices are possible near-term. Closes below the 20-day moving average crossing at 0.075387 would confirm that a short-term top has been posted while opening the door for additional weakness near-term. If March renews the rally off October's low, August's high crossing at 0.078135 is the next upside target. First resistance is Tuesday's high crossing at 0.077935. Second resistance is August's high crossing at 0.078135. First support is the 20-day moving average crossing at 0.075387. Second support is the December 15th crossing at 0.073210.
PRECIOUS METALS? http://quotes.ino.com/ex?changes/?c=metals ""
February gold closed sharply higher on Friday as it extends the rally off November's low. The high-range close sets the stage for a steady to higher opening when Monday's day session begins trading. Stochastics and the RSI are overbought but remain neutral to bullish signaling that sideways to higher prices are possible near-term. If February extends the rally off November's low, the 62% retracement level of the March-October decline crossing at $1861.40 is the next upside target. Closes below the 20-day moving average crossing at $1819.70 would signal that a short-term top has been posted while opening the door for additional weakness near-term. First resistance is today's high crossing at $1875.20. Second resistance is the 62% retracement level of the March-October decline crossing at $1915.10. First support is the 20-day moving average crossing at $1819.70. Second support is the December 15th low crossing at $1782.00.
March silver posted an inside day with a higher close on Friday as it extended the trading range of the past three-weeks. The high-range close sets the stage for a steady to higher opening when Monday's day session begins trading. Stochastics and the RSI are neutral to bearish signaling that sideways to lower prices are possible near-term. If March extends this week's decline, the 50-day moving average crossing at 22.275 is the next downside target. If March renews the rally off October's low, the 87% retracement level of the March-August decline crossing at 25.938 is the next upside target. First resistance is the 75% retracement level of the March-September decline crossing at 24.779. Second resistance is the 87% retracement level of the March-August decline crossing at 25.938. First support is the December 16th low crossing at 22.735. Second support is the 50-day moving average crossing at 22.275.
March copper closed higher on Friday as it extends December's trading range. The high-range close sets the stage for a steady to higher opening when Monday's day session begins trading. Stochastics and the RSI have turned neutral to bullish signaling that sideways to higher prices are possible near-term. Closes below Wednesday's low crossing at 3.7085 would confirm a downside breakout of the aforementioned trading range. If March renews the rally off September's low, the 50% retracement level of the March-July decline crossing at 4.0343 is the next upside target. First resistance is November's high crossing at 3.9470. Second resistance is the 50% retracement level of the March-July decline crossing at 4.0343. First support is Wednesday's low crossing at 3.7085. Second support is the 38% retracement level of the September-December rally crossing at 3.6750.
GRAINS? http://quotes.ino.com/ex?changes/?c=grains "
March Corn closed up $0.01 1/4-cents at $6.54.
March corn closed higher on Friday as it consolidates some of this week's decline but remains below the 20-day moving average crossing at $6.59 1/4 confirming that an important top has been posted. The low-range close sets the stage for a steady to lower opening when Monday's night session begins trading. Stochastics and the RSI are neutral to bearish signaling that sideways to lower prices are possible near-term. If March extends this week's decline, the December 19th low crossing at $6.44 is the next downside target. Closes above the 10-day moving average crossing at $6.67 1/4 would signal that a short-term low has been posted. First resistance is the 20-day moving average crossing near $6.59 1/4. Second resistance is the 10-day moving average crossing at $6.67 1/4. First support is the December 19th low crossing at $6.44. Second support is December's low crossing at $6.35.
March wheat closed down $0.03 1/4-cents at $7.43 1/2.
March wheat closed lower on Friday. The low-range close sets the stage for a steady to lower opening when Monday's day session begins trading. Stochastics and the RSI are oversold but remain neutral to bearish signaling that sideways to lower prices are possible near-term. If March extends this week's decline, December's low crossing at $7.23 1/2 is the next downside target. Closes above the 50-day moving average crossing at $7.97 3/4 would signal that a short-term low has been posted. First resistance is the 50-day moving average crossing at $7.97 3/4. Second resistance is the November 25th high crossing at $8.20 1/4. First support is Thursday's low crossing at $7.36. Second support is December's low crossing at $7.23 1/2.
March Kansas City Wheat closed down $0.07 3/4-cents at $8.32.
March Kansas City wheat closed lower on Friday as it extended the decline off last-Friday's high. The low-range close sets the stage for a steady to lower opening when Monday's day session begins trading. Stochastics and the RSI are oversold but remain neutral to bearish signaling that sideways to lower prices are possible near-term. If March extends this week's decline, December's low crossing at $8.21 3/4 is the next downside target. Closes above the 50-day moving average crossing at $8.95 would renew the rally off December's low.First resistance is the 50-day moving average crossing at $8.95. Second resistance is 25% retracement level of the May-August-2021 decline crossing at $9.50. First support is the December 19th low crossing at $8.30 3/4. Second support is the December 6th low crossing at $8.21 3/4.
March Minneapolis wheat closed down $0.07 1/4-cents at $9.01 3/4.
March Minneapolis wheat closed lower on Friday. The low-range close sets the stage for a steady to lower opening when Monday's day session begins trading. Stochastics and the RSI are oversold but remain neutral to bearish signaling that sideways to lower prices are possible near-term. If March renews the decline off November's high, August's low crossing at $8.75 3/4 is the next downside target. Closes above the 50-day moving average crossing at $9.38 1/4 would open the door for additional short-term gains. First resistance is the 50-day moving average crossing at $9.38 1/4. Second resistance is the November 15th high crossing at $9.91 1/4. First support is the December 19th low crossing at $9.00 3/4. Second support is the December 6th low crossing at $8.90.
SOYBEAN COMPLEX? http://quotes.ino.com/ex?changes/?c=grains "
March soybeans closed down $0.21 3/4-cents at $14.92 1/2.
March soybeans gapped up and closed higher on Friday as it consolidated some of this week's decline. The high-range close sets the stage for a steady to higher opening when Monday's day trade begins. Stochastics and the RSI are neutral to bearish signaling that sideways to lower prices are possible near-term. If March extends this week's decline, the 50-day moving average crossing at $14.61 3/4 is the next downside target. Closes above the 10-day moving average crossing at $14.93 3/4 would signal that a short-term low has been posted. First resistance is the 87% retracement level of the June-July decline crossing at $15.37 1/2. Second resistance is June's high crossing at $15.72 1/4. First support is the 50-day moving average crossing at $14.61 3/4. Second support is December's low crossing at $14.31 3/4.
March soybean meal closed up $12.70 at $477.60.
March soybean meal closed higher on Friday as it renewed the rally off October's low. The high-range close sets the stage for a steady to higher opening when Monday's day session begins trading. Stochastics and the RSI are turning neutral to bullish signaling that sideways to higher prices are possible near-term. If March extends the rally off October's low, the August 29th high on the monthly continuation chart crossing at $488.40 is the next upside target. Closes below the 20-day moving average crossing at $457.70 would confirm that a short-term top has been posted. First resistance is today's high crossing at $479.00. Second resistance is the August 29th high on the monthly continuation chart crossing at $488.40 is the next upside target. First support is the 20-day moving average crossing at $457.70. Second support is the December 19th low crossing at $443.40.
March soybean oil closed up 75-pts. At 63.17.
March soybean oil closed higher on Friday as it consolidates some of the decline off the December 27th high. The high-range close sets the stage for a steady to higher opening when Monday's day session begins trading. Stochastics and the RSI are neutral to bearish signaling that sideways to lower prices are possible near-term. If March extends the aforementioned decline, the December 16th low crossing at 61.47 is the next downside target. Closes above the 50-day moving average crossing at 66.73 would open the door for additional gains near-term. First resistance is the 50-day moving average crossing at 66.73. Second resistance is the November 29th high crossing at 72.49. First support is the December 16th low crossing at 61.47. Second support is December's low crossing at 58.50.
LIVESTOCKhttp://quotes.ino.com/exchanges/?c=livestock
February hogs closed down $1.95 at $80.58.
February hogs closed lower for the sixth-day in a row on Friday as it extended the decline off the December 27th high. The low-range close sets the stage for a steady to lower opening when Monday's day session begins trading. Stochastics and the RSI are oversold but remain bearish signaling that sideways to lower prices are possible near-term. If February extends this week's decline, the 87% retracement level of the October-December rally crossing at $78.47 is the next downside target. Closes above the 20-day moving average crossing at $85.70 would signal that a short-term low has been posted. First resistance is the 20-day moving average crossing at $85.70. Second resistance is the 50-day moving average crossing at $87.38. First support is the 75% retracement level of the October-December rally crossing at $80.27. Second support is the 87% retracement level of the October-December rally crossing at $78.47.
February cattle closed down $0.58 at $156.78.
February cattle closed lower on Friday as it extended the decline off December's high. The low-range close sets the stage for a steady to lower opening on Monday. Stochastics and the RSI are neutral to bearish signaling that sideways to lower prices are possible near-term. Closes below the 20-day moving average crossing at $156.67 would signal that a short-term top has been posted. If February renews the rally off November's low, the 87% retracement level of the monthly continuation chart crossing at $159.54 is the next upside target. First resistance is last-Thursday's high crossing at $159.18. Second resistance is the 87% retracement level of the monthly continuation chart crossing at $159.54. First support is the 20-day moving average crossing at $156.67. Second support is the 50-day moving average crossing at $155.70.
March Feeder cattle closed down $0.98 at $185.58.
March Feeder cattle closed lower on Friday as it consolidated some of Wednesday's rally. The low-range close sets the stage for a steady to lower opening when Monday's day session begins trading. Stochastics and the RSI are diverging but remain neutral signaling that sideways to higher prices are possible near-term. If March extends the rally off the 87% retracement level of the August-October decline crossing at $190.38 is the next upside target. Closes below the 50-day moving average crossing at $183.80 is needed to confirm that a short-term top has been posted. First resistance is the 75% retracement level of the August-October decline crossing at $188.29. Second resistance is the 87% retracement level of the August-October decline crossing at $190.38. First support is the 50-day moving average crossing at $183.80. Second support is the December 20th low crossing at $182.87.
FOOD & FIBERhttp://quotes.ino.com/ex changes/?c=food
March coffee closed lower on Friday as it extended the decline off last-Wednesday's high. The low-range close sets the stage for a steady to lower opening on Monday. Stochastics and the RSI are oversold but remain neutral to bearish signaling sideways to lower prices are possible near-term. If March extends the decline off December's high, December's low crossing at $15.46 is the next downside target. Closes above last-Wednesday's high crossing at $17.50 would open the door for additional gains near-term. First resistance is last-Wednesday's high crossing at $17.50. Second resistance is November's high crossing at $17.82. First support is December's low crossing at $15.46. Second support is November's low crossing at $15.41.
March cocoa closed lower on Friday. The high-range close sets the stage for a steady to higher opening on Monday. Stochastics and the RSI are neutral to bullish signaling sideways to higher prices are possible near-term. If March renews the rally off September low, the March-2022 high on the weekly continuation chart crossing at 27.10 is the next upside target. Closes below the 20-day moving average crossing at 25.59 would signal that a short-term top has been posted while opening the door for additional weakness near-term.
March sugar closed sharply lower on Friday as it extends the decline off December's high. The low-range close sets the stage for a steady to lower opening on Monday. Stochastics and the RSI are oversold but remain neutral to bearish signaling that sideways to lower prices are possible near-term. If March extends the aforementioned decline, the 62% retracement level of the September-December rally crossing at 18.71 is the next downside target. Closes above the 10-day moving average crossing at 20.02 would signal that a short-term low has been posted.
March cotton closed higher on Friday. The high-range close sets the stage for a steady to higher opening on Monday. Stochastics and the RSI are turning neutral to bullish signaling that sideways to higher prices are possible near-term. If March resumes the rally off October's low, the 50% retracement level of the August-October decline crossing at 93.31 is the next upside target. If March extends Wednesday's decline, December's low crossing at 78.80 is the next downside target.
Thanks tallpine!
Beans had a strong move up today.
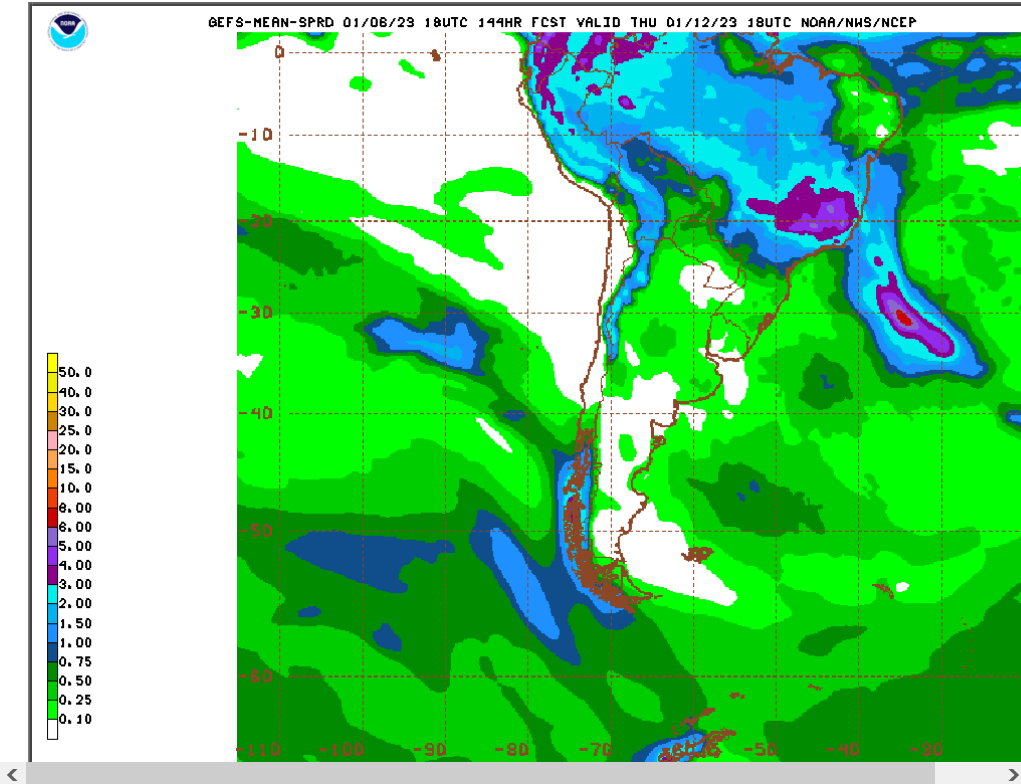
This is the just out 18z GEFS for South America rain totals
1. The next 6 days-almost nothing
2. The next 15 days-rains pick up alot, especially northern areas. Potential pattern change from rapidly dying La Nina?
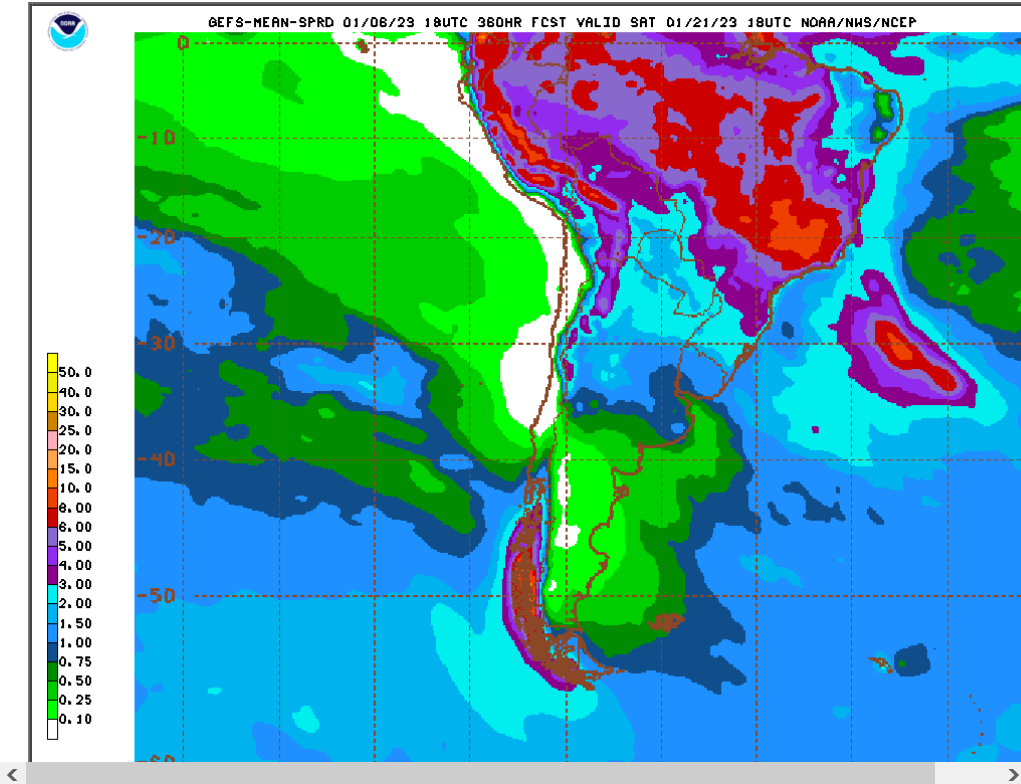
This is what a rapidly dying La Nina pattern looks like in the US:
https://www.marketforum.com/forum/topic/83844/#83852
Extended weather.
https://www.cpc.ncep.noaa.gov/products/predictions/610day/ | |||||||||
| 6 to 10 day outlooks | |||||||||
| Click below for information about how to read 6-10 day outlook maps Temperature Precipitation | |||||||||
| Click below for archives of past outlooks (data & graphics), historical analogs to todays forecast, and other formats of the 6-10 day outlooks ArchivesAnalogsLines-Only FormatGIS Data | |||||||||
Temperature Probability | |||||||||
Precipitation Probability | |||||||||
All this rain/snow is obliterating drought in many places!
https://www.cpc.ncep.noaa.gov/products/Soilmst_Monitoring/US/Soilmst/Soilmst.shtml#
![]()

