ENSO: Recent Evolution,
Current Status and Predictions
Summary
ENSO Alert System Status: La Niña Advisory
La Niña is present.*
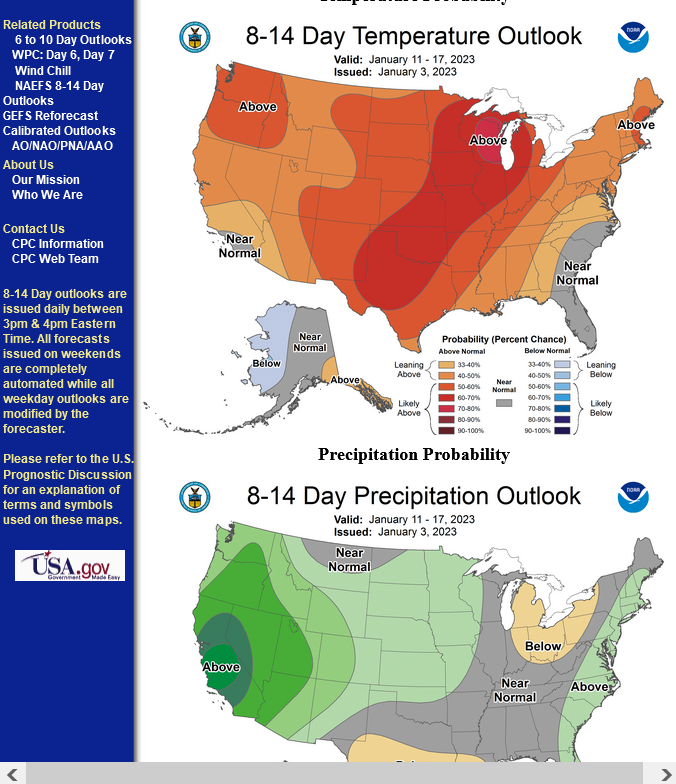
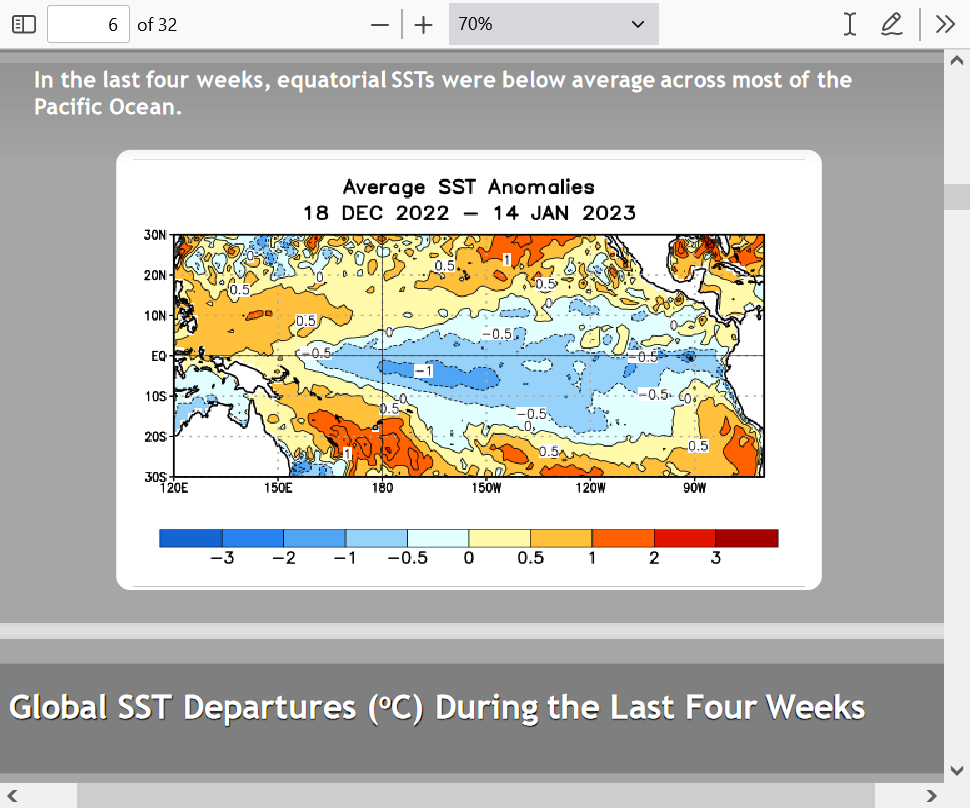
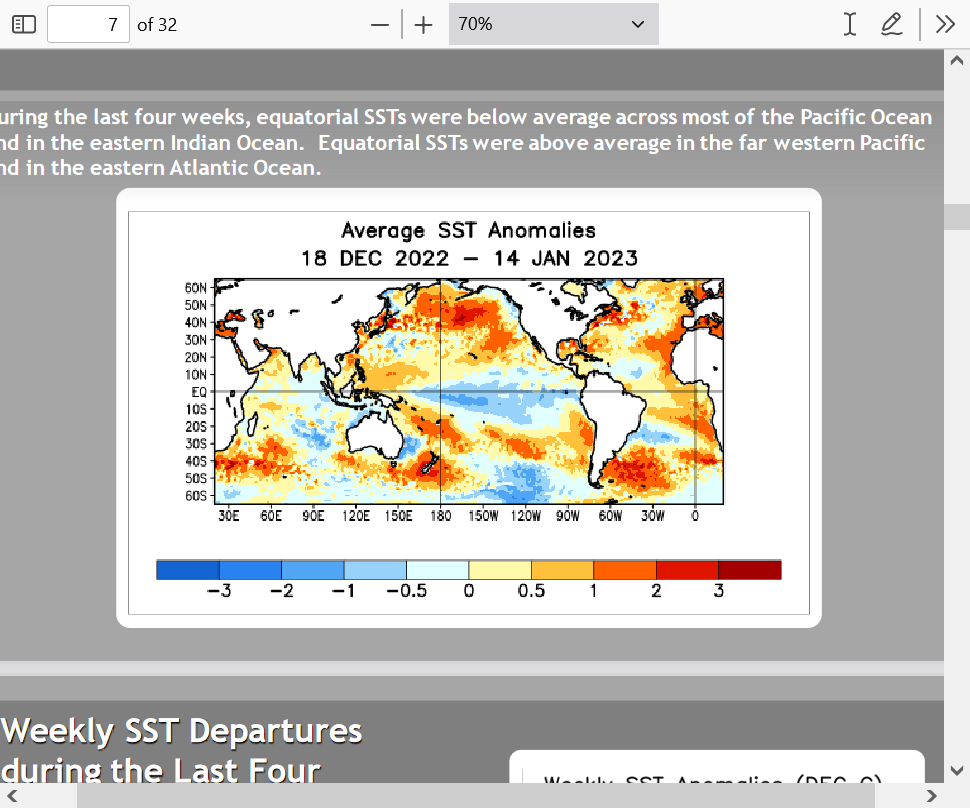
Equatorial sea surface temperatures (SSTs) are below average across most of
the Pacific Ocean.
The tropical Pacific atmosphere is consistent with La Niña.
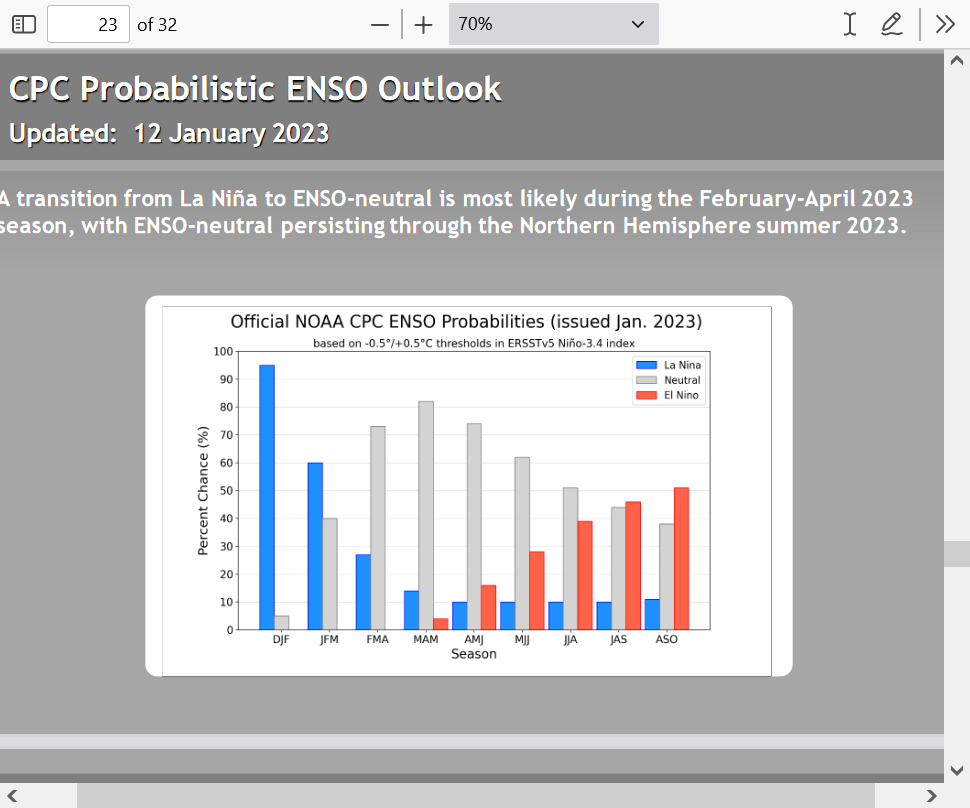
A transition from La Niña to ENSO-neutral is anticipated during the February-
April 2023 season. By Northern Hemisphere spring (March-May 2023), the
chance for ENSO-neutral is 82%.*
https://www.marketforum.com/forum/topic/91972/#92324
I contend that the atmosphere has already announced the start of an El Nino pattern.
The atmosphere has been acting like an El Nino for the last few weeks. I don't care what NOAA says about ENSO and that we still have an OFFICIAL La Nina in place by their standards.
We use La Nina and El Nino to predict the WEATHER but in this case, I'm telling you the weather is already telling us about the El Nino. I'll start a new thread on that shortly.
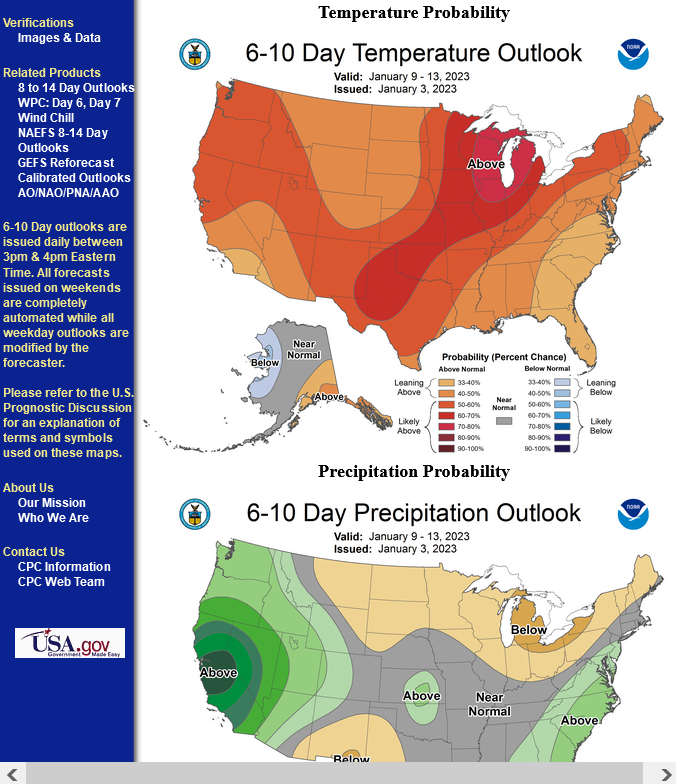
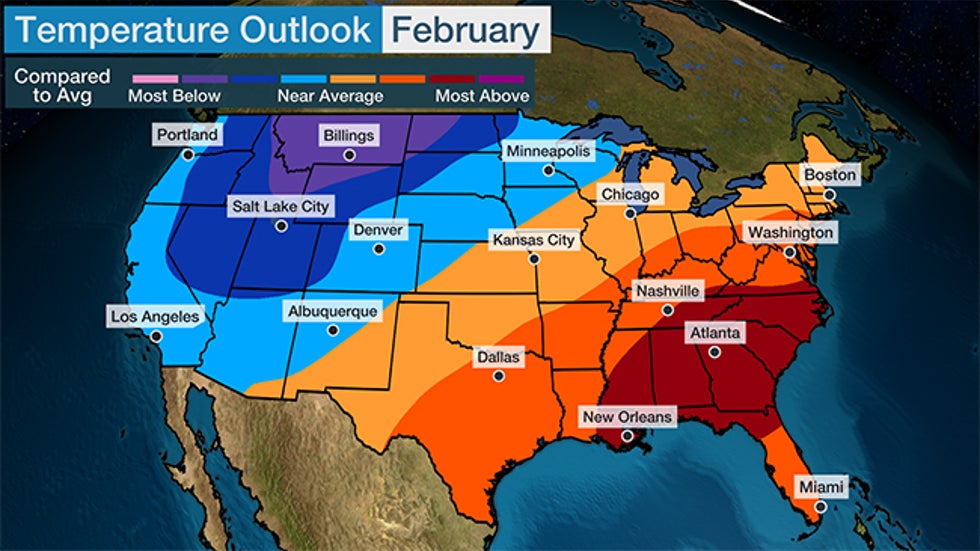
The reason that this is important is that the energized Pacific jet stream from the El Nino reacting atmosphere will increase the flow from the Pacific across the US and make it much harder for the northern stream's attempts to push cold air down from Canada. El Nino months in the Winter often feature mild, oceanic air crossing the country from west to east.
And in fact, towards the end of 2 weeks, instead of the cold shifting east, a ridge builds in the Southeast as the PNA drops again. This is NOT favorable for cold air to penetrate deeply into the high population centers in the East early in February or longer term. February is looking potentially very mild.
https://www.marketforum.com/forum/topic/91060/#91893
By metmike - Jan. 3, 2023, 6:48 p.m.
This weather pattern is suggesting to us that the current La Nina is rapidly coming to an end.
The atmosphere is taking on the El Nino signature big time!
Regardless of what the models or Pacific ocean temp profiles indicate, the atmosphere is acting just like it does when we have El Nino in the Pacific.
I've not seen this configuration for several Winters.
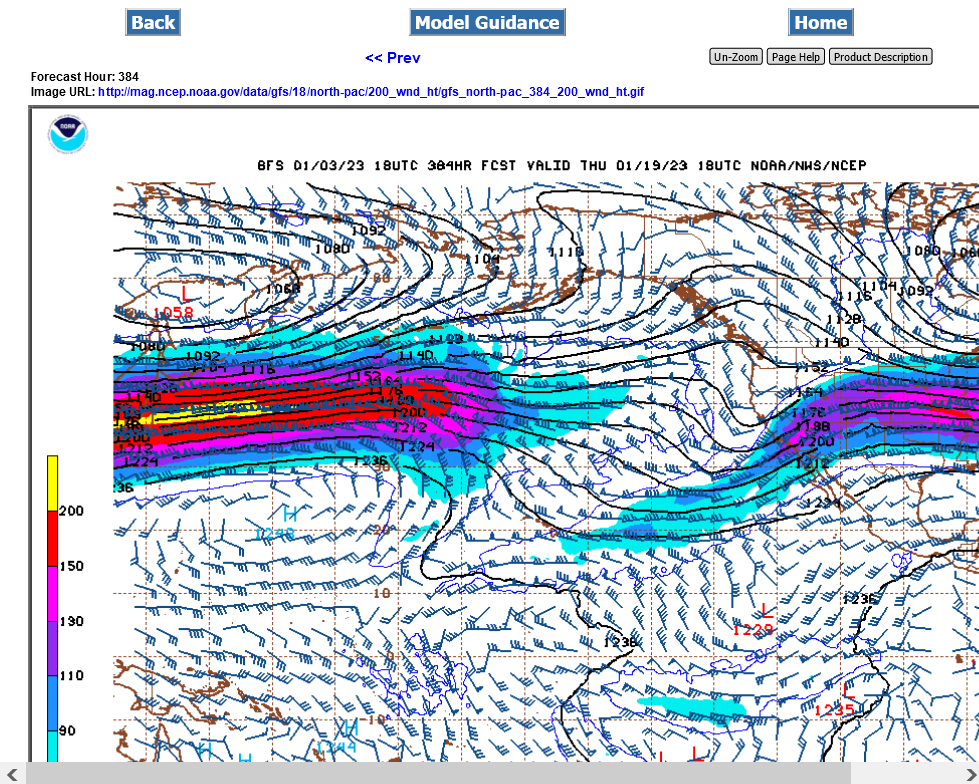
Look at that jet stream roaring across the Pacific. The yellow is a 200+ knot jet streak which is 240+ MPH!
You rarely see that and it's usually during El Nino's in the Pacific. It's aimed at the US, which will flood the entire US with mild, oceanic air and bombard the entire West Coast with heavy precip all the way to S.California which is typical of El Nino NOT La Nina.
To me, this signals the demise of the long lived La Nina!!
This should also bring a chance for drought relief in Argentina!
Ding, Dong the La Nina is (almost)dead, which La Nina, the 3 year old La Nina!
This will likely also mark the end of the multi year pause in the mostly beneficial global warming.
2022 was the 7th warmest year.
https://www.marketforum.com/forum/topic/91894/
I predict that 2023 will be warmer with high confidence and there will likely be less drought in the US because of it.
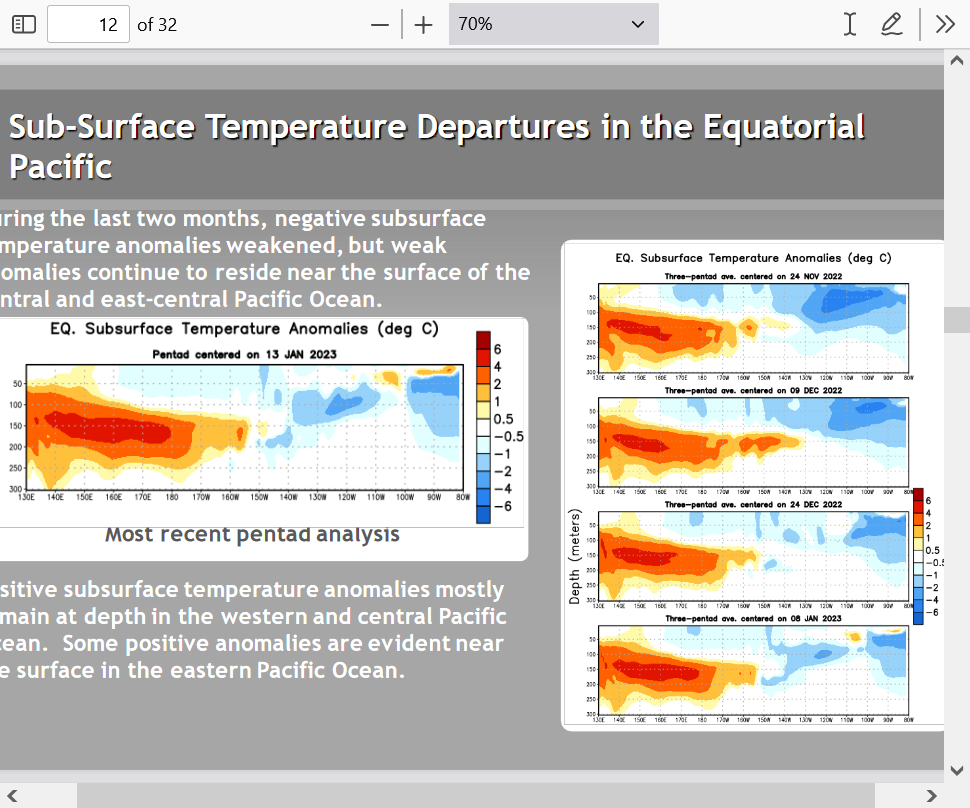
Let's look at the NOAA's ENSO maps.
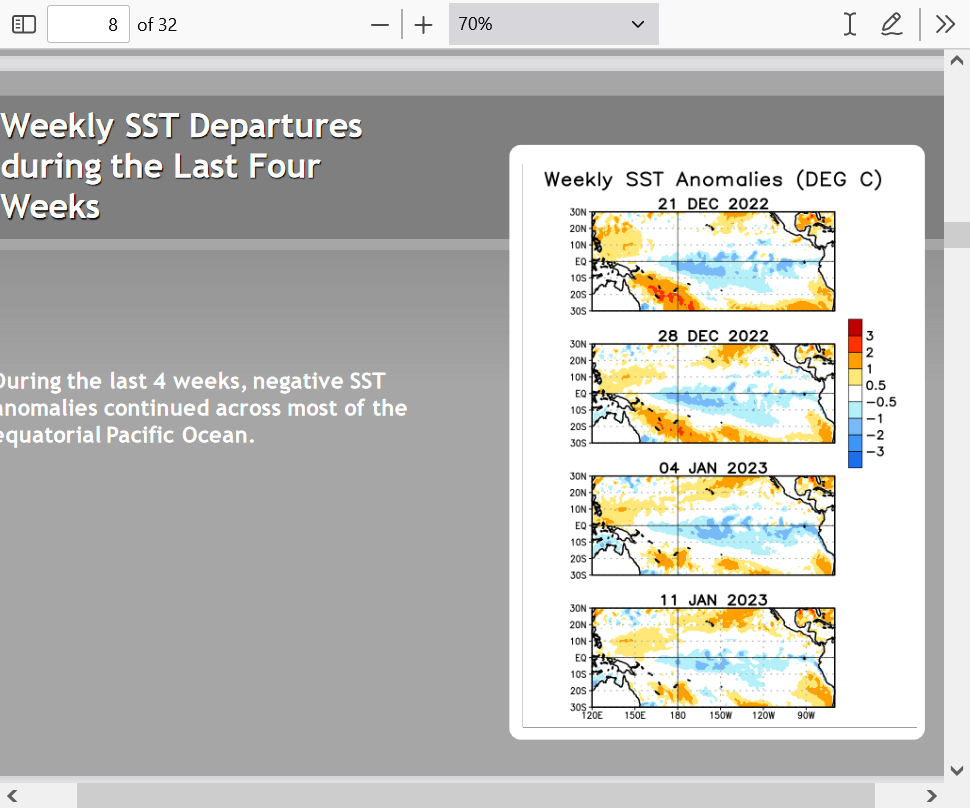
Still some lingering cold water anomalies in the tropical Pacific.
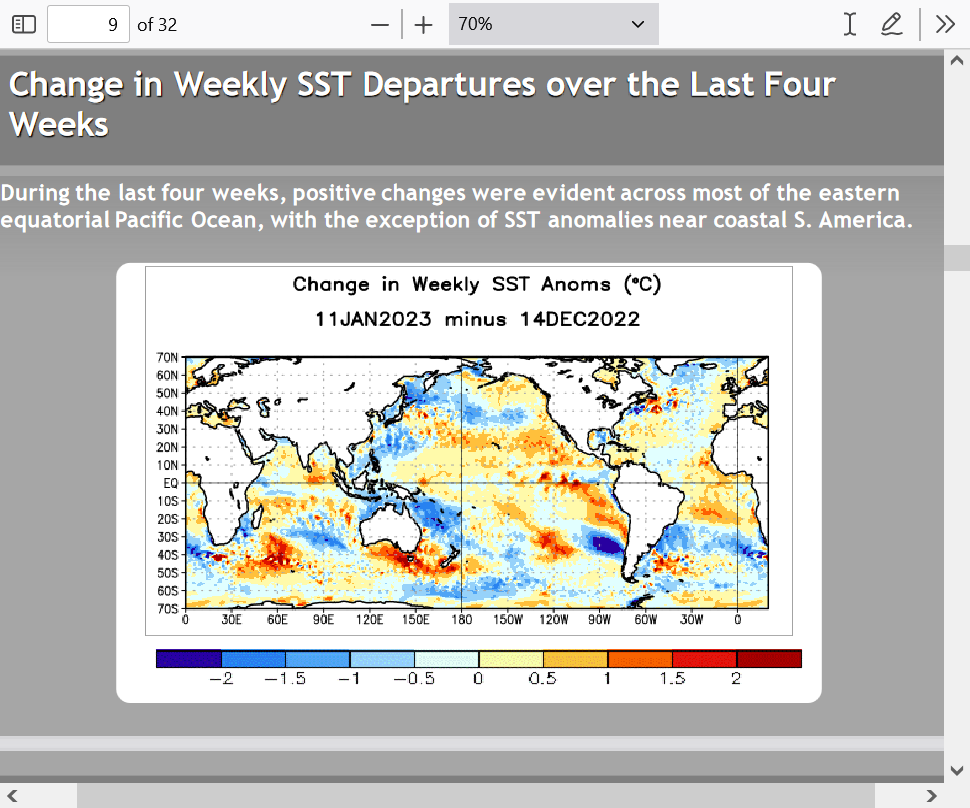
But look at the huge warming(cold rapidly eroding) that has been taking place in that area:
The huge warming added up below with the total change the last month is extremely significant.
The upper ocean temperature anomolies are almost back to average.
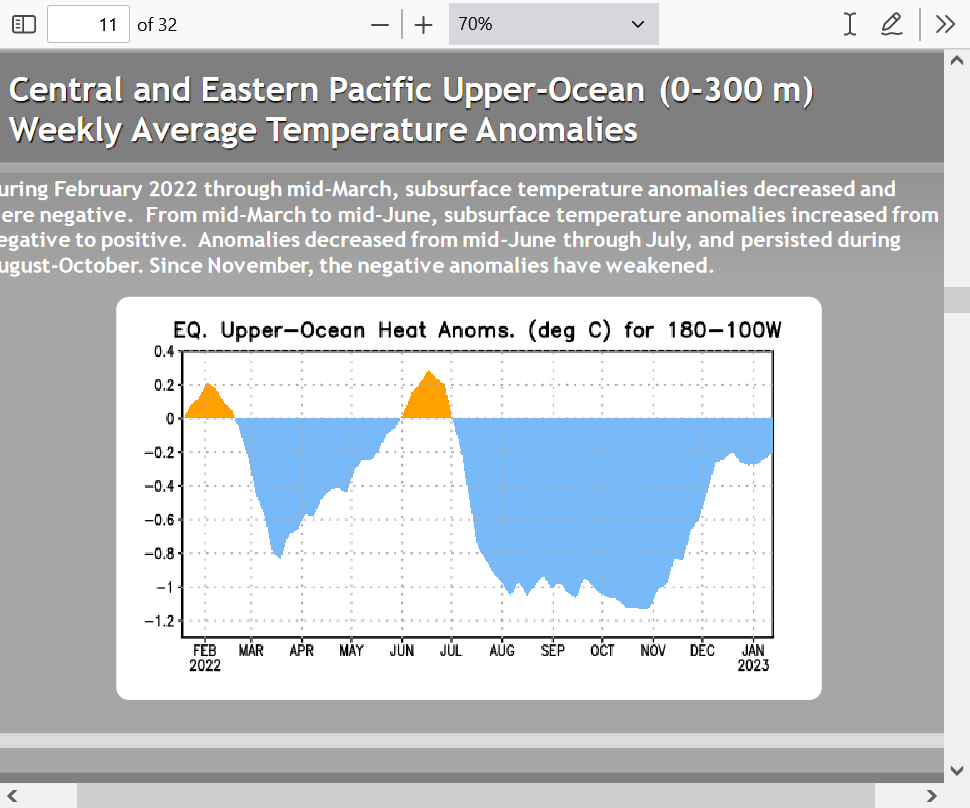
Sub-Surface cold departures have been rapidly eroding below.
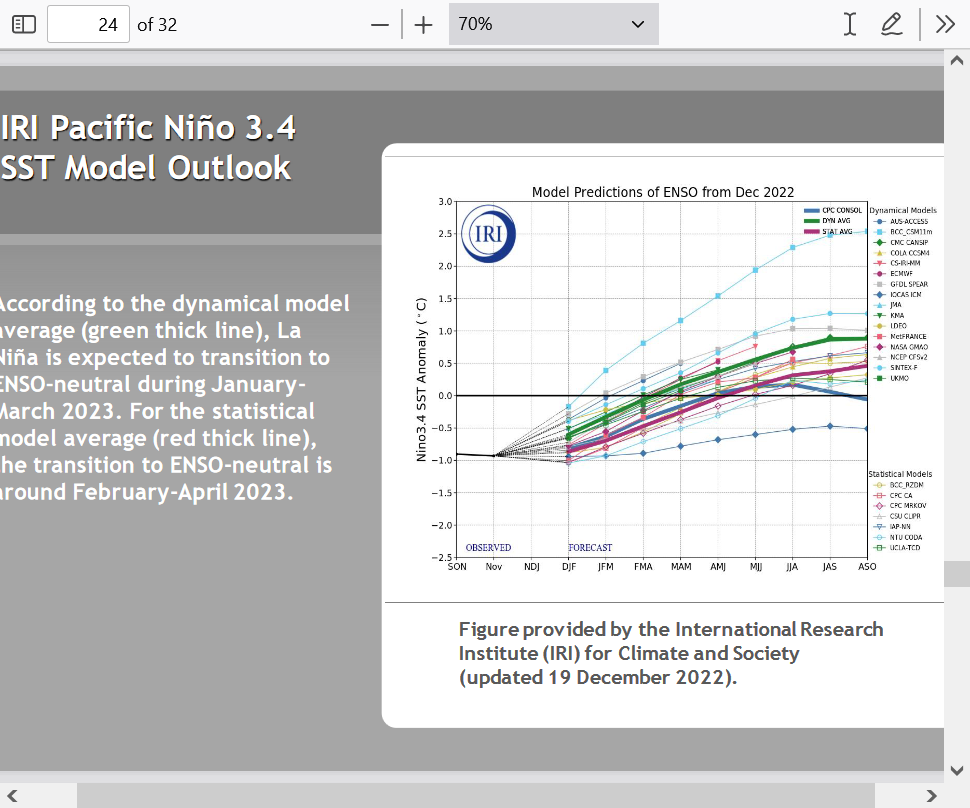
Models below gradually move up into ENSO nuetral.
However, they are based on 3 month averages. This means that when we hit an El Nino or La Nina, the conditions for it started at least a couple months earlier.
In other words, when the current month ends, they still average conditions from the PREVIOUS 2 months into that indicator.
So it's a LAGGING indicator!
When an OFFICIAL El NINO is declared or in this case an OFFICAL La Nina being over comes out as news............it will be months AFTER it happened in the real world.
The current atmosphere is telling us the La Nina is already dead.
We use La Nina's and El Nino's to predict their affects on the atmosphere/the weather.
However, there's more to it than just an absolute La Nina or El Nino.
The atmosphere is connected to CHANGES in ENSO.
The rapidly dying La Nina response in the atmosphere is the same one as a full blown El Nina because of the what happens between the water and winds/atmosphere.
The wind shifts that contribute to the La Nina dying are the same ones that we have during El Nino. Winds in Pacific define the weather pattern downstream.
I noted this 3 weeks ago:
https://www.marketforum.com/forum/topic/92327/#92328
Hey Mike,
I've recently been analyzing past La Niña winters with a major sudden stratospheric warning (SSW) in late January or Feb because models have been predicting for at least a week a strong SSW within that timeframe. Whether it would be classified as a "major" strong SSW or a "minor" strong SSW would depend on whether or not 10 mb winds at 60N+ would reverse from net westerly to net easterly. That is very difficult to ascertain from what I've been reading from pro mets like Judah Cohen who know this strat stuff very well.
Regardless of whether it ends up as a major, the effect from it looks to be similar based on the degree of warming. The GFS/GEFS has been predicting a warming at the North Pole of 40C+/72F+ within a mere 5 days 1/23-28 along with further warming into the start of Feb!
I've determined based on an analysis of past major SSWs around this timeframe that there tends to be a -AO dominating Feb/March during these winters. Based on this after the expected mild start to Feb, I'm predicting that a cold dominated period for the E US will start near mid Feb and likely persist into early to mid March. More in the next post.
Since 1958, there have been 13 winters with a major SSW in the late Jan to early Feb timeframe (5 during La Niña):
1958, 1960, 1963, 1971, 1973, 1981, 1987, 2001, 2003, 2006, 2009, 2010, 2018
They tended to be cold in the SE during multi week long periods within the Feb-March period. I checked the average of three of the indices in Feb/March to see if there was a notable difference between years with and without a late Jan to early Feb major SSW:
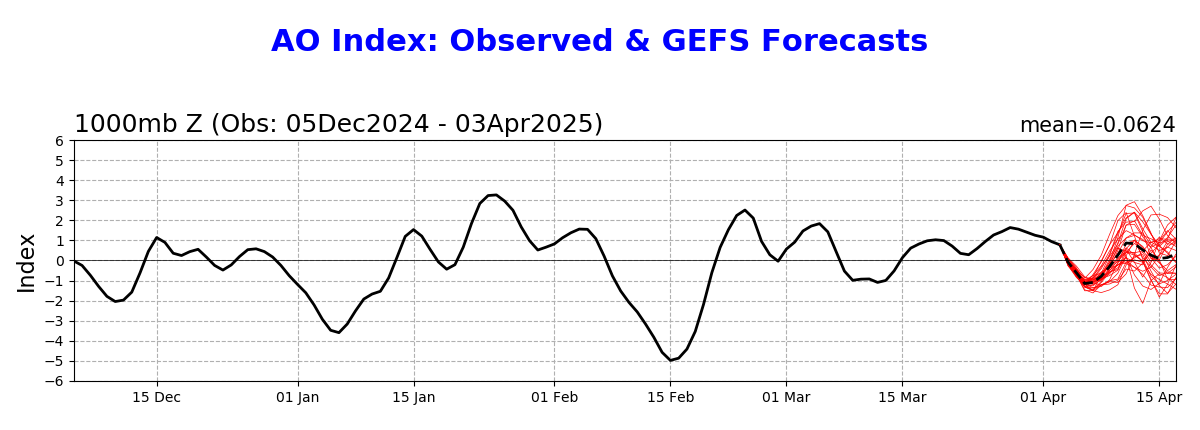
1. AO
- With SSW: -1.0; 7 were sub -0.9; only 2 of 13 were positive with highest +0.7
- Without SSW: -0.1
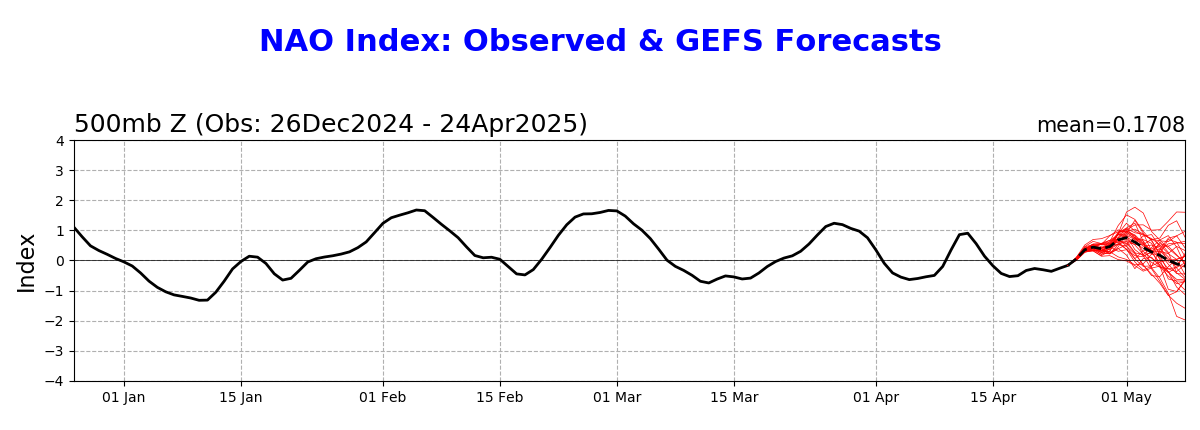
2. NAO
- With SSW: -0.4
- Without SSW: +0.2
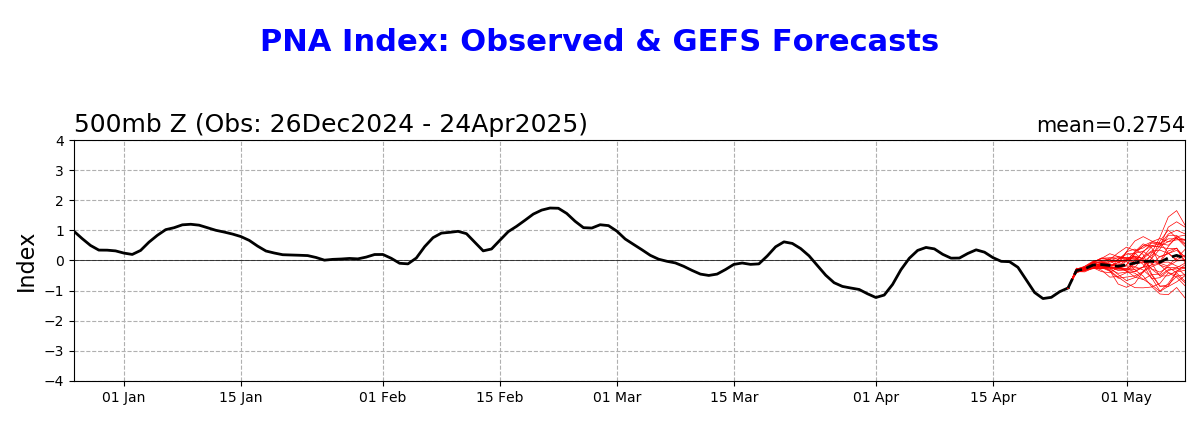
3. PNA
- With SSW: +0.2
-Without SSW: 0.0
Conclusions: Years with a late Jan or early Feb major SSW tended to have a -AO/-NAO when averaged through Feb/Mar whereas other years averaged neutral. The PNA averaged neutral for both with and without one. Thus, it appears that the -AO/-NAO combo tendency is a major driving force in tending to make a good portion of Feb/Mar chilly in the SE soon after a major SSW. So, as we get into Feb, I'll be looking at the AO/NAO forecasts with extra interest.
More in the next post about just the 5 La Niña winters with major SSWs late Jan to early Feb and the AO.
The 5 La Niña winters with a major SSW within late Jan to early Feb
All 5 had multi week cold dominated periods in the southeast US 10+ days later within Feb/Mar due largely to a -AO/-NAO:
1971 (cold first half of Feb), 2001 (cold March), 2006 (cold Feb), 2009 (cold 2nd half of Feb to early March), and 2018 (cold March)
AO on day of and immediately following the major SSW was neutral to positive before turning predominantly negative:
1) 1/18/1971: day of SSW +0.3; + to neutral for 10 days (peak of +1.5); then - on 34 of next 41 days with low of -2.8
2) 2/11/2001: day of SSW +1.5; + for 10 days (peak of +2.9!); then - on 29 of next 35 days with low of -4.9!
3) 1/21/2006: day of SSW -0.2; neutral for 3 days (peak of +0.5); then - on 13 of next 15 days with low of -2.7
4) 1/24/2009: day of SSW +1.1; + to neutral for 7 days (peak +1.9); then - on 14 of next 16 days with low of -3.2
5) 2/12/2018: day of SSW +1.7; + to neutral 12 of next 13 days (peak of +1.9); then - on next 22 days with low of -4.4!
-----------------------------
Based on the above, I'm educatedly guessing the following after the upcoming (major?) SSW:
- 1-2 weeks dominated by neutral to +AO with a good chance for it peaking at +1+. The La Niña favored SE ridge would likely be in control. I expect some cries of "winter cancel" over the next 1-2 weeks in the E US as this likely mild early Feb period gets closer. Don't let this initial 1-2 week mild dominated period in early Feb fool you into thinking winter is over in the SE/E US!
- 3-6 weeks dominated by -AO starting by mid Feb with lowest dipping to -2.5 or lower
- In the SE (and possibly in much of the rest of the E US), mild dominating early Feb. Cold domination starts ~mid-Feb and continues through the last half of Feb and probably into at least early March. Could extend through mid March.
Extremely wonderful posts/thoughts Larry!
To help others not familiar with Sudden Stratospheric Warming events:
https://en.wikipedia.org/wiki/Sudden_stratospheric_warming
https://news.mit.edu/2021/how-sudden-stratospheric-warming-affected-northern-hemisphere-0722
+++++++++++++
https://cliffmass.blogspot.com/2021/01/the-stratosphere-has-warmed-profoundly.html
https://www.aer.com/science-research/climate-weather/arctic-oscillation/

++++++++++++++++
weather.com meteorologists
Published: January 19, 2023
MetMike
Wonderful commentary by you and WX.
Gentlemen---For your Landlord and Owner/Operators, What is the GROWING SEASON IMPLICATIONS of a LaNina?
Should growing conditions favor a 'big/small' crop? Any planting delays? Corn or beans? Early/late harvest? Drought/perfect growing conditions? Sell now as prices have peaked?
TIA
"What is the GROWING SEASON IMPLICATIONS of a LaNina?"
Thanks tjc,
We had a La Nina the last couple of growing seasons. This will be the first one WITHOUT a La Nina(high confidence) in awhile.
La Nina's correlate strongly with drought in the US with some strong factors of causation.
El Nino's correlate with wetter weather in the US.
It looks very likely that we will be rapidly going from the La Nina to El Nino this year. It takes quite a while for the ocean temps to change enough(water has 1,000 times more heat capacity as air) over an averaged 3 month period for NOAA to declare an "official" El Nino.
But the atmosphere does not wait for NOAA to tell it how to behave nor does the ocean wait for that 3rd month of warmer ENSO readings to make it official using their lagging average metric.
During the 1st day of warmer readings in the real world......the atmosphere IMMEDIATELY RESPONDS.
The atmosphere appears to have already been telling us.
ENSO is supposed to be used to help predict the seasonal weather but one needs to also dial in that ENSO indicators have a massive lag.
Let's provide an example below.
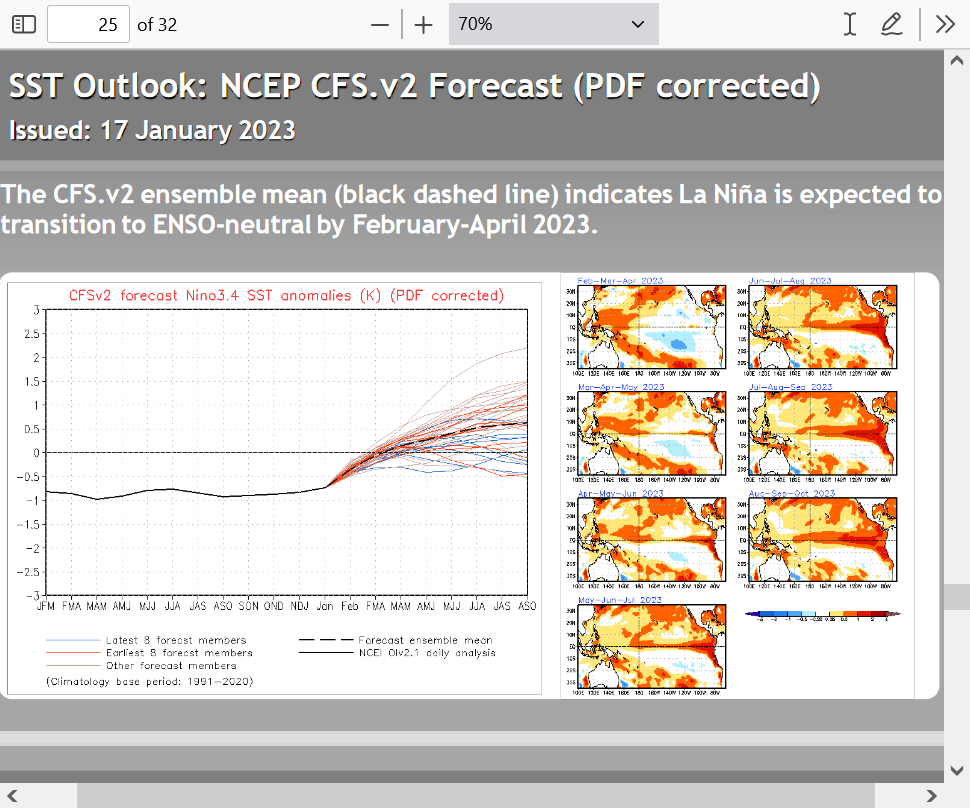
Look how quickly we go from La Nina to El Nino on this model below...........but not nearly quickly as the real world.
1. The bar graph, first shows the El Nino bar highest in JAS. That 3 month average is over at the end of September, which is when NOAA might claim "we have an El Nino" when El Nino conditions, with certainty existed for months in order to make it 3 MONTHS of El Nino.
2. This is extremely important. It not just absolute water temps in the ocean that matter. The ocean and atmosphere are very closely linked. WELL BEFORE we have El Nino in the water, the winds in the atmosphere will have already shifted..........which is happening now.
+++++++++++++++++++++++++

So the atmosphere is in an early El Nino response mode. Not maybe but IS. We just watched it and the storms bombarding the West Coast were a consequence.
https://www.marketforum.com/forum/topic/92327/#92328
The long lived droughts in the US were from the La Nina. But the new kid is in town and increases chances for wetter weather for the next couple of years, including the excessive rains that always come from that.
That could include planting delays and damage to crops from the atmosphere being able to hold 7% more moisture.
However, the past 3 decades of growing season records in the US have been the best for crops since humans have accurately documented weather. Add in the massively beneficial CO2 that's providing free atmospheric fertilizer and this year looks optimistic for robust production.
Fact is that this is not in spite of climate change but its exactly being CAUSED BY climate change in this current climate optimum for life on earth.
I misphrased my question, but I believe I have formed an answer based upon EL NINO factors.
One CAN expect more beneficial rain.
Whether rain is "too" bountiful in spring to delay planting or in fall to delay harvest is to be determined. But drought, except in isolated locations, is ruled out. Moreover, rain in USA is not the only determinative of supply. South American supply has already been negatively affected.
I believe a grain selloff is underway, but a test of last year highs may take place due to excessive rain prior/in planting season (most bullish corn). Hedgers will have a better chance later!
That's what I figured about your question tjc.
Good thoughts about the future.
Longest -AO streaks back to 1950 along with RDU temperature anomaly
12/25/1959-4/4/1960: 102 days/ 5 BN
2/2-4/11/1958: 69 days/ 6 BN
2/5-4/9/2013: 64 days/ 4 BN
12/23/1962-2/23/1963: 63 days/ 6 BN
11/23/2022-1/23/2023: 62 days/ 3 AN
The very recent -AO streak apparently ended yesterday at 63 days. What's very notable is how much warmer it has been in the SE US vs during other very long -AO streaks with an anomaly of +3 at RDU vs the other four having had anomalies of a very cold -4 to -6! And on top of that, I'm using updated 30 year normals in the calculations, meaning a warmer normal for the current streak.
RDU is Raleigh-Durham, NC, as a representative station for the SE US/E US
Wow, Larry I had no idea the long lived -AO was in lofty historical territory like this:
https://www.cpc.ncep.noaa.gov/products/precip/CWlink/daily_ao_index/ao.shtml
Yes, amazingly warm for such a regime since a -AO is favorable for cold air to be flushed south from high latitudes to the mid latitudes.
I'm betting that the other, much colder periods in the past that featured the long lived -AO also had a -NAO.
The NAO has been around 0 to strongly positive for much of the past month.
https://www.cpc.ncep.noaa.gov/products/precip/CWlink/pna/nao.shtml
The PNA has moved up and down quite a bit:
https://www.cpc.ncep.noaa.gov/products/precip/CWlink/pna/pna.shtml
1) The current SSW ended up as "minor"
2) There may be a new kid in town. Models have become increasingly emphatic about a new warming during the middle of this month. Stay tuned!