KEY EVENTS TO WATCH FOR:
Monday, January 23, 2023
10:00 AM ET. December Leading Indicators
Leading Index, M/M% (previous -1.0%)
Leading Index
Coincident Index, M/M% (previous +0.1%)
Lagging Index, M/M% (previous +0.2%)
The STOCK INDEXES? http://quotes.ino.com/ex?changes/?c=indexes
The Dow closed higher on Friday and filled Thursday's gap crossing at 33,269.90 as it consolidated the decline off January's high. The high-range close sets the stage for a steady to lower opening when Monday's day session begins trading. Stochastics and the RSI remain neutral to bearish signaling that sideways to lower prices are possible near-term. If the Dow extends this week's decline, the December 22nd low crossing at 32,573.43 is the next downside target. If the Dow renews the rally off December's low, December's high crossing at 34,712.28 is the next upside target. First resistance is the 10-day moving average crossing at 33,880.85. Second resistance is last-Friday's high crossing at 34,342.32. Second resistance is December's high crossing at 34,712.28. First support is the January 5th low crossing at 32,812.33. Second support is the December 22nd low crossing at 32,573.43.
The March NASDAQ 100 closed sharply higher on Friday ending a two-day correction off Wednesday's high. The high-range close sets the stage for a steady to higher opening when Monday's day session begins trading. Stochastics and the RSI are turning neutral to bullish signaling sideways to higher prices are possible. If March renews the rally off January's low, the 38% retracement level of the August-October decline crossing at 11,839.97 is the next upside target. Closes below the 20-day moving average crossing at 11,213.30 would signal that a short-term top has been posted. First resistance is the 38% retracement level of the August-October decline crossing at 11,839.97. Second resistance is the 50% retracement level of the August-October decline crossing at 12,237.16. First support is the 20-day moving average crossing at 11,213.30. Second support is January's low crossing at 10,751.00.
The March S&P 500 closed higher on Friday as it consolidated some of this week's decline. The high-range close sets the stage for a steady to higher opening when Monday's day session begins trading. Stochastics and the RSI are neutral to bearish signaling that sideways to lower prices are possible near-term. Closes below the 20-day moving average crossing at 3910.07 would signal that a short-term top has been posted. If March resumes the rally off December's low, the 62% retracement level of the August-October decline crossing at 4045.36 is the next upside target. First resistance isthe 62% retracement level of the August-October decline crossing at 4045.36. Second resistance is December's high crossing at 4180.00. First support is the 20-day moving average crossing at 3910.07. Second support is the December 22nd low crossing at 3788.50.
INTEREST RATES? http://quotes.ino.com/ex?changes/?c=interest ""
March T-bonds closed down 1-06-pts. at 130-18.
March T-bonds closed lower on Friday as it consolidated some of the rally off December's low. The low-range close sets the stage for a steady to lower opening when Monday's day session begins trading. Stochastics and the RSI are overbought but remain neutral to bullish signaling that sideways to higher prices are possible near-term. If March extends the rally off December's low, the 62% retracement level of the August-October decline crossing at 133-30 is the next upside target. Closes below the 20-day moving average crossing at 128-11 would signal that a short-term top has been posted. First resistance is Thursday's high crossing at 132-31. Second resistance is the 62% retracement level of the August-October-2022 decline crossing at 133-30. First support is the 20-day moving average crossing at 128-11. Second support is the 50-day moving average crossing at 127-26.
March T-notes closed down 195-pts. at 115.020.
March T-notes closed lower on Friday as it consolidated some of the rally off October's low. The low-range close sets the stage for a steady to slightly lower opening when Monday's day session begins trading. Stochastics and the RSI are overbought but remain neutral to bullish signaling that sideways to higher prices are possible near-term. If December extends the aforementioned rally, the 62% retracement level of the August-October-2022 decline crossing at 116.235 is the next upside target. Closes below the 20-day moving average crossing at 113.270 would signal that a short-term top has been posted. First resistance is Thursday's high crossing at 116.080. Second resistance is the 62% retracement level of the August-October-2022 decline crossing at 116.235. First support is the 20-day moving average crossing at 113.270. Second support is the 50-day moving average crossing at 113.200.
ENERGY MARKETS? http://quotes.ino.com/ex?changes/?c=energy ""
February crude oil closed higher on Friday as it extends the rally off January's low. The high-range close sets the stage for a steady to higher opening when Wednesday's day session begins. Stochastics and the RSI are diverging but remain neutral to bullish signaling that sideways to higher prices are possible near-term. If February extends the aforementioned rally, December's high crossing at $83.27 is the next upside target. Closes below the 20-day moving average crossing at $77.82 would signal that a short-term top has been posted. First resistance is Wednesday's high crossing at $82.38. Second resistance is December's high crossing at $83.27. First support is the 20-day moving average crossing at $77.82. Second support is the January 5thlow crossing at $72.46.
February heating oil closed higher on Friday as it extends the rally off the January 5th low. The high-range close sets the stage for a steady to higher opening when Monday's day trading session begins. Stochastics and the RSI are overbought but remain neutral to bullish signaling that sideways to higher prices are possible near-term. If February extends the rally off the January 5th low, November's high crossing at $3.5862 is the next upside target. Closes below the 50-day moving average crossing at $3.1741 would temper the near-term friendly outlook. First resistance is today's high crossing at $3.4828. Second resistance is November's high crossing at $3.5862. First support is the 50-day moving average crossing at $3.1741. Second support is the January 5th low crossing at $2.9200.
February unleaded gas closed higher on Friday as it extended the rally off last-Friday's low. The high-range close sets the stage for a steady to higher opening when Monday's day session begins trading. Stochastics and the RSI are overbought but remain neutral to bullish signaling that sideways to higher prices are possible near-term. If February extends the rally off December's low, the 75% retracement level of 2022's decline crossing at $2.8129 is the next upside target. Closes below the 20-day moving average crossing at 2.4006 would signal that a short-term top has been posted. First resistance is November's high crossing at 2.6682. Second resistance is the 75% retracement level of 2022's decline crossing at $2.8129. First support is the 10-day moving average crossing at 2.4614. Second support is the 20-day moving average crossing at $2.4006.
February Henry natural gas closed lower on Friday as it extends the decline off November's high. The low-range close sets the stage for a steady to lower opening when Monday's day session begins trading. Stochastics and the RSI are oversold but remain neutral to bearish signaling that sideways to lower prices are possible near-term. If February extends the decline off November's high, the March-2020 low crossing at 2.598 is the next downside target. Closes above the 20-day moving average crossing at 4.059 would signal that a short-term low has been posted. First resistance is the 20-day moving average crossing at 4.059. Second resistance is the December 27th high crossing at 5.245. First support is today's low crossing at 3.092. Second support is the March-2020 low crossing at 2.598.
CURRENCIES? http://quotes.ino.com/ex?changes/?c=currencies ""
The March Dollar closed slightly lower on Friday as it consolidates above support marked by the 75% retracement level of the January-September rally crossing at $101.331. The low-range close sets the stage for a steady to lower opening when Monday's session begins trading. Stochastics and the RSI are oversold but remain neutral to bearish signaling that sideways to lower prices are possible near-term. If March extends the decline off September's high, the 87% retracement level of the January-September rally crossing at $99.229 is the next downside target. Closes above the 20-day moving average crossing at $103.113 would signal that a short-term low has been posted. First resistance is the 20-day moving average crossing at $103.113. Second resistance is the 50-day moving average crossing at $104.391. First support is the 75% retracement level of the January-September rally crossing at $101.331. Second support is the 87% retracement level of the January-September rally crossing at $99.229.
The March Euro closed higher on Friday as it extends the trading range of the past five-days. The high-range close sets the stage for a steady to higher opening when Monday's day session begins trading. Stochastics and the RSI are overbought but remain neutral to bullish signaling that sideways to higher prices are possible near-term. If March resumes the rally off September's low, the March 31st high crossing at $1.09680 is the next upside target. Closes below the 20-day moving average crossing at 1.07507 would signal that a short-term top has been posted. First resistance is Wednesday's high crossing at $1.09275. Second resistance is the March 31st high crossing at $1.09680. First support is the 20-day moving average crossing at 1.07507. Second support is the 50-day moving average crossing at $1.06055.
The March British Pound closed slightly higher on Friday as it extends the rally off January's low. The high-range close sets the stage for a steady to higher opening when Monday's day session begins trading. Stochastics and the RSI are overbought but remain neutral to bullish signaling sideways to higher prices are possible near-term. If March extends the rally off January's low, December's high crossing at 1.2229 is the next upside target. Closes below the 50-day moving average crossing at 1.2103 would signal that a short-term top has been posted while opening the door for a possible test of the January 6th low crossing at 1.1867. First resistance is Wednesday's high crossing at 1.2452. Second resistance is December's high crossing at 1.2479. First support is the 50-day moving average crossing at 1.2103. Second support is the January 6th low crossing at 1.1861.
The March Swiss Franc closed lower on Friday as it consolidated some of the rally off last-Wednesday's low. The low-range close sets the stage for a steady to lower opening when Monday's day session begins trading. Stochastics and the RSI are diverging and are turning neutral to bearish signaling that sideways to lower prices are possible near-term. Closes below the 50-day moving average crossing at 1.07818 would signal that a short-term top has been posted. If March extends the rally off September's low, the 75% retracement level of the 2018-2022 decline crossing at 1.10351 is the next upside target. First resistance is the 62% retracement level of the 2018-2022 decline crossing at 1.10351. Second resistance is the 75% retracement level of the 2018-2022 decline crossing at 1.10351. First support is the 50-day moving average crossing at 1.07818. Second support is the January 6th low crossing at 1.06915.
The March Canadian Dollar closed higher on Friday. The high-range close sets the stage for a steady to higher opening when Monday's day session begins trading. Stochastics and the RSI are turning neutral to bullish signaling that sideways to higher prices are possible near-term. If March renews this month's rally, November's high crossing at 75.71 is the next upside target. Closes below the 20-day moving average crossing at 74.15 would signal that a short-term top has been posted. First resistance is the November 25thhigh crossing at 75.16. Second resistance is November's high crossing at 75.71. First support is the 20-day moving average crossing at 74.15. Second support is the December 16th low crossing at 73.04.
The March Japanese Yen closed lower on Friday. The mid-range close sets the stage for a steady to lower opening when Monday’s day session begins trading. Stochastics and the RSI are turning neutral to bearish signaling that sideways to lower prices are possible near-term. Closes below the 20-day moving average crossing at 0.076842 would signal that a short-term top has been posted while opening the door for additional weakness near-term. If March extends the rally off October's low, the May 24th -2021 high crossing at 0.080525 is the next upside target. First resistance is Tuesday's high crossing at 0.079190. Second resistance is the May 24th -2021 high crossing at 0.080525. First support is the 20-day moving average crossing at 0.076842. Second support is the January 6th low crossing at 0.074830.
PRECIOUS METALS? http://quotes.ino.com/ex?changes/?c=metals ""
February gold closed higher on Friday as it extends the rally off November's low. The mid-range close sets the stage for a steady to higher opening when Monday's day session begins trading. Stochastics and the RSI are overbought but remain neutral to bullish signaling that sideways to higher prices are possible near-term. If February extends the rally off November's low, the 75% retracement level of the March-October decline crossing at $1975.80 is the next upside target. Closes below the 20-day moving average crossing at $1862.80 would signal that a short-term top has been posted while opening the door for additional weakness near-term. First resistance is today's high crossing at $1939.00. Second resistance is the 75% retracement level of the March-October decline crossing at $1975.80. First support is the 10-day moving average crossing at $1899.40. Second support is the 20-day moving average crossing at $1862.80.
March silver closed higher on Friday as it extends the trading range of the past three-weeks. The high-range close sets the stage for a steady to higher opening when Monday's day session begins trading. Stochastics and the RSI are turning neutral to bullish signaling that sideways to higher prices are possible near-term. If March renews the rally off October's low, the 87% retracement level of the March-August decline crossing at 25.995 is the next upside target. If March renews the decline off the January 3rd high, the 50-day moving average crossing at 22.995 is the next downside target. First resistance is the 75% retracement level of the March-September decline crossing at 24.779. Second resistance is the 87% retracement level of the March-August decline crossing at 25.938. First support is the 50-day moving average crossing at 22.995. Second support is the December 16th low crossing at 22.735.
March copper closed higher on Friday as it posted a new high close for the year. The high-range close sets the stage for a steady to higher opening when Monday's day session begins trading. Stochastics and the RSI are overbought but remain neutral to bullish signaling that sideways to higher prices are possible near-term. If March extends the rally off September's low, the 75% retracement level of the March-July decline crossing at 4.4773 is the next upside target. Closes below the 20-day moving average crossing at 3.9787 would signal that a short-term top has been posted. First resistance is Wednesday's high crossing at 4.3550. Second resistance is the 75% retracement level of the March-July decline crossing at 4.4773. First support is the 10-day moving average crossing at 4.1552. Second support is the 20-day moving average crossing at 3.9788.
GRAINS? http://quotes.ino.com/ex?changes/?c=grains "
March Corn closed down $0.01-cents at $6.76 1/4.
March corn closed lower on Friday as it consolidated some of the rally off last-Tuesday's low. The high-range close sets the stage for a steady to higher opening when Monday's night session begins trading. Stochastics and the RSI are neutral to bearish signaling that sideways to lower prices are possible near-term. Closes below the 50-day moving average crossing at $6.62 would signal that a short-term top has been posted. If March extends this month's rally, the 75% retracement level of the October-December decline crossing at $6.92 1/2 is the next upside target. First resistance is Wednesday's high crossing at $6.88 3/4. Second resistance is the 75% retracement level of the October-December decline crossing at $6.92 1/2. First support is the 50-day moving average crossing at $6.62. Second support is January's low crossing at $6.48 1/4.
March wheat closed up $0.07-cents at $7.41 1/2.
March wheat closed higher on Friday as it extends the trading range of the past two-weeks. The high-range close sets the stage for a steady to higher opening when Monday's day session begins trading. Stochastics and the RSI are neutral to bearish signaling that sideways to lower prices are possible near-term. If March renews this month's decline, the September 6th 2021 low crossing at $6.93 1/2 is the next downside target. Closes above the 20-day moving average crossing at $7.55 1/2 would signal that a short-term low has been posted. First resistance is the 20-day moving average crossing at $7.55 1/2. Second resistance is the 50-day moving average crossing at $7.74 1/4. First support is last-Tuesday's low crossing at $7.20 1/2. Second support is the September 6th 2021 low crossing at $6.93 1/2.
March Kansas City Wheat closed up $0.16-cents at $8.48.
March Kansas City wheat closed higher on Friday ending a two-day correction off Wednesday's high. The high-range close sets the stage for a steady to higher opening when Monday's day session begins trading. Stochastics and the RSI are turning neutral to bearish signaling that sideways to lower prices are possible near-term. If March renews the decline off December's high, the January 10th 2022 low crossing at $7.68 3/4 is the next downside target. If March extends the rally off January's low, the 50-day moving average crossing at $8.74 1/2 is the next upside target. First resistance is the 50-day moving average crossing at $8.74 1/2. Second resistance is the December 27 high crossing at $8.94 3/4. First support is January's low crossing at $8.03 1/4. Second support is the January 10th 2022 low crossing at $7.68 3/4.
March Minneapolis wheat closed up $0.08 3/4-cents crossing at $9.12 3/4.
March Minneapolis wheat closed higher on Friday. The high-range close sets the stage for a steady to higher opening when Monday's day session begins trading. Stochastics and the RSI are neutral signaling that sideways trading is possible near-term. If March renews the decline off November's high, August's low crossing at $8.75 3/4 is the next downside target. Closes above the 50-day moving average crossing at $9.27 would signal that a short-term low has been posted. First resistance is the 50-day moving average crossing at $9.27. Second resistance is the January 30th high crossing at $9.40. First support is January's low crossing at $8.90. Second support is August's low crossing at $8.75 3/4.
SOYBEAN COMPLEX? http://quotes.ino.com/ex?changes/?c=grains "
March soybeans closed down $0.08 1/4-cents at $15.06 1/2.
March soybeans closed lower on Friday as it extended the decline off Wednesday's high. The low-range close sets the stage for a steady to lower opening when Monday's day trade begins. Stochastics and the RSI are bearish signaling that sideways to lower prices are possible near-term. Closes below the 20-day moving average crossing at $15.01 would signal that a short-term top has been posted while opening the door for additional weakness near-term. If March renews this month's rally. last-June's high crossing at $15.72 1/4 is the next upside target. First resistance is Wednesday's high crossing at $15.48 1/2. Second resistance is last-June's high crossing at $15.72 1/4. First support is the 20-day moving average crossing at $15.01. Second support is the 50-day moving average crossing at $14.75 1/4.
March soybean meal closed down $7.50 at $463.70.
March soybean meal closed lower on Friday and below the 20-day moving average crossing at $466.40 signals that a short-term top has been posted. The low-range close sets the stage for a steady to lower opening when Monday's day session begins trading. Stochastics and the RSI are bearish signaling that sideways to lower prices are possible near-term. If March extended this week's decline, the 25% retracement level of the 2021-2023-rally crossing at $446.10 is the next downside target. If March renews the rally off October's low, the August 29th high on the monthly continuation chart crossing at $488.40 is the next upside target. First resistance is Wednesday's high crossing at $487.00. Second resistance is the August 29th high on the monthly continuation chart crossing at $488.40 is the next upside target. First support is the January 5th low crossing at $457.20. Second support is the 25% retracement level of the 2021-2023 rally crossing at $446.10.
March soybean oil closed down 118-pts. At 61.97.
March soybean oil closed lower on Friday as it extends the trading range of the past three-weeks. The low-range close sets the stage for a steady to lower opening when Monday's day session begins trading. Stochastics and the RSI are neutral to bearish signaling that sideways to lower prices are possible near-term. If March renews the decline off the December 27th high, the December 16th low crossing at 61.47 is the next downside target. Closes above Wednesday's high crossing at 64.75 would signal that a short-term low has been posted. First resistance is Wednesday's high crossing at 64.75. Second resistance is the 50-day moving average crossing at 65.58. First support is the December 16th low crossing at 61.47. Second support is December's low crossing at 58.50.
LIVESTOCKhttp://quotes.ino.com/exchanges/?c=livestock
April hogs closed up $1.53 at $85.93.
April hogs closed higher on Friday as it consolidated some of the decline off December's high. The high-range close sets the stage for a steady to higher opening when Monday's day session begins trading. Stochastics and the RSI are oversold but remain bearish signaling that sideways to lower prices are possible near-term. If April extends the aforementioned decline, October's low crossing at $82.63 is the next downside target. Closes above the 10-day moving average crossing at $87.75 would signal that a short-term low has been posted. First resistance is the 10-day moving average crossing at $87.75. Second resistance is the January 17th high crossing at $89.08. First support is Thursday's low crossing at $84.08. Second support is October's low crossing at $82.63.
April cattle closed up $0.80 at $159.93.
April cattle posted an inside day with a higher close on Friday as it consolidated some of this week's decline. The high-range close sets the stage for a steady to higher opening on Monday. Stochastics and the RSI remain neutral to bearish signaling that sideways to lower prices are possible near-term. If April extends the decline off January's high, the 25% retracement level of the 2021-2022 rally crossing at $157.566 is the next downside target. Closes above the 20-day moving average crossing at $161.11 would signal that a short-term low has been posted. First resistance is the 20-day moving average crossing at $161.11. Second resistance is December's high crossing at $162.75. First support is the 25% retracement level of the 2021-2022 rally crossing at $157.566. Second support is the December 7th low crossing at $156.85.
March Feeder cattle closed up $0.83 at $180.93.
March Feeder cattle closed higher on Friday as it consolidated some of the decline off the January 4th high. The high-range close sets the stage for a steady to higher opening when Monday's day session begins trading. Stochastics and the RSI are oversold but remain neutral to bearish signaling that sideways to lower prices are possible near-term. If March extends the decline off January's high, the October 14th low crossing at $176.28 is the next downside target. Closes above the 50-day moving average crossing at $184.03 would signal that a short-term low has been posted. First resistance is the 50-day moving average crossing at $184.03. Second resistance is the 20-day moving average crossing at $184.91. First support is Thursday's low crossing at $179.18. Second support is the October 14th low crossing at $176.28.
FOOD & FIBERhttp://quotes.ino.com/ex changes/?c=food
March coffee closed slightly lower on Friday. The high-range close sets the stage for a steady to higher opening on Monday. Stochastics and the RSI are neutral to bullish signaling sideways to higher prices are possible near-term. Closes above the 50-day moving average crossing at $16.24 would signal that a short-term low has been posted. If March renews the decline off December's high, the 87% retracement level of the 2020-2022 rally crossing at $13.20 is the next downside target. First resistance is the 20-day moving average crossing at $16.02. Second resistance is the 50-day moving average crossing at $16.24. First support is the January 11th low crossing at $14.21. Second support is the 87% retracement level of the 2020-2022 rally crossing at $13.20.
March cocoa closed slightly lower on Friday but not before spiking below the 50-day moving average crossing at 25.43. The high-range close sets the stage for a steady to higher opening on Monday. Stochastics and the RSI remain neutral to bearish signaling that sideways to lower prices are possible near-term. If March extends this week's decline, the December 16th low crossing at 24.68 is the next downside target. Closes above the 10-day moving average crossing at 26.22 would signal that a short-term low has been posted.
March sugar closed slightly higher on Friday. The high-range close sets the stage for a steady to higher opening on Monday. Stochastics and the RSI remain neutral to bullish signaling that sideways to higher prices are possible near-term. If March extends the rally off January's low, November's high crossing at 20.48 is the next upside target. Closes below last-Thursday low crossing at 19.45 would signal that a short-term top has been posted.
March cotton closed sharply higher on Friday as it extends the November-January trading range. The high-range close sets the stage for a steady to higher opening on Monday. Stochastics and the RSI are neutral to bullish signaling that sideways to higher prices are possible near-term. If March resumes the rally off October's low, the 50% retracement level of the August-October decline crossing at 93.31 is the next upside target. If March extends the decline off last-Monday's high, the January 4th low crossing at 80.37 is the next downside target.
Thanks tallpine!
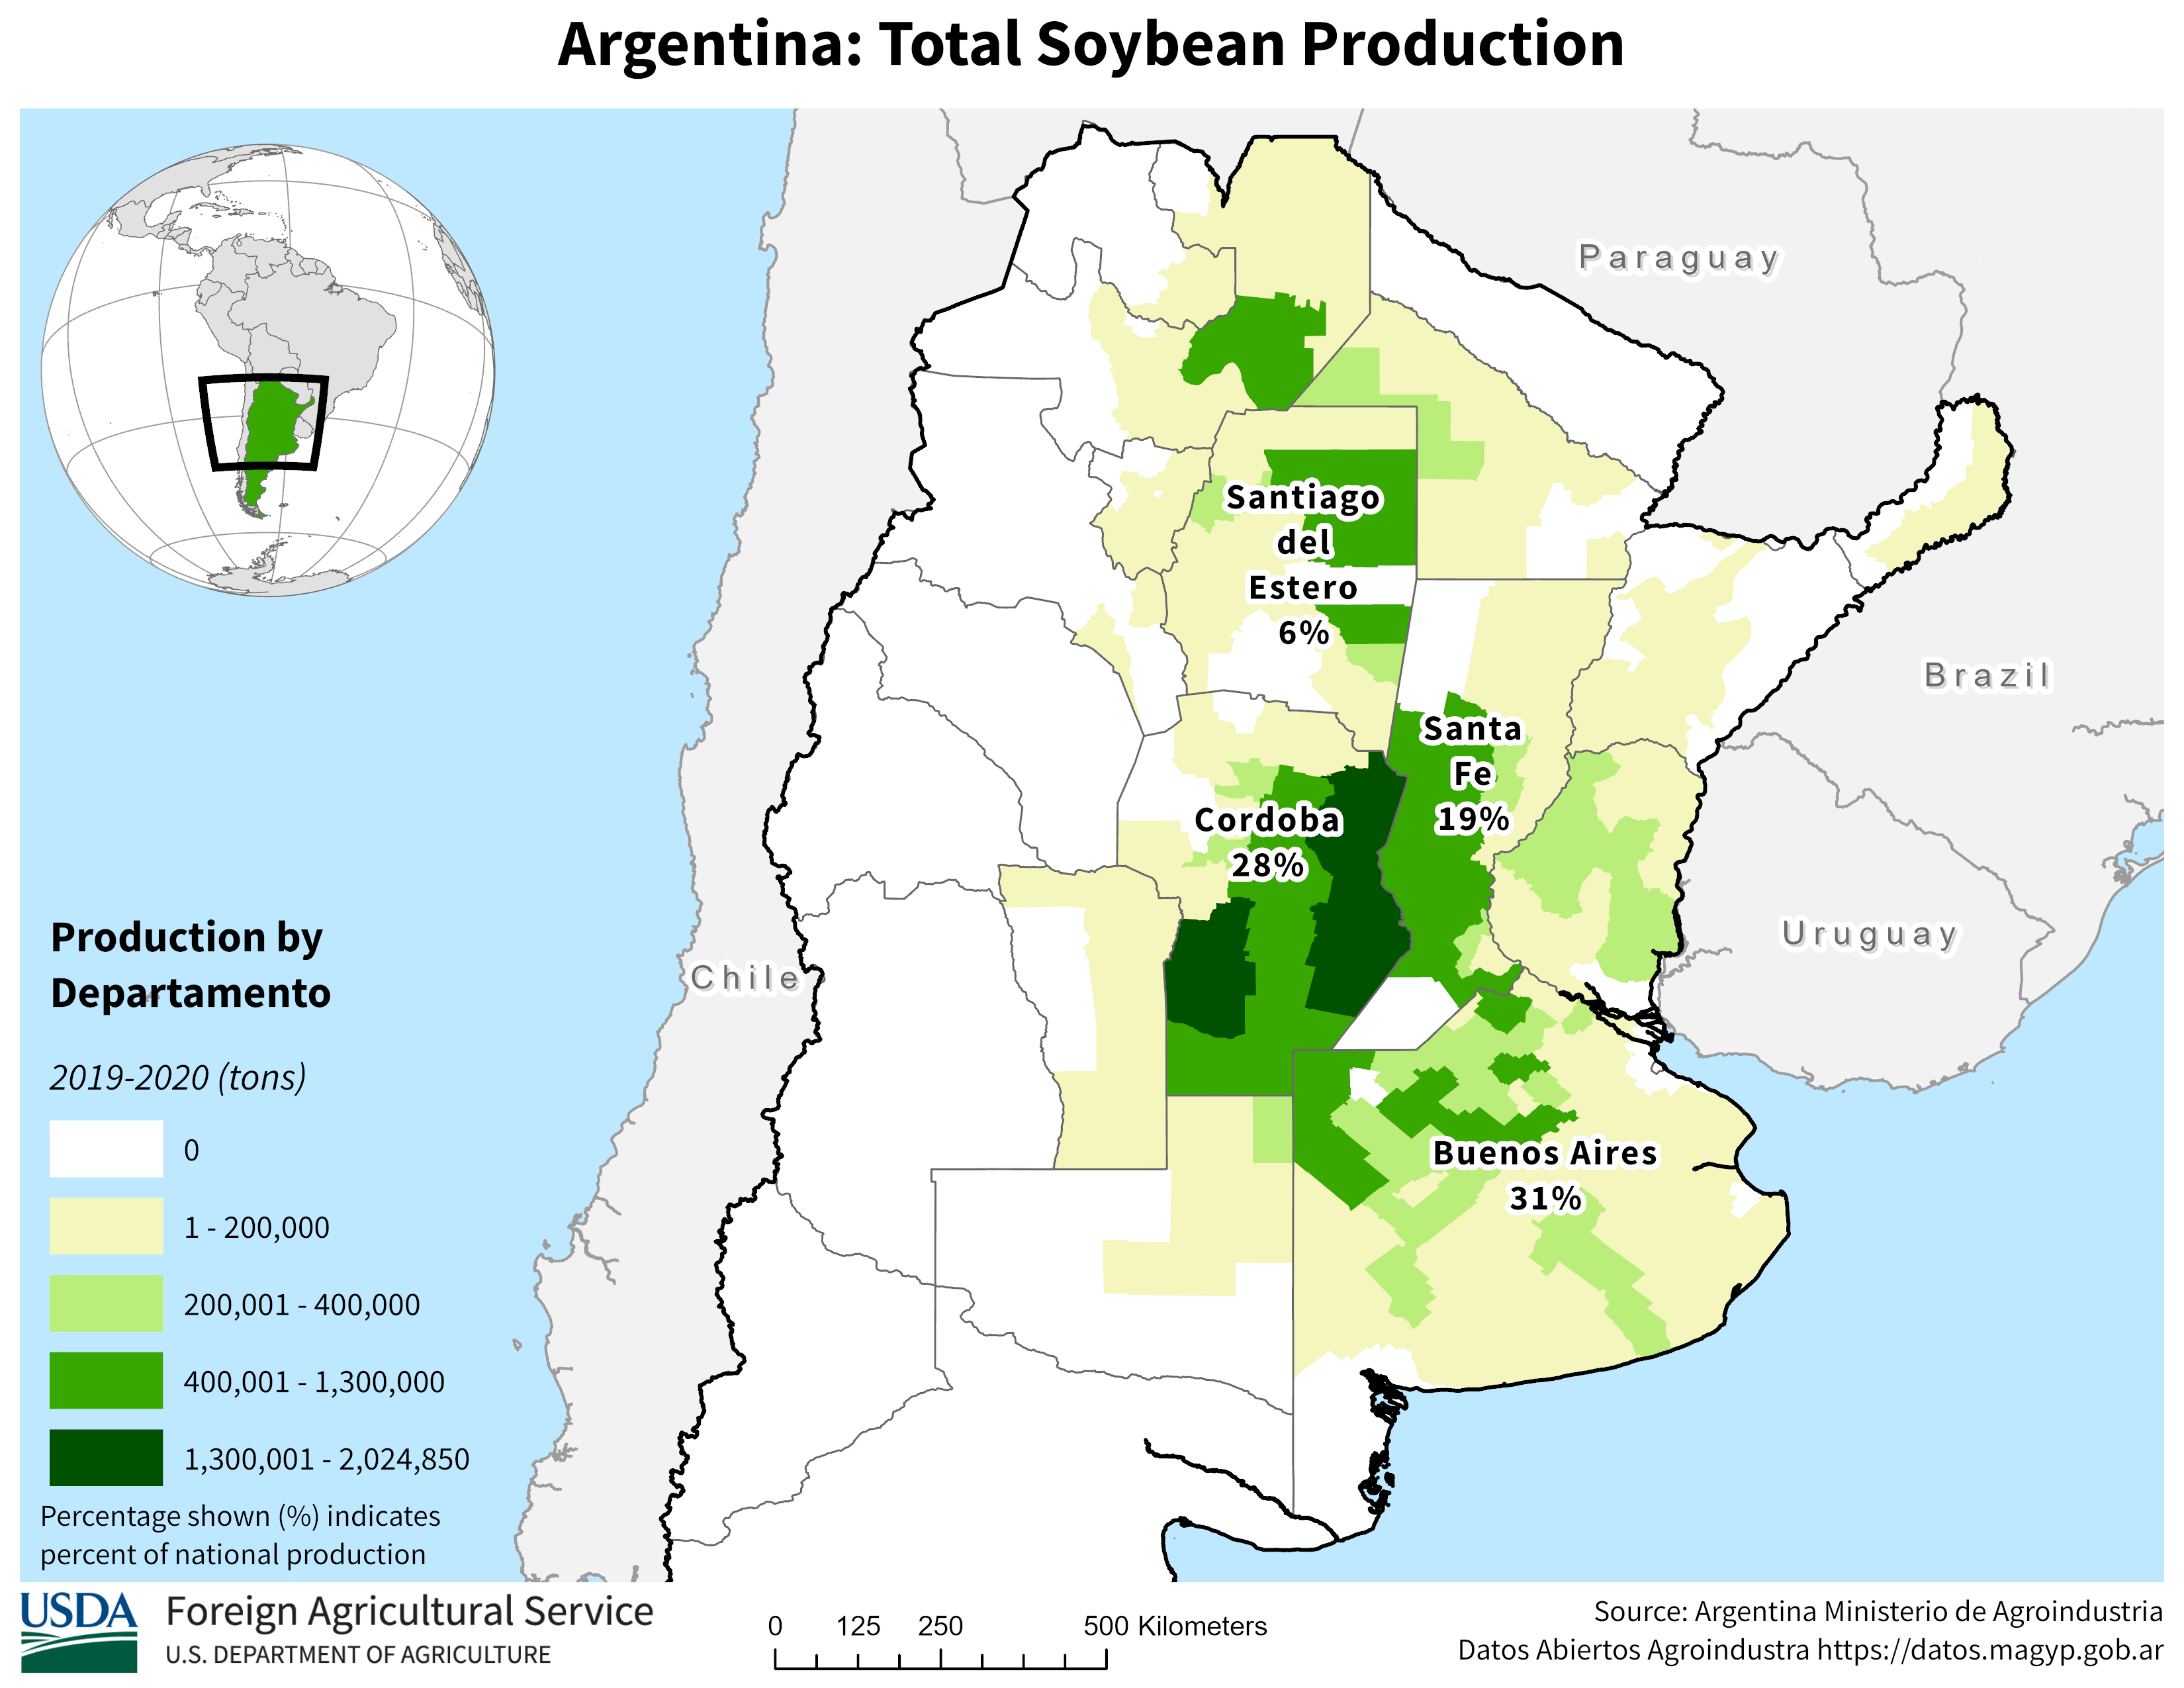
Beans may gap lower on the open Sunday Night with this forecast for Argentina:
1. Rains the thru 4 days on the just updated 18z GEFS.......not much yet for key production in drought stricken Argentina.
2. Rains thru 15 days-384 hours. Argentina gets huge rains, many place 4+ inches right on top of soybean farms!
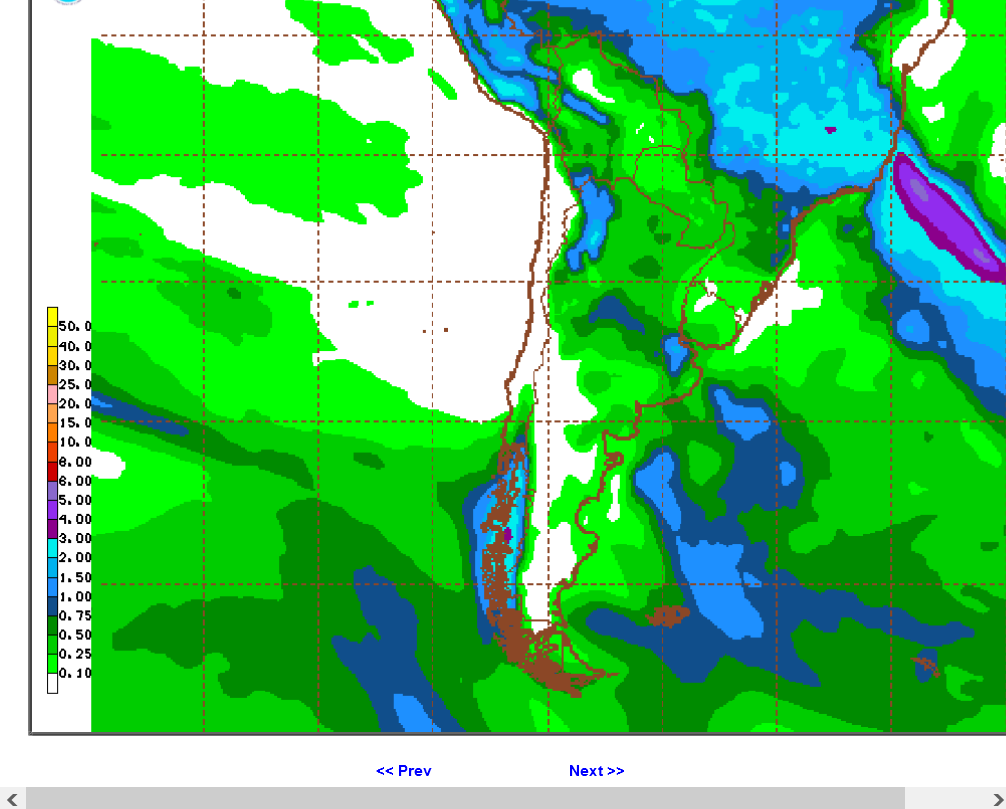
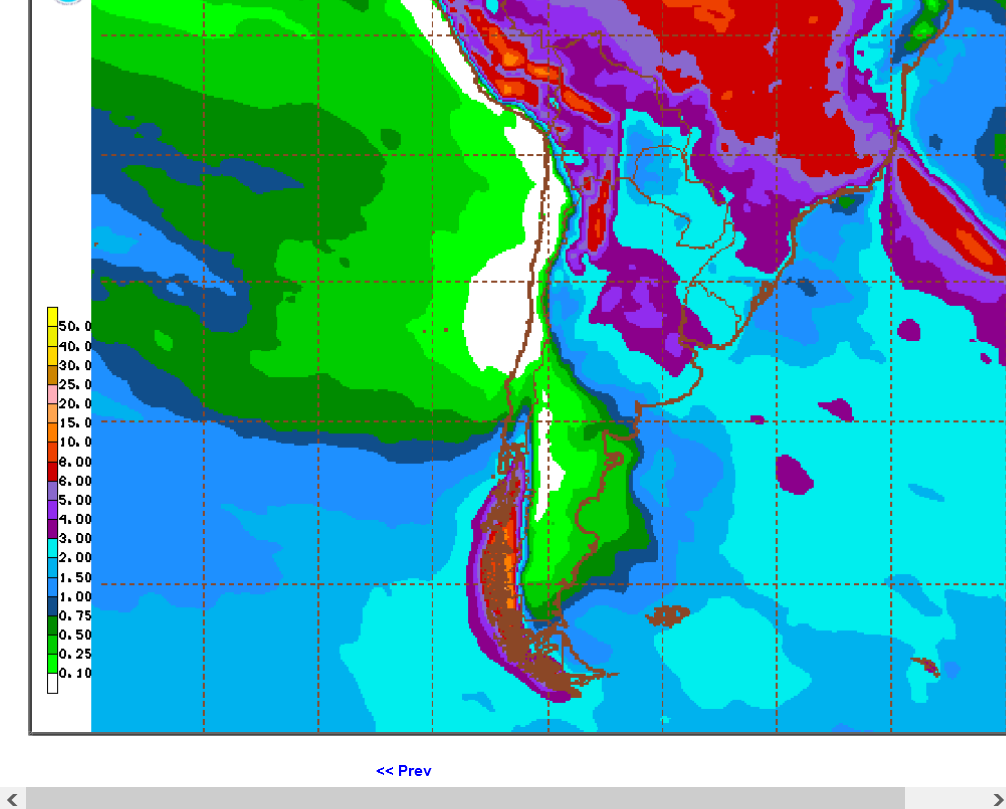
Look how extremely dry its been down there below
https://www.cpc.ncep.noaa.gov/products/Precip_Monitoring/Figures/global/n.90day.figb.gif
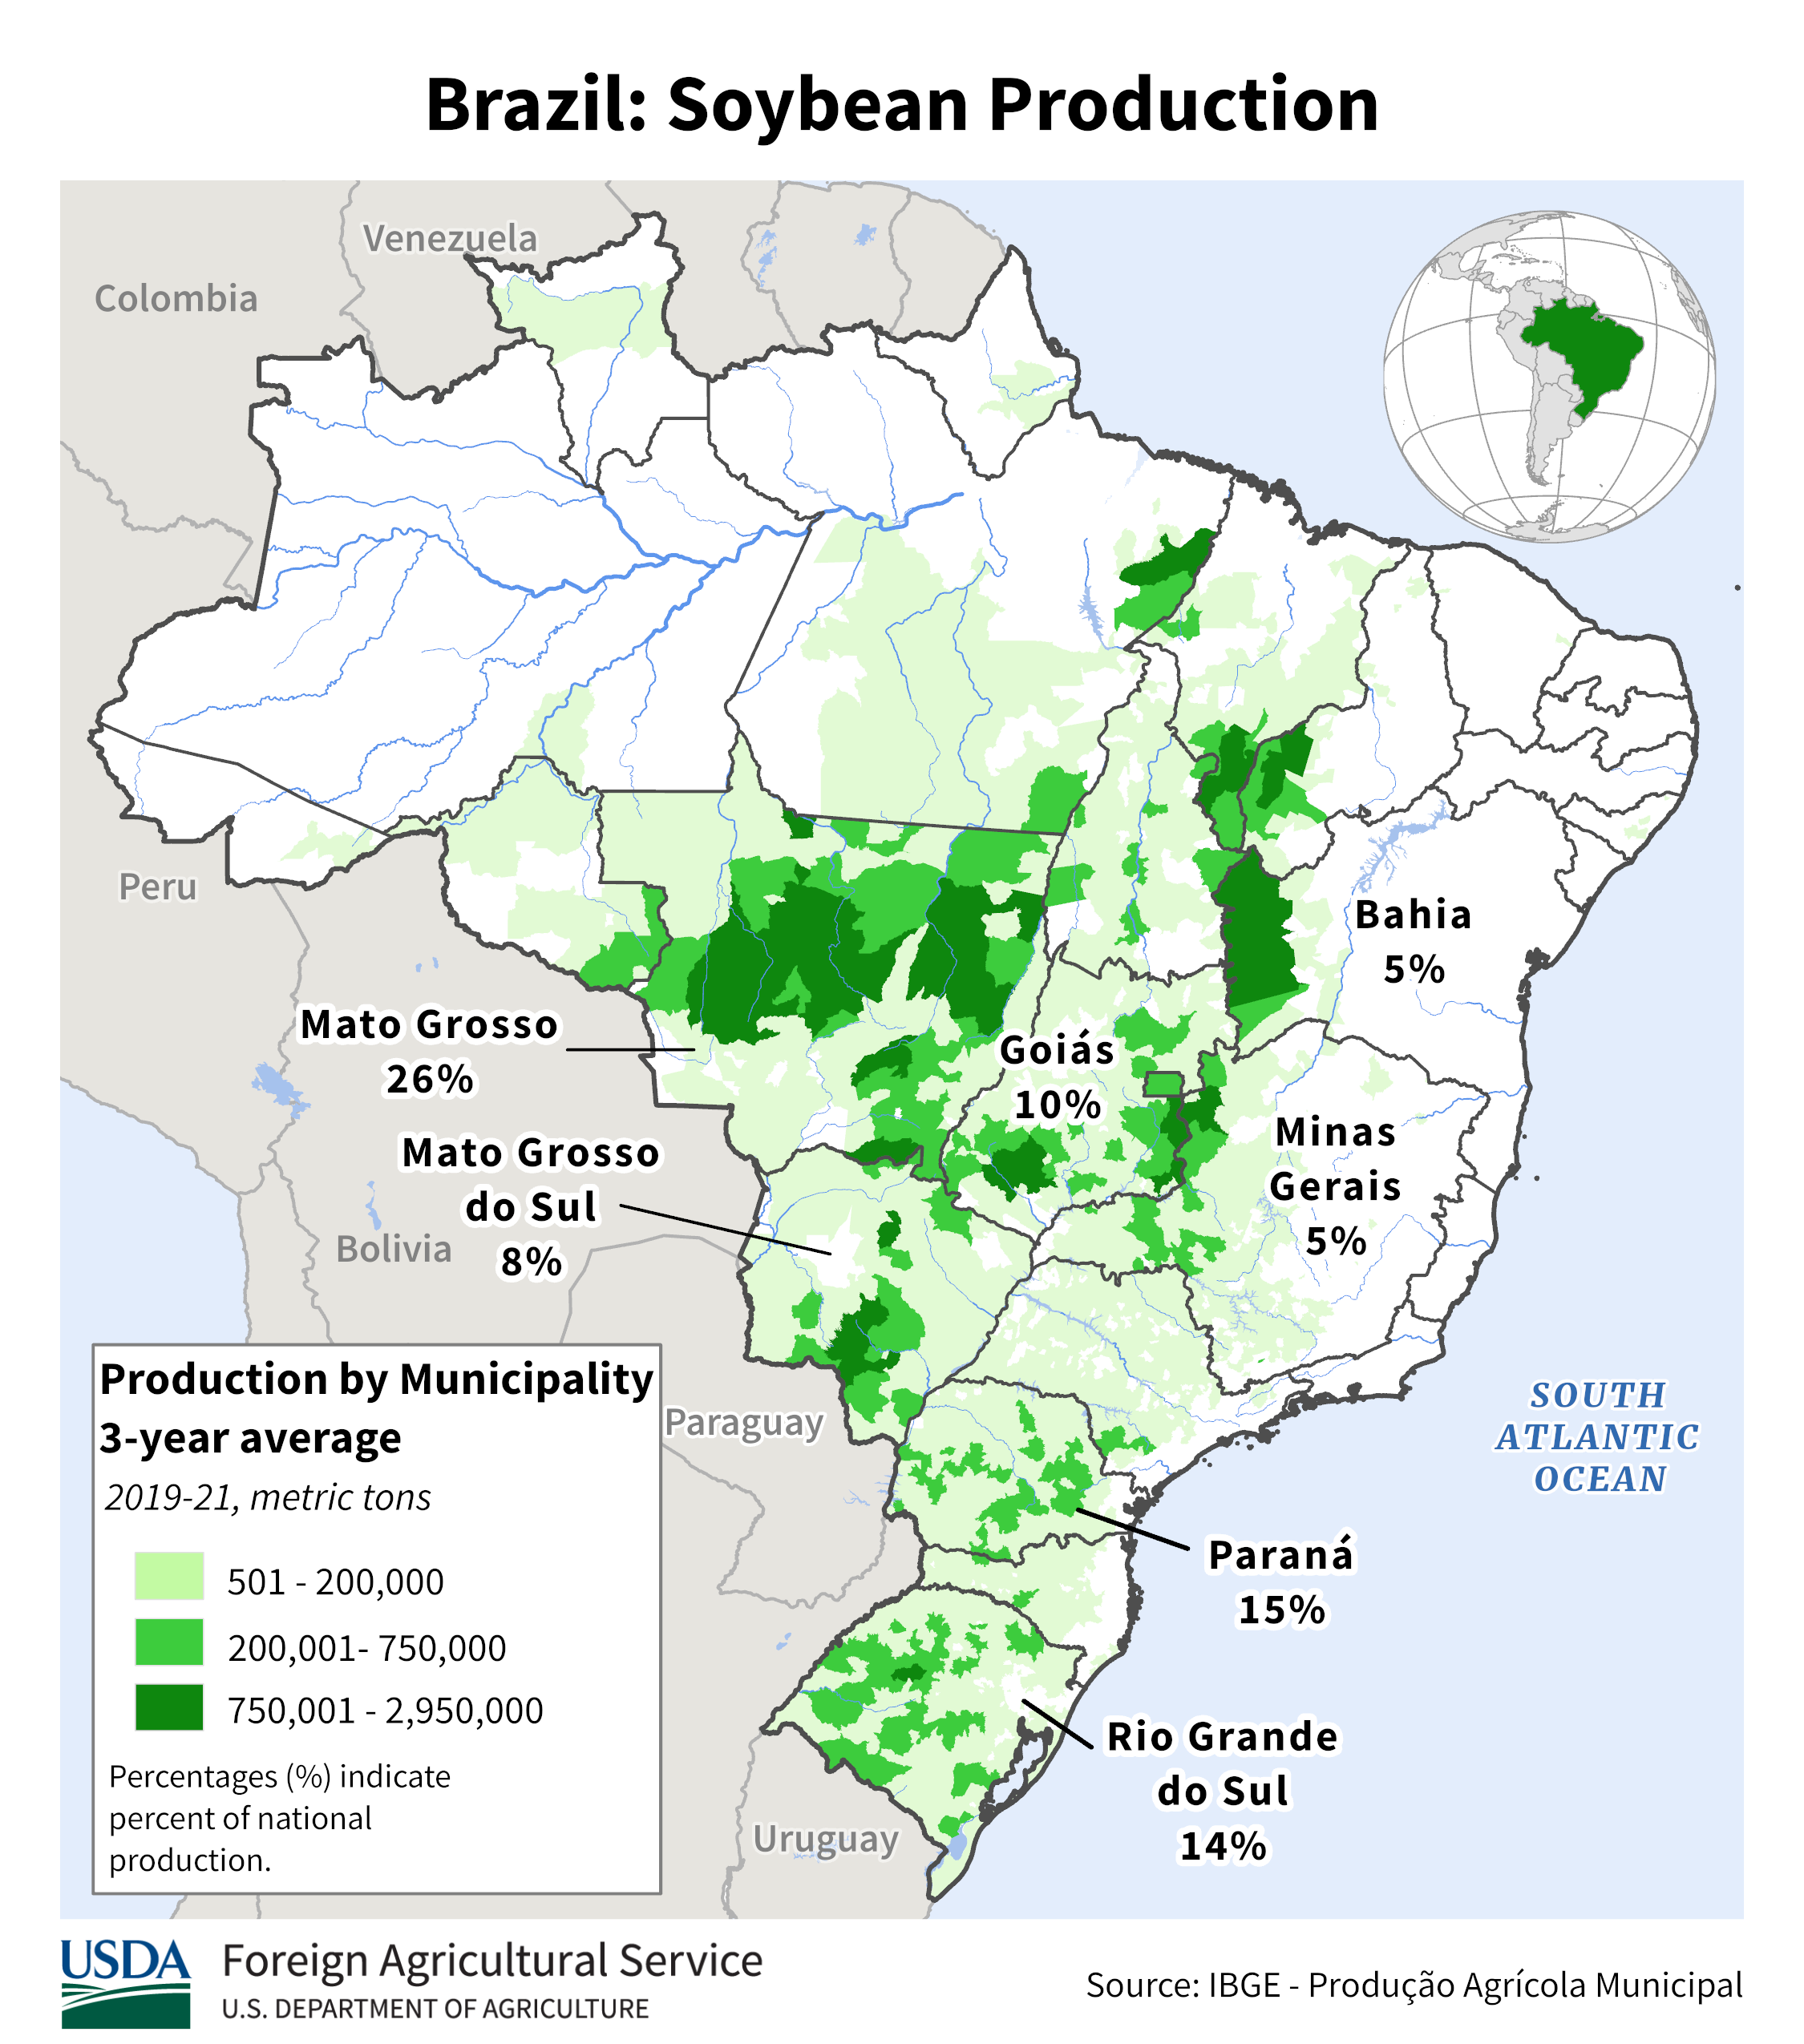
South America soybean production below
https://ipad.fas.usda.gov/rssiws/al/ssa_cropprod.aspx

https://ipad.fas.usda.gov/rssiws/al/crop_production_maps/Brazil/Municipality/Brazil_Soybean.png
NG has more reason to drop:
https://www.marketforum.com/forum/topic/91972/#92324