Thanks Mike!
Are you intentionally showing the top chart with a date at the bottom that ends in March 2022, which was 10 months ago?
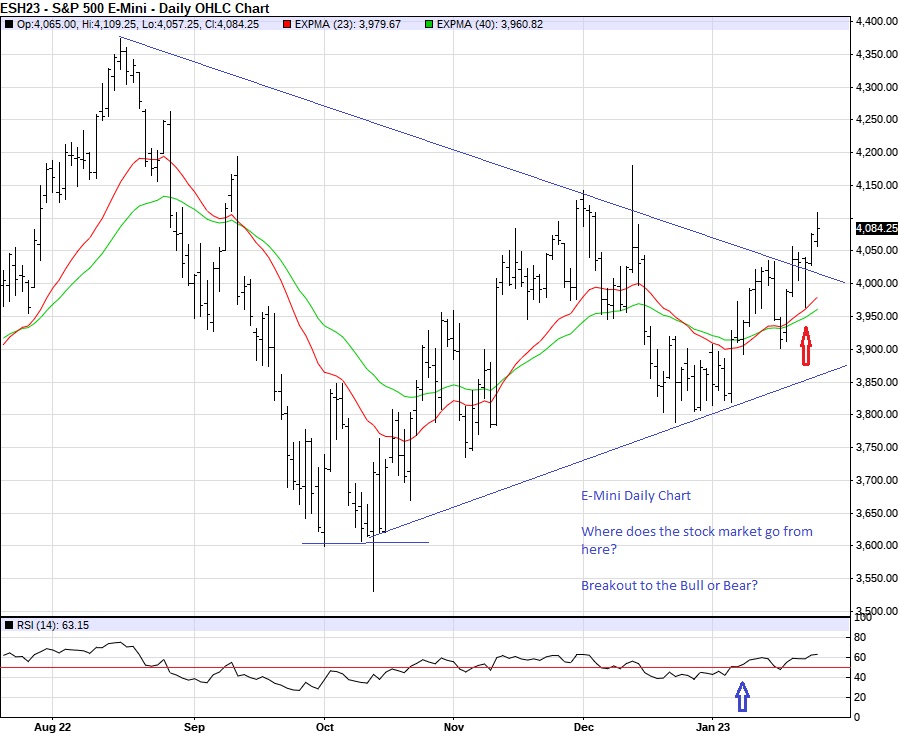
The bottom one shows higher lows at the end of December vs the October lows AND a rising RSI!
An impressive trend change and potential upside break out but only if confirmed by decisively getting above the December highs.
Could you delete the first chart? Thanks
Unfortunately, Mike if we delete the first post in any thread all the other ones go bye bye too )-: .............and we don't want to lose your 2nd one (-:
However, you can go in there to change whatever you want(but please don't delete it because this is a great thread).
Hi MTP,
What is the purpose of 2 MA rather than just one?
Is the x-crossover of the two an important factor for you as well as an abrupt change in direction?
John