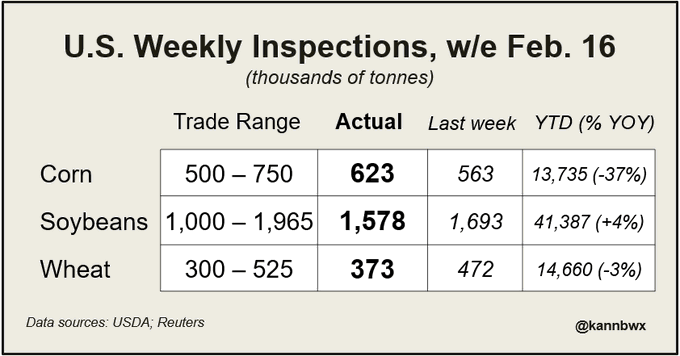
2-3 cargoes of #soybeans were added to the previous week's number, and the latest week was the sixth consecutive one with well above average bean volumes inspected at U.S. ports. Heading for a really strong Feb export number at this rate.
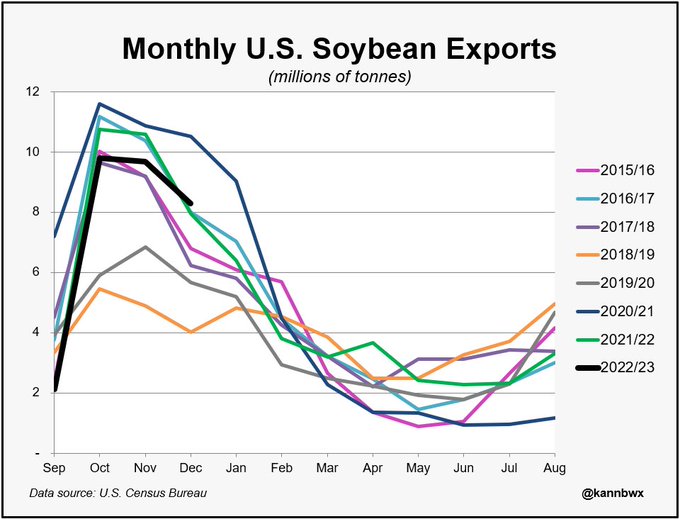
U.S. soybean exports may be on pace for a record Jan-Feb based on the inspection pace. Jan 2023 exports were likely 2nd all-time after 2021, tho shipments of #soybeans could be record in Feb. Prior Feb high is 5.7 mmt in 2016, five-yr avg is 4 mmt.
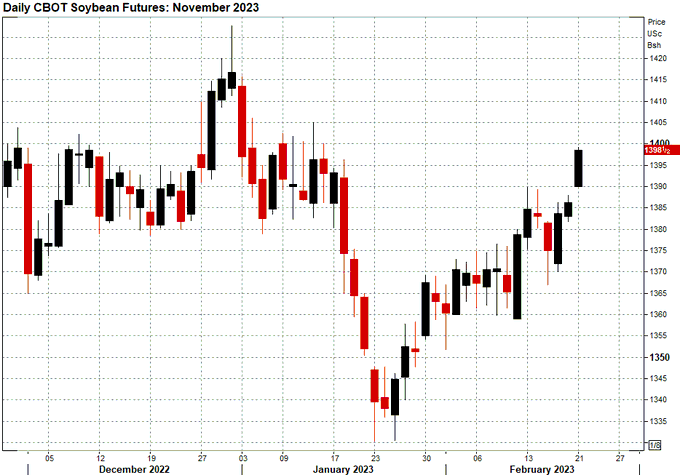
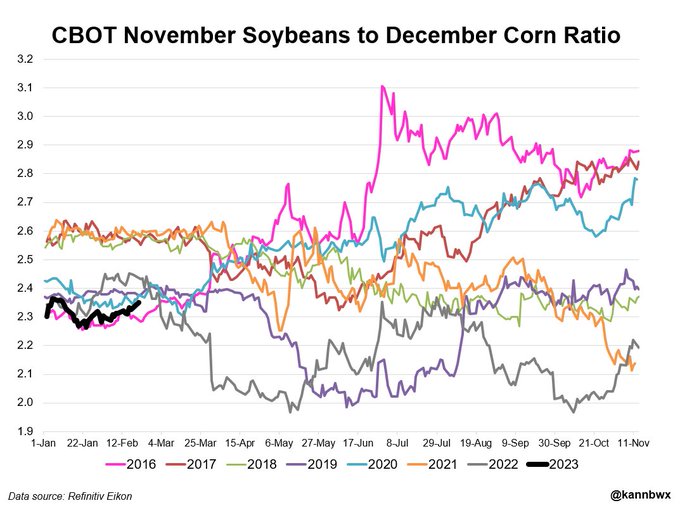
Feb. 21: CBOT Nov #soybeans are flirting with their first $14 reading since Jan. 13. As of mid-session Tuesday, they have risen about 2.5% on the month.
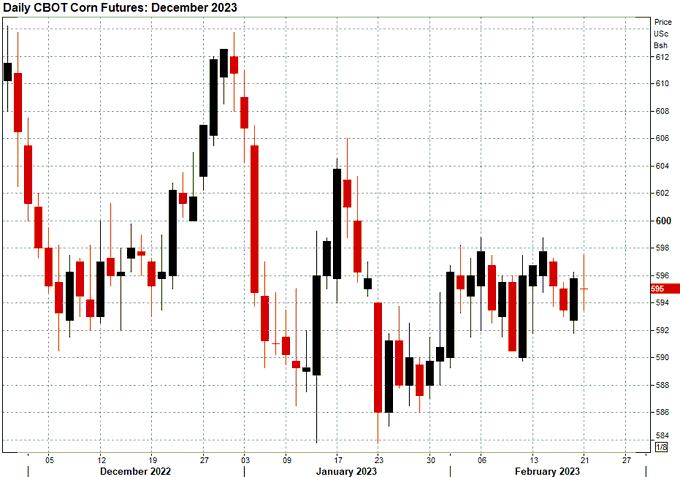
Dec #corn has drifted fractionally higher this month, trading at $5.95/bu mid-session Tuesday, equal to the month's average.
Bean/corn ratio has risen to about 2.35 from sub-2.30 to start the month, but I wouldn't exactly call this "buying bean acres" in the USA. Opinions may vary on that.
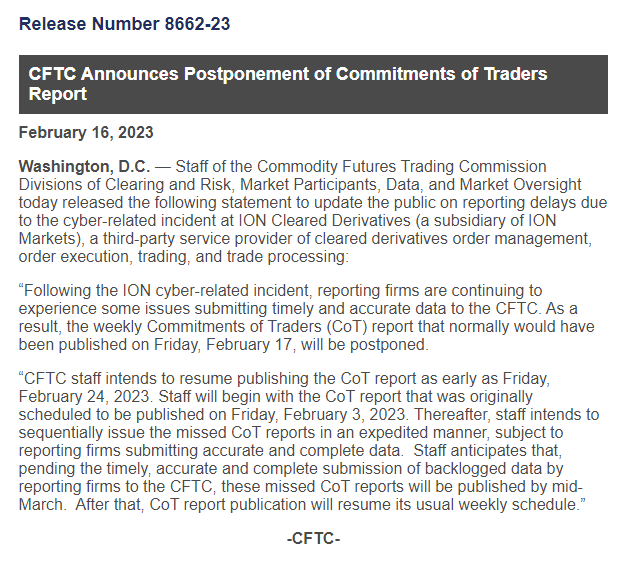
Best case scenario, this Friday we will see CFTC's Commitments of Traders report covering the week ended Jan. 31. This Friday we would normally expect the data through Tuesday (today), so a Friday release, if it happens, would still reflect a 3-week lag.
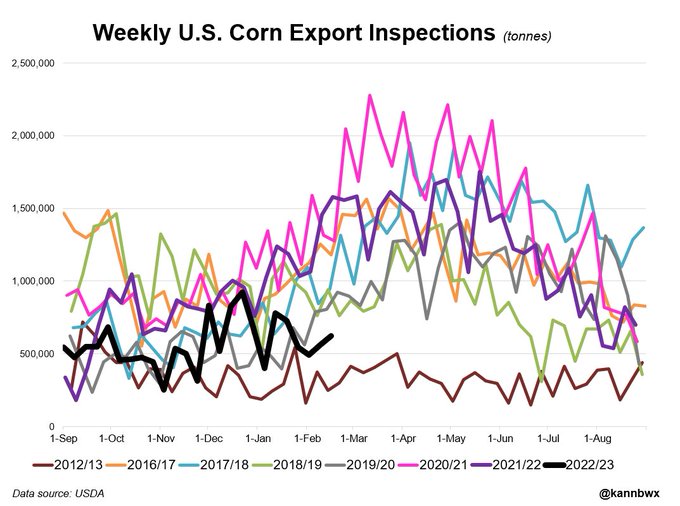
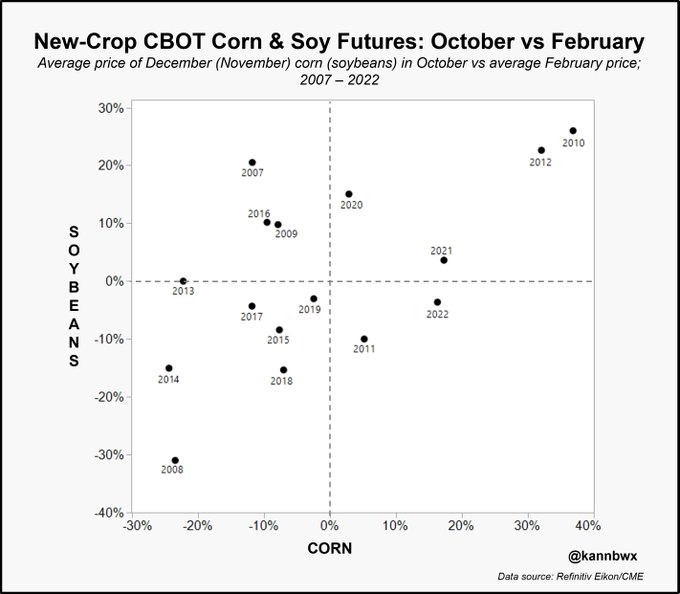
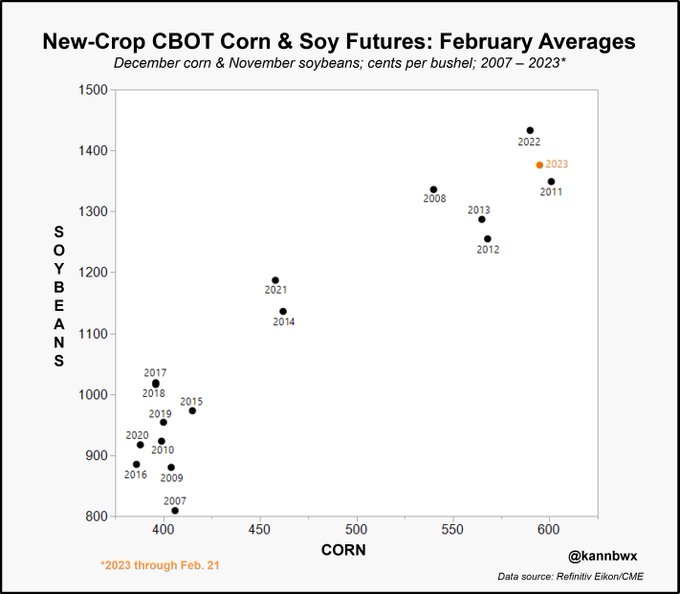
Both graphics above use data from this table that I have posted many times before. Sometimes it is useful to view in chart form.
In recent years, CBOT Dec #corn has been stronger in October than February in only two 3-year stretches: 2010-2012 and 2020-2022.Nov #soybeans last year were lower in Oct vs Feb when corn was higher, which isn't common. But beans have more often held against weaker corn.
Only 2022 and 2011 have matched this month's strength in new-crop #corn & #soybeans. But in supply-heavier years, average futures prices in Feb hovered near $4/bu for corn and $9-$10/bu for soy.